
Abstract
The complexity of the activated B-cell like (ABC) diffuse large B-cell lymphoma (DLBCL) subtype is probably not only explained by genetic alterations and methods to measure global protein expression could bring new knowledge regarding the pathophysiology. We used quantitative proteomics to analyze the global protein expression of formalin-fixed paraffin-embedded (FFPE) tumor tissues from 202 DLBCL patients. We identified 6430 proteins and 498 were significantly regulated between the germinal center B-cell like (GCB) and non-GCB groups. A number of proteins previously not described to be upregulated in non-GCB or ABC DLBCL was found, e.g. CD64, CD85A, guanylate-binding protein 1 (GBP1), interferon-induced proteins with tetratricopeptide repeat (IFIT)2, and mixed lineage kinase domain-like protein (MLKL) and immunohistochemical staining showed higher expression of GBP1 and MLKL. A cluster analysis revealed that the most prominent cluster contained proteins involved in the tumor microenvironment and regulation of the immune system. Our data suggest that the therapeutic focus should be expanded toward the tumor microenvironment in non-GCB/ABC subtype patients.
Introduction
The cell-of-origin (COO) concept, based on gene expression profiling (GEP), dividing diffuse large B-cell lymphoma (DLBCL) patients into germinal center B-cell like (GCB) or activated B-cell like (ABC) subtypes, is a well-established subclassification where ABC patients have an inferior survival [Citation1]. Indeed, determining COO is now mandatory in the diagnostic workup of DLBCL, either by GEP or immunohistochemistry (IHC) algorithms (the latter translating ABC into a non-GCB phenotype) [Citation2]. The hallmark of the ABC-type is constitutive activation of nuclear factor kappa B (NF-κB), often due to mutations in the B-cell receptor (BCR) signaling pathway [Citation3]. This has been the underlying rationale for adding drugs, such as bortezomib, ibrutinib, or lenalidomide, to standard immunochemotherapy (rituximab, cyclophosphamide, doxorubicine, vincristine, prednisone (R-CHOP)) for ABC patients. However, none of these combinations studied in phase III trials have shown clear clinical benefit [Citation4–6]. On the other hand, the complexity of ABC DLBCL is probably not only explained by genetic alterations or expressions and it is difficult to predict if the genetic aberrations will affect protein translation. Furthermore, the majority of the novel non-chemotherapeutic agents inhibit their targets directly at the protein level and not at the gene level, such as the BTK-inhibitor ibrutinib, the PI3K-inhibitor idelalisib or the BCL2-inhibitor venetoclax. So, even though the genomic landscape has been described in many malignancies, most tumors do not have a clear druggable genetic alteration [Citation7]. Instead, methods to directly study the global protein expression and interaction could bring new knowledge regarding the pathophysiology of DLBCL subgroups. Some global protein expression studies using a proteomic approach where non-GCB or ABC patients are compared to controls or their GCB counterpart have been published [Citation8–12]. Even though these studies show promising results, the results have been diverging which at least partly could be explained by the use of different techniques and perhaps foremost the low total number of included patients (ranging from a total of 6–42 patients).
So, with the aim to gain further insights in the COO subgroups regarding global protein expression and protein networks and possibly identify novel drug targets, especially for the ABC/non-GCB subtype, we performed a quantitative proteomic study on formalin-fixed paraffin-embedded (FFPE) tumor tissue from a large cohort (n = 202) of DLBCL patients.
Materials and methods
Patients
A total of 202 adult DLBCL patients in western Sweden diagnosed between 01/01/2004 and 31/12/2016, were included. All patients received immunochemotherapy (R-CHOP). Primary mediastinal large B-cell lymphoma, primary CNS lymphoma, HIV-related lymphoma, and transformed lymphoma were excluded. No additional fluorescence in situ hybridization (FISH) analyses were performed and previously unknown double-hit lymphomas were not actively excluded. Ethical approval was obtained from the Regional Ethics Review Board, Gothenburg.
Tumor tissues
Archived FFPE tissue sections from the time of diagnosis were reevaluated and cases showing large areas of blasts and with sufficient amount of tumor tissue were included. For the proteomic analyses, 1 mm diameter core biopsies were extracted from each patient sample.
Cell-of-origin (COO) determination
COO was determined using the Hans IHC algorithm [Citation13]. For 87 of the 202 patients, COO was also determined using the gene expression Lymph2cx chip.
Relative protein quantification (proteomic analysis)
A proteomic analysis was performed on the individual FFPE patient samples (core biopsies). In short (for full description, see Supplementary Information), proteins were extracted from the deparaffinized biopsies, digested into peptides that were labeled using 11-plex tandem mass tag (TMT) (Thermo Fischer Scientific, Waltham, MA) according to the manufacturer instructions. The samples were divided over 23 TMT-sets. A reference sample was included in all TMT-sets to be able to compare samples in different sets. The reference pool consisted of samples from each group to give representative and identical references. The TMT-sets were fractionated using basic reversed phase liquid chromatography (LC) and analyzed on an Orbitrap Fusion Tribrid mass spectrometer interfaced with a nanoLC system (Thermo Fisher Scientific). The data files were merged for identification and relative quantification using Proteome Discoverer version 2.2 (Thermo Fisher Scientific). Data were matched against SwissProt H. sapiens database (September 2018, using Mascot version 2.5.1. [Matrix Science] as search engine). The reference samples were used as denominator in each set for the calculation of ratios. The average ratio for a protein was calculated for each COO group and used for comparison between groups and fold change calculation.
Protein network analysis
The differentially regulated proteins were analyzed using Search Tool for the Retrieval of Interacting Genes/Proteins (STRING) version 11.0 (https://string-db.org/), using the high confidence score (>0.7). For pathway analysis, we used both the Kyoto Encyclopedia of Genes and Genomes (KEGG) and the Reactome database resources.
Tissue microarray (TMA)
Six tissue microarray (TMA) blocks with duplicate 1 or 0.6 mm diameter core biopsies were available from previous studies [Citation14,Citation15] for 192 patients.
Immunohistochemistry (IHC) of selected proteins
Proteins for IHC analyses were chosen according to: (i) differential regulation in the proteomic analysis between non-GCB and GCB, and (ii) a predominant nuclear or cytoplasmic expression enabling digital image analysis (DIA). Sections (4 µm) of the TMA blocks were stained with immunohistochemical antibodies for guanylate-binding protein 1 (GBP1) (dilution 1:150), interferon regulatory factor 8 (IRF8) (dilution 1:2000), mixed lineage kinase domain-like protein (MLKL) (dilution 1:500), myeloid cell nuclear differentiation antigen (MNDA) (dilution 1:500), superoxide dismutase (SOD1) (dilution 1:25), switch-associated protein 70 (SWAP70) (dilution 1:500), and wee1-like protein kinase (WEE1) (dilution 1:500), all from Abcam, Cambridge, UK. For comparison and evaluation of the cell type stained with GBP1 and MNDA, parallel staining were performed using CD3 and CD68 antibodies (ready to use) from Dako, Agilent, Santa Clara, CA.
Sections were scanned at 40× magnification and digitalized with a NanoZoomer S210 (Hamamatsu Photonics, Hamamatsu City, Japan). DIA was performed using the Visiopharm 2019.02 software (Hörsholm, Denmark) and for description of the DIA procedure, see Supplementary Information. Antibodies for BCL6, CD10, MUM1, BCL2, and MYC were partly evaluated as per routine diagnostic workup and partly on TMAs. Cutoff values for designing cases as double expressers (DE) were ≥50% positive lymphoma cells for BCL2 and ≥40% for MYC [Citation2,Citation16].
Statistical analysis
Proteomic data analyses were performed in R version 3.6.1. (Vienna, Austria) and NormalyzerDE version 1.2.0 was used for dataset overview and data normalization using Cyclic Loess from the LIMMA package. A principal component analysis (PCA), an unsupervised multivariate method, was also performed for data overview and detection of trends and outliers. Differential expression analyses were performed using the TMT set number as covariate. Initial analyses were performed using LIMMA, but to allow for differential expression analysis of proteins with missing values in some sets, ANOVA was used for the main study. In this setup, normalized (log2-transformed) abundance values for samples from the COO groups to be compared, were extracted for each protein, and a two-way ANOVA was performed if at least four abundance values per sample group existed. Adjusted p values (for multiple comparisons) were calculated using the false discovery rate (FDR) method and a p value <.05 was considered significant. Log2 fold change was calculated based on the mean difference between the COO groups. Multiplexing reduces the technical variability between samples to a few percent [Citation17]. As the biological variability in FFPE sample preparations could vary, a power analysis with an estimated overall (technical and biological) variation of 50% and power set at 0.8, showed that at least 98 biological replicates per group were needed to use a corrected fold change of ≥1.20 reliably [Citation18]. Pearson’s chi-square test and Mann–Whitney U-test were used to compare the different clinical characteristics and immunohistochemical biomarkers between the two COO patient groups (SPSS, version 26).
Results
Patients
We analyzed FFPE tumor samples from 202 DLBCL patients, 100 patients with GCB, and 102 patients with non-GCB subtype as classified by the Hans algorithm. For the 87 patients also analyzed with the Lymph2cx chip for COO, the two methods overlapped in 61 cases (70%). Among the non-overlapping cases, the majority (14 cases) were non-GCB by Hans and unclassifiable by Lymph2cx. Seven changed from non-GCB to GCB, four from GCB to ABC, and one from GCB to unclassifiable by Lymph2cx. Patient characteristics are shown in . Non-GCB patients had an inferior lymphoma-free survival (p = 0.019) but there was no difference in overall survival (p = .23) (Supplementary Information).
Table 1. Clinical and immunohistochemical characteristics.
Proteomic analysis: identification of differentially regulated proteins between non-GCB and GCB patients
In total, 6430 proteins could be identified (among these the B-cell antigens CD19, CD20, CD22, CD79a, and PAX5). Initially, we performed a PCA analysis but found no trend for separation between the two COO groups regarding the first two components and only a weak trend between the second and third components was noticed (Supplementary Figure 1(a,b)). Also, when comparing the proteins overexpressed in the non-GCB group according to this analysis, there was minimal matching with the overexpressed proteins using the Hans algorithm or Lymph2cx classification. Thus, it appears as if global protein expression profiling by itself does not allow a reliable separation between the COO groups. Instead, by using the Hans algorithm we found that 498 proteins were differentially regulated (p<.05 adjusted for multiple comparisons and a fold change ≥1.20) between non-GCB and GCB patients (Supplementary Table 1). Of these, 224 proteins were upregulated in the non-GCB group (Supplementary Table 2) while 274 proteins instead were upregulated in GCB patients (Supplementary Table 3). Among the most upregulated proteins in non-GCB were several well-known ABC-associated proteins (e.g. IRF4/MUM1, ENTPD1, ETV6, IL-16, and STAT3) while in the GCB group both BCL6 and CD10 were upregulated, confirming the separation based on the Hans algorithm. Furthermore, among the most upregulated proteins in the non-GCB group, a number of proteins previously not described to be upregulated in ABC DLBCL were found, e.g. CD64, CD85d, IDO1, MLKL, interferon-induced proteins with tetratricopeptide repeat (IFIT)2, IFIT3, S100-A8, S100-A9, and GBP1.
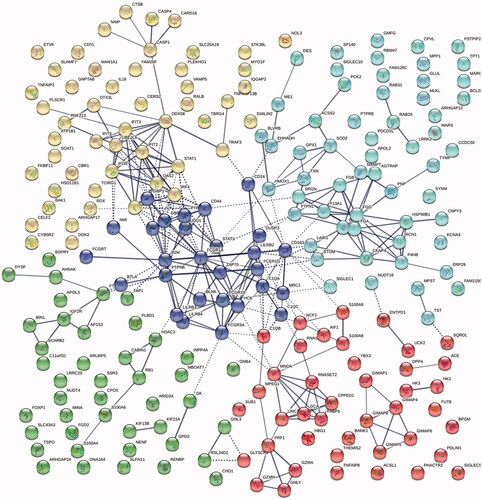
Figure 1. A k-means cluster analysis of the 224 proteins (with a fold change ≥1.20) showing two predominant clusters: one (yellow) centered round the well-known ABC-protein IRF4/MUM1 and other interferon-induced proteins (predominantly IFIT 2, IFI 35, IFIT3, and IFIT5), and one (dark blue) around immunoglobulin receptors.
We also compared the protein expression in patients where the COO subtypes were determined using the Lymph2cx chip: ABC (n = 30) versus GCB (n = 42). When comparing the top 20 upregulated proteins in ABC patients, 16 of these proteins were also upregulated in the non-GCB group (with TNFRSF13B/CD267 and IRF4/MUM1 among the top 5 proteins in both groups) (Supplementary Table 4).
When checking the gene–protein correlation between the genes used in the Lymph2cx chip and protein expression in our data, we found that 5 proteins of the 8-gene Lymph2cx panel for ABC-DLBCL were upregulated in non-GCB patients, and of the seven genes used to determine GCB-DLBCL, four proteins were upregulated in our GCB patients. In addition, several of the most upregulated proteins in the GCB group have previously been annotated to a GCB subtype (such as ABCC4, BCL6, CD10, PALD1, and TBC1D4; data not shown).
Protein interaction and network analysis
With STRING analysis, a majority of the 224 proteins upregulated in the non-GCB subtype were closely linked, with an enrichment p value <1 × 10⁻¹⁶ and among the most enriched pathways according to Reactome Pathways were ‘Interferon signaling’ (1.9 × 10⁻⁸), ‘Immunoregulatory interactions between a lymphoid and a non-lymphoid cell’ (2.5 × 10⁻⁵), ‘Toll-like receptor cascades’ (0.0001), and ‘Fc gamma receptor activation’ (0.0008). When performing a k-means cluster analysis (annotating five clusters) (), we found two predominant clusters: one centered round the well-known ABC-protein IRF4/MUM1 and other interferon-induced proteins (predominantly IFIT 2, IFI 35, IFIT3, and IFIT5), and one around immunoglobulin receptors (such as FCGR1A (CD64), FCGR2A (CD32), FCGR3A (CD16a), LILRB2 (CD85d), and LILRB4), NF-κB-related proteins (e.g. STAT3, ZAP70, CD44, and B-cell linker protein) and macrophage receptor proteins (e.g. CD163, CD14, and MRC1).
When focusing on the top 40 upregulated proteins in the non-GCB group (), we found that the majority again were tightly linked (<1 × 10⁻¹⁶) and the two of the most enriched pathways were ‘Immune system’ (1.1 × 10⁻¹⁰) and ‘Interferon-ϒ signaling’ (2.4 × 10⁻⁵). A cluster analysis showed that the most prominent cluster contained a number of proteins (e.g. CD16a, CD32, CD64, CD85d, CD163, GBP1, S100-A8, S100-A9, and MNDA) involved in the tumor microenvironment, adaptive immune response, and regulation of the immune system (). Instead, when looking at the 40 most downregulated proteins in this group (), we found proteins needed for the maintenance of adequate function of the adaptive tumor immune response (e.g. several MHC class II complexes, CD27, and CD83).
Figure 2. A k-means cluster analysis of the top 40 overexpressed proteins in the non-GCB subgroup showing a dominant cluster involved in several aspects of immune response (green).
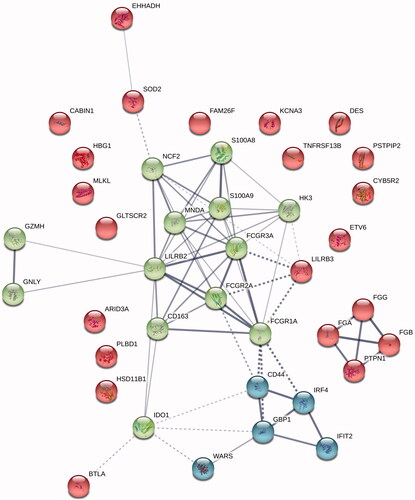
Table 2. The 80 (40 + 40) proteins with the highest and lowest relative expression in non-GCB patients versus GCB patients.
Immunohistochemical staining of selected proteins
Results from the IHC staining, comparing GCB and non-GCB patients, are given in and illustrated in . To summarize, for all antibodies (except SOD1 where no differences were found) the IHC staining showed a significantly different expression pattern between GCB and non-GCB patients confirming the results from the proteomic analysis. The IHC analyses for GBP1, MLKL, and MNDA all showed a significantly larger proportion of positive cells as well as stronger staining intensity in non-GCB compared to GCB patients. For GBP1 the positive cells mainly consisted of macrophages and only in a few cases a faint staining in the lymphoma cells was seen (). For MNDA, positively stained cells were to a large extent interpreted as being small lymphocytes, most likely CD3-cells () and only a small proportion of the cases had a clear staining of the lymphoma cells ().
Figure 3. Immunohistochemical staining of formalin-fixed, paraffin-embedded tumor tissue (magnification 40×) for GBP1, MLKL, and WEE1 with corresponding pseudo-colored images from the digital image analyses (blue = negative, green = positive with weak intensity, yellow = strong intensity). GBP1: (a, b) High proportion of positive cells (black arrows indicate negatively stained tumor cells and red arrows indicate what was interpreted as macrophages) and strong cytoplasmic staining intensity in a non-GCB case, and (c, d) weak staining intensity and low proportion of positive cells in a GCB case. Parallel staining with GBP1 (e) and CD68 (f) indicating that GBP1 predominantly stains macrophages. MLKL: (g, h) Nearly all tumor cells are positive with high proportion of strong cytoplasmic staining, exemplified by a non-GCB case, and (i, j) only scattered positive cells in a case of GCB. WEE1: Nearly all tumor cells in all cases showed positive nuclear staining but with a higher proportion of weak intensity and lower proportion of strong intensity for non-GCB as exemplified by (k, l) and vice versa for GCB as exemplified by (m, n).


Figure 4. Immunohistochemical staining of formalin-fixed, paraffin-embedded tumor tissue (magnification 40x) for MNDA. Parallel staining with MNDA (a) and CD3 (b) indicating that MNDA predominantly stains small lymphocytes being CD3-positive T-cells. In (a) black arrows indicate negatively stained tumor cells and red arrows indicate nuclear positivity in small lymphocytes. In a few cases, a clear nuclear positivity in the lymphoma cells was seen (c) and such pattern was especially found in cases when MNDA was positive in ≥50% of all cells (which was less than 10% of the total cases in the study).
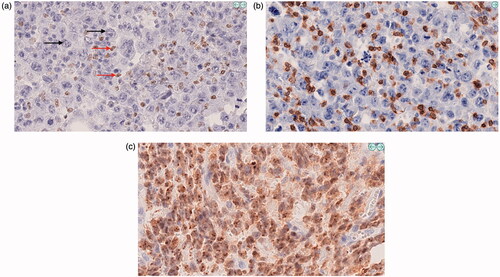
Table 3. Immunohistochemical stainings for selected proteins from the proteomic analysis, comparing GCB and non-GCB patients.
For the proteins that were upregulated in GCB patients in the proteomic analyses, IHC for IRF8 and SWAP70 also showed a significantly larger proportion of positive cells in GCB patients. For WEE1, GCB patients showed a significantly higher staining intensity than non-GCB patients.
Discussion
In this proteomic study comprising 202 DLBCL patients, we found that the global protein expression was separate between GCB and non-GCB-patients and we could identify a number of proteins in the non-GCB subtype, previously not described as upregulated in DLBCL. Furthermore, we identified protein clusters and also individual proteins involved in the adaptive immune response, seemingly correlated to different aspects of tumor immune response dysregulation in non-GCB patients.
For many tumors, the microenvironment is associated with a marked immunosuppression leading to impaired anti-tumoral activity and tumor evasion [Citation19]. In DLBCL, there are several different mechanisms described: inactivation of the CD58 gene that is implied in the loss of recognition of tumor cells by cytotoxic T and NK cells, overexpression of tumor-associated macrophages (TAM) and immunosuppressive signaling from the extracellular stroma (reviewed in [Citation20]). Most interestingly, we found a number of proteins and protein clusters involved in different features of the immune response and microenvironment differentially regulated in non-GCB versus GCB patients. First, proteins correlating to both the M1- and the M2-type of TAMs were upregulated (CD32, CD64, and CD163) in non-GCB. It has been shown that overexpression of CD163+ macrophages is related to inferior survival in DLBCL [Citation21–23]. Recently, by using a bivalent T-cell engager (BiTE) recognizing CD3ε on T cells and CD206 on M2-like macrophages in clinically relevant ex vivo models, it was shown that selective depletion of specific M2-like TAMs subsets was achieved, which could open the possibility of eradicating cancer-supporting TAMs whilst sparing those with anti-tumor potential [Citation24]. Second, interaction between LILRB or CD85d (upregulated in non-GCB) and myeloid cells involved in antigen processing and presentation has been shown to exert regulatory functions and to be utilized by tumor cells to evade immune surveillance [Citation25]. Third, MLKL and several (damage-associated molecular pattern (DAMP) proteins (e.g. S-100A8, S100A9, fibrinogen-α, and granulysin) were upregulated in the non-GCB group. MLKL is one of the main mediators of necroptosis, which is a regulated necrotic caspase-independent cell death machinery, by disrupting the cell membrane. This rupture leads to release of cell contents, which in turn causes exposure of DAMPs and thereby induces immunogenic inflammatory responses [Citation26]. Although necroptosis has been shown to execute anti-tumor functions in different cancers, there is also growing evidence that necroptosis could play a dual role. Indeed, it has been described to promote both tumor progression and metastasis, e.g. in breast cancer [Citation27], glioblastoma [Citation28], and pancreatic cancer [Citation29] by modulating the tumor microenvironment. Fourth, CD27 (downregulated in the non-GCB group), plays a key role in T-cell activation by providing a costimulatory signal and thereby enhancing T-cell proliferation and differentiation to effector T-cells and has the potential as an immune modulatory target in cancer treatment [Citation30]. Varlilumab, a novel first-in-class, agonist CD27 antibody which causes T-cell activation and antitumor activity in tumor models, has been tested in a phase I study and was found to be both safe and with some clinical activity in patients with advanced solid tumors [Citation31]. Fifth, a number of MHC class II proteins were downregulated in non-GCB patients, and it is well known that impaired MHC class II expression limits T-cell-dependent antitumor immunity [Citation32]. Sixth, several interferon-activated proteins, including GBP1 and IFIT-2, -3, and -5) were upregulated in non-GCB patients. GBP1, a known target for IRF4/MUM1 [Citation33], is expressed in a variety of cells in the immune system, and its role in cancer seems to be context-related as both favorable and unfavorable prognostic impact is described [Citation34]. It is somewhat unclear if GBP1 exerts these effects by acting within cancer cells or through the microenvironment, however, it was most recently shown that GBP1 recruited M2 macrophages and thereby promoted glioblastoma progression [Citation35]. In addition, overexpression of GBP1 has been correlated to chemoresistance to paclitaxel in breast [Citation36] and ovarian cancer [Citation37] and increased GBP1 gene expression may play an important role in the development of multi-drug resistance [Citation38]. The knowledge of IFIT proteins and their role in cellular signaling is limited to the antiviral immune response and innate immunity. However, recent studies on IFIT functions have implicated a role in cancer progression and they are negative prognostic markers in several cancers [Citation39]. Seventh, non-GCB patients also had an upregulation of the antiphagocytic signal CD47 (fold change 1.17; p = .005). Anti-CD47 antibodies can induce phagocytosis of tumor cells by the blockade of CD47 and a clinical study using the Hu5F9-G4 antibody, a macrophage immune checkpoint inhibitor blocking CD47, together with rituximab, showed a promising effect in refractory/relapsed DLBCL patients [Citation40]. A most recent study found that high mRNA expression of CD47 was associated with inferior overall survival in non-GCB patients and that CD47-blockade only augmented rituximab-mediated phagocytosis in non-GCB cell lines [Citation41], indicating that non-GCB patients could benefit from such treatment. All taken together, our findings indicate that a therapeutic focus on the tumor microenvironment in non-GCB/ABC patients should be more actively addressed.
As previously mentioned, there are some published proteomic studies comparing the two COO patient subtypes. The perhaps most comprehensive so far was performed in 2015, and aimed to analyze if ABC and GCB patients could be defined using a quantitative SILAC-based proteomic approach [Citation8]. They found that the two patient subgroups could be separated by their global protein profile and also by using a panel of only four proteins. Interestingly, when comparing our data with their findings, there is a strong overlap which strengthens our results. The 10 most important proteins upregulated in the ABC subtype in their study correlated with proteins in our non-GCB subgroup. Furthermore, for the six most important proteins in their GCB patients, three of them were also upregulated in the GCB subgroup in this study. In a recent proteomic study [Citation12], which also could separate ABC and GCB patients by their global protein profile in FFPE samples (n = 42), we could significantly reproduce 6 of 8 proteins in their separating 8-protein signature. Three other smaller studies have also performed proteomic COO analyses in DLBCL patients [Citation9–11]; however, they could not reproduce well-known COO proteins and even if there was some minor overlap, none of their top-upregulated proteins in the different subgroups were upregulated in our study. In summary, we believe that the reliability of our protein identification and expression patterns is high, judging by the overlap both of the proteins identified by the Deeb and Reinders studies and most of the corresponding genes separating the ABC subtype from GCB in the Lymph2cx gene chip, as well as a reproduction of some of the differentially regulated proteins using immunohistochemical staining.
During recent years, four large genetic studies have suggested that DLBCL could be further subclassified, mostly within but also outside of the COO classification [Citation42–45]. Still, even though pointing in the same direction there are discrepancies, and resolving the remaining disparities would require additional whole-genome and transcriptome sequencing of a large number of tumors [Citation46]. Moreover, when such subgroups have been firmly identified, there is a need for more simple algorithms for patient classification in order to enable inclusion in clinical trials. So, it appears as if the COO concept nonetheless is relevant today and that further studies on possible new targets in the non-GCB/ABC subtype could be of clinical importance.
In conclusion, we found a number of upregulated proteins in the non-GCB/ABC subtype, many of them associated with a dysregulated anti-tumor immune response, indicating the need for expanding the therapeutic focus toward the microenvironment in these patients. Even though functional studies aimed at individual proteins and protein-drug interactions to evaluate possible clinical effect are needed, our study highlights proteins that could be potential druggable targets in non-GCB/ABC DLBCL patients.
GLAL-2021-0084-File025.docx
Download MS Word (9.9 MB)GLAL-2021-0084-File024.xlsx
Download MS Excel (20.9 KB)GLAL-2021-0084-File023.xlsx
Download MS Excel (89.7 KB)GLAL-2021-0084-File022.xlsx
Download MS Excel (87.8 KB)GLAL-2021-0084-File021.xlsx
Download MS Excel (707.4 KB)Acknowledgments
The authors also like to thank Shahin De Lara, Department of Pathology, Sahlgrenska University Hospital, for the performance of TMA sectioning, optimizing and performance of IHC stainings and Kristina Lövgren, Department of Oncology and Pathology, Lund University Cancer Center, Lund University and Ylva Magnusson and Göran Landberg, Department of Pathology and Genetics, Sahlgrenska Academy, Gothenburg University for the production of TMA blocks. The authors also like to thank Fredrik Levander, National Bioinformatics Structure Sweden (NBIS), for expert statistical assistance.
Disclosure statement
P.O.A. joined the speakers’ bureau of Roche, Gilead and Janssen; has been a consultant for Abbvie, Gilead and Roche and received a research grant from Gilead Nordic. H.N.E joined the speakers’ bureau of Roche and Janssen; has been a consultant for Roche. The other authors declare that there is no conflict of interests regarding the publication of this article. S. B. E., Mi. S., and P. O. A. conceived and designed the study; all authors collected and assembled data; S. B. E., Mi. S., A. S., H. F., and P. O. A. analyzed and interpreted data; S. B. E., Mi. S., and P. O. A. wrote the manuscript; and all authors gave final approval of the manuscript.
Data availability statement
The data that support the findings of this study are available from the corresponding author upon reasonable request.
Additional information
Funding
References
- Alizadeh AA, Eisen MB, Davis RE, et al. Distinct types of diffuse large B-cell lymphoma identified by gene expression profiling. Nature. 2000;403(6769):503–511.
- Swerdlow SH. Diffuse large B-cell lymphoma (DLBCL), NOS. In: Swerdlow SH, Campo E, Harris NL, Jaffe ES, Pileri SA, Stein H, Thiele J, editor. WHO classification of tumours of haematopoietic and lymphoid tissues. 4th ed. Lyon (France): International Agency for Research on Cancer; 2017. p. 291–297.
- Davis RE, Ngo VN, Lenz G, et al. Chronic active B-cell-receptor signalling in diffuse large B-cell lymphoma. Nature. 2010;463(7277):88–92.
- Davies A, Cummin TE, Barrans S, et al. Gene-expression profiling of bortezomib added to standard chemoimmunotherapy for diffuse large B-cell lymphoma (REMoDL-B): an open-label, randomised, phase 3 trial. Lancet Oncol. 2019;20(5):649–662.
- Younes A, Sehn LH, Johnson P, et al. Randomized phase III trial of ibrutinib and rituximab plus cyclophosphamide, doxorubicin, vincristine, and prednisone in non-germinal center B-cell diffuse large B-Cell lymphoma. J Clin Oncol. 2019;37(15):1285–1295.
- Vitolo U, Witzig TE, Gascoyne RD, et al. ROBUST: first report of phase III randomized study of lenalidomide/R-CHOP (R2-CHOP) vs. placebo/R-CHOP in previously untreated ABC-type diffuse large B-cell lymphoma. Hematol Oncol. 2019;37(S2):36–37.
- Doll S, Gnad F, Mann M. The case for proteomics and phospho-proteomics in personalized cancer medicine. Proteomics Clin Appl. 2019;13(2):e1800113.
- Deeb SJ, Tyanova S, Hummel M, et al. Machine learning-based classification of diffuse large B-cell lymphoma patients by their protein expression profiles. Mol Cell Proteomics. 2015;14(11):2947–2960.
- Gao HX, Nuerlan A, Abulajiang G, et al. Quantitative proteomics analysis of differentially expressed proteins in activated B-cell-like diffuse large B-cell lymphoma using quantitative proteomics. Pathol Res Pract. 2019;215(9):152528.
- Kwiecińska A, Porwit A, Souchelnytskyi N, et al. Proteomic profiling of diffuse large B-cell lymphomas. Pathobiology. 2018;85(4):211–219.
- van der Meeren LE, Kluiver J, Rutgers B, et al. A super-SILAC based proteomics analysis of diffuse large B-cell lymphoma-NOS patient samples to identify new proteins that discriminate GCB and non-GCB lymphomas. PLoS One. 2019;14(10):e0223260.
- Reinders J, Altenbuchinger M, Limm K, et al. Platform independent protein-based cell-of-origin subtyping of diffuse large B-cell lymphoma in formalin-fixed paraffin-embedded tissue. Sci Rep. 2020;10(1):7876.
- Hans CP, Weisenburger DD, Greiner TC, et al. Confirmation of the molecular classification of diffuse large B-cell lymphoma by immunohistochemistry using a tissue microarray. Blood. 2004;103(1):275–282.
- Bram Ednersson S, Stenson M, Stern M, et al. Expression of ribosomal and actin network proteins and immunochemotherapy resistance in diffuse large B cell lymphoma patients. Br J Haematol. 2018;181(6):770–781.
- Ednersson SB, Stern M, Fagman H, et al. TBLR1 and CREBBP as potential novel prognostic immunohistochemical biomarkers in diffuse large B-cell lymphoma. Leuk Lymphoma. 2020;16:1–10.
- Johnson NA, Slack GW, Savage KJ, et al. Concurrent expression of MYC and BCL2 in diffuse large B-cell lymphoma treated with rituximab plus cyclophosphamide, doxorubicin, vincristine, and prednisone. J Clin Oncol. 2012;30(28):3452–3459.
- Huang FK, Zhang G, Lawlor K, et al. Deep coverage of global protein expression and phosphorylation in breast tumor cell lines using TMT 10-plex isobaric labeling. J Proteome Res. 2017;16(3):1121–1132.
- Levin Y. The role of statistical power analysis in quantitative proteomics. Proteomics. 2011;11(12):2565–2567.
- Vinay DS, Ryan EP, Pawelec G, et al. Immune evasion in cancer: mechanistic basis and therapeutic strategies. Semin Cancer Biol. 2015;35:S185–S198.
- Cioroianu AI, Stinga PI, Sticlaru L, et al. Tumor microenvironment in diffuse large B-cell lymphoma: role and prognosis. Anal Cell Pathol. 2019;2019:8586354.
- Marchesi F, Cirillo M, Bianchi A, et al. High density of CD68+/CD163+ tumour-associated macrophages (M2-TAM) at diagnosis is significantly correlated to unfavorable prognostic factors and to poor clinical outcomes in patients with diffuse large B-cell lymphoma. Hematol Oncol. 2015;33(2):110–112.
- Nam SJ, Go H, Paik JH, et al. An increase of M2 macrophages predicts poor prognosis in patients with diffuse large B-cell lymphoma treated with rituximab, cyclophosphamide, doxorubicin, vincristine and prednisone. Leuk Lymphoma. 2014;55(11):2466–2476.
- Wada N, Zaki MA, Hori Y, et al. Tumour-associated macrophages in diffuse large B-cell lymphoma: a study of the Osaka Lymphoma Study Group. Histopathology. 2012;60(2):313–319.
- Scott EM, Jacobus EJ, Lyons B, et al. Bi- and tri-valent T cell engagers deplete tumour-associated macrophages in cancer patient samples. J Immunother Cancer. 2019;7(1):320.
- van der Touw W, Chen HM, Pan PY, et al. LILRB receptor-mediated regulation of myeloid cell maturation and function. Cancer Immunol Immunother. 2017;66(8):1079–1087.
- Gong Y, Fan Z, Luo G, et al. The role of necroptosis in cancer biology and therapy. Mol Cancer. 2019;18(1):100.
- Jiao D, Cai Z, Choksi S, et al. Necroptosis of tumor cells leads to tumor necrosis and promotes tumor metastasis. Cell Res. 2018;28(8):868–870.
- Park S, Hatanpaa KJ, Xie Y, et al. The receptor interacting protein 1 inhibits p53 induction through NF-kappaB activation and confers a worse prognosis in glioblastoma. Cancer Res. 2009;69(7):2809–2816.
- Seifert L, Werba G, Tiwari S, et al. The necrosome promotes pancreatic oncogenesis via CXCL1 and Mincle-induced immune suppression. Nature. 2016;532(7598):245–249.
- Starzer AM, Berghoff AS. New emerging targets in cancer immunotherapy: CD27 (TNFRSF7). ESMO Open. 2019;4(3):e000629.
- Burris HA, Infante JR, Ansell SM, et al. Safety and activity of varlilumab, a novel and first-in-class agonist anti-CD27 antibody, in patients with advanced solid tumors. J Clin Oncol. 2017;35(18):2028–2036.
- Seliger B, Kloor M, Ferrone S. HLA class II antigen-processing pathway in tumors: molecular defects and clinical relevance. Oncoimmunology. 2017;6(2):e1171447.
- Wang L, Yao ZQ, Moorman JP, et al. Gene expression profiling identifies IRF4-associated molecular signatures in hematological malignancies. PLoS One. 2014;9(9):e106788.
- Honkala AT, Tailor D, Malhotra SV. Guanylate-binding protein 1: an emerging target in inflammation and cancer. Front Immunol. 2019;10:3139.
- Chen L, Li M. TMIC-51. GBP1 RECRUITS MACROPHAGES TO PROMOTE GLIOBLASTOMA GROWTH. Neuro-Oncology. 2019;21(6):vi259–vi259.
- Fekete JT, Győrffy B. ROCplot.org: validating predictive biomarkers of chemotherapy/hormonal therapy/anti-HER2 therapy using transcriptomic data of 3,104 breast cancer patients. Int J Cancer. 2019;145(11):3140–3151.
- Wadi S, Tipton AR, Trendel JA, et al. hGBP-1 expression predicts shorter progression-free survival in ovarian cancers, while contributing to paclitaxel resistance. J Cancer Ther. 2016;7(13):994–1007.
- Duan Z, Foster R, Brakora KA, et al. GBP1 overexpression is associated with a paclitaxel resistance phenotype. Cancer Chemother Pharmacol. 2006;57(1):25–33.
- Pidugu VK, Pidugu HB, Wu MM, et al. Emerging functions of human IFIT proteins in cancer. Front Mol Biosci. 2019;6:148.
- Advani R, Flinn I, Popplewell L, et al. CD47 blockade by Hu5F9-G4 and rituximab in non-Hodgkin’s lymphoma. N Engl J Med. 2018;379(18):1711–1721.
- Bouwstra R, He Y, de Boer J, et al. CD47 expression defines efficacy of rituximab with CHOP in non-germinal center B-cell (non-GCB) diffuse large B-cell lymphoma patients (DLBCL), but not in GCB DLBCL. Cancer Immunol Res. 2019;7(10):1663–1671.
- Chapuy B, Stewart C, Dunford AJ, et al. Molecular subtypes of diffuse large B cell lymphoma are associated with distinct pathogenic mechanisms and outcomes. Nat Med. 2018;24(5):679–690.
- Lacy SE, Barrans SL, Beer PA, et al. Targeted sequencing in DLBCL, molecular subtypes, and outcomes: a haematological malignancy research network report. Blood. 2020;135(20):1759–1771.
- Schmitz R, Wright GW, Huang DW, et al. Genetics and pathogenesis of diffuse large B-cell lymphoma. N Engl J Med. 2018;378(15):1396–1407.
- Wright GW, Huang DW, Phelan JD, et al. A probabilistic classification tool for genetic subtypes of diffuse large B cell lymphoma with therapeutic implications. Cancer Cell. 2020;37(4):551–568.e14.
- Morin RD, Scott DW. DLBCL subclassification: divide and conquer? Blood. 2020;135(20):1722–1724.