
 ?Mathematical formulae have been encoded as MathML and are displayed in this HTML version using MathJax in order to improve their display. Uncheck the box to turn MathJax off. This feature requires Javascript. Click on a formula to zoom.
ABSTRACT
The Open Innovation (OI) concept has pervaded the academic and policy debate due to its potential to further stimulate the circulation of knowledge between business partners and institutions and, consequently, to increase their innovation potential. This paper studies the relationships between OI and innovation and economic returns at the ‘aggregate’ level, i.e. at the country and industry levels. It exploits three waves of the Community Innovation Survey to conduct an empirical analysis on sectoral data for 16 EU countries. Results confirm the role of OI in stimulating – even at the aggregate level – innovation, with returns increasing at diminishing rates. OI also has an indirect impact on value added by strengthening the positive effect exerted on aggregate economic performance by R&D expenditure. The mutual reinforcement of R&D intensity and collaborations between companies and business partners is coherent with the principles underlying ‘smart specialization' policies of the European Union.
1 Introduction
In following the ‘Open Innovation' (OI) literature (Chesbrough Citation2003, Citation2006; Huggins et al. Citation2010) firms are becoming increasingly open in order to achieve and sustain their innovations: returns of internal R&D are decreasing while the capability of exploiting knowledge originating from external sources means firms capture more opportunities that ‘unlock their potential'. The organisational boundaries of firms are becoming ‘porous’ and the interaction of firms with the external environment is increasing so that the exploitation of a wide set of external actors and external sources is now a strategic and deliberate choice firms make.
Furthermore, open innovation policies often involve increased pressure on higher education institutes and public research organisations to obtain research funding from the private sector, accompanied by a reduction of institutional funding (Dankbaar and Vissers Citation2010). However, as the Reflections of the EU Research, Innovation and Science Policy Experts (RISE) High Level Group points out, a longer-term, strategic vision is required to govern innovation activities in order to address the productivity growth slowdown observed in the EU in recent years and for which the creation of a more open and dynamic innovation environment is crucial (EC Citation2017). This presents a double challenge that involves both the need to open up to external (including foreign) knowledge sources, and to strengthen absorptive capacity by investing in research and innovation. OI also involves policy focusing on teams of innovators rather than merely on innovative products, but it remains a challenge to identify the relevant teams and business partnerships. The same report also highlights the need for further investigations to understand whether and how the lack of openness hampers growth of productivity.
Creating a coherent regulatory environment conducive for open innovation involves challenges. Insights from sector-level studies of innovation and growth suggest that innovation policies should consider differences across industries in terms of maturity of technology, industrial organisation, length of product development cycles, etc. However, innovators often see the lack of interoperability of the regulatory environments across sectors as barriers to co-operation and the development of open innovation based on multi-technology sourcing (EC Citation2016).
The literature on the effects of (inbound) OI on innovative outcome is broad and rapidly expanding and it generally agrees on the positive net effect of OI on innovation outcomes. It has still to be ascertained whether OI affects innovation at a more aggregated level, i.e. the sectoral level of analysis, and with a broad EU coverage. This is the first contribution made by this paper.
In addition, the overall effect of (inbound) OI on economic outcomes is still under investigated: unveiling such a relationship is the second contribution of this paper.
An empirical analysis encompassing manufacturing and service activities was conducted on a dataset whose main source is the Community Innovation Survey aggregated at the sectoral level for 3 waves (2006–2008; 2008–2010; 2010–2012) in 16 EU countries with Eurostat being used as an ancillary source of information.
Section 2 discusses the background literature used in this paper and it outlines the main research questions. Section 3 describes the dataset construction and it assesses the empirical approach. The results are discussed in Section 4. The final section presents the conclusions and main implications for future research.
2 Background literature and research hypothesis
The idea that firms may benefit from knowledge flows developed elsewhere is not a new one in economics literature. The potential exploitation of positive knowledge externalities that would improve the innovativeness of firms has been a core argument in explaining the emergence of clusters and industrial districts since the seminal contribution made by Marshall (Marshall Citation1890). Innovation is an interactive process, which is not only characterised by uncertainty, including trial and error, but also involves multiple actors in the innovation systems, including suppliers, users, and institutions, whose interaction shapes the ultimate success (or failure) of the innovation itself (e.g. Lundvall Citation1992).
Drawing on this evidence, Cohen and Levinthal (Citation1990) argue that the ability to recognise the value of external knowledge, assimilate this knowledge, and apply it for commercial purposes is a key component in the innovative capability of a firm. This ability, defined as ‘absorptive capacity’, is a function of the level of prior internal investments in related knowledge, which enables the firm to recognise the value of the external information and to extract it. In other words, relying on external flows of knowledge may be beneficial to firm’s innovative outputs only if there exists enough ‘absorptive capacity' to gain from such flows. As ‘absorptive capacity’ is intangible, it is not easy to define what the appropriate level of investment is and when this has been reached.
More recently, it has been theorised that knowledge externalities might even be a voluntary, strategic, and deliberate choice pursued by firms. Furthermore, it has been argued that firms are moving to a so-called ‘open innovation' (OI) model in order to achieve and sustain their innovations because the returns on internal R&D are decreasing while having the capacity to exploit knowledge from external sources allows more opportunities that would ‘unlock their potential' to be captured (Chesbrough Citation2003). Chesbrough (Citation2003, XXIV) defines OI as a paradigm ‘that assumes that firms can and should use external ideas as well as internal ideas, and internal and external paths to market, as firms look to advance their technology'.
The organisational boundaries of a firm are ‘porous' in this model and the interaction of firms with the external environment increases. In brief, this OI model consists of exploiting a wide set of external actors and external sources. These can take multiple forms:
knowledge sourcing may involve learning to use new technology and equipment, especially that used by customers or suppliers, (…) drawing on new scientific research from universities to facilitate innovation, (…) using expert marketing advice or technical or business development expertise that is not available in-house. (Huggins et al. Citation2010, 2)
All in all, multiple factors are driving the shift towards an OI paradigm (Chesbrough Citation2003): availability and mobility of skilled workforce; a venture capital market providing the economic conditions; the emergence of new external options for their inventions; and increased knowledge and improved capabilities of external suppliers.
Chesbrough (Citation2006) extended the concept of OI to include ‘the use of purposive inflows and outflows of knowledge to accelerate internal innovation, and expand the markets for external use of innovation, respectively' (Chesbrough Citation2003, 1).
The next sections firstly presents a review of the main evidence for the OI – innovation nexus (Section 2.1), followed by a discussion on how OI is related to economic performance (Section 2.2) and, lastly, by a discussion on a conceptual approach to interpret OI at the aggregate level of countries and sectors by means of the system of innovation literature (Section 2.3).
2.1 Open innovation – innovation linkages
The literature on the effects of open innovation on innovative outcome is broad and rapidly expanding. It encompasses empirical analyses (e.g. Laursen and Salter Citation2006; Sofka and Grimpe Citation2010) and theoretical contributions (e.g. Dahlander and Gann Citation2010; Reed, Storrud-Barnes, and Jessup Citation2012; Bogers et al. Citation2016) as well as case studies (e.g. Ozkan Citation2015; Sovacool et al. Citation2017). Broader analysis encompassing the broad set of manufacturing firms (e.g. Laursen and Salter Citation2006) and service firms (Love, Roper, and Bryson Citation2011) are combined with in-depth analysis on specific sectors such as (to mention but a few) high-tech firms (e.g. Wang, Chang, and Shen Citation2015), software firms (e.g. Colombo, Piva, and Rossi-Lamastra Citation2014), biopharmaceuticals (Hu, McNamara, and McLoughlin Citation2015), power and energy sector (Greco, Locatelli, and Lisi Citation2017) including a sub-focus on solar energy technologies (de Paulo and Porto Citation2017), and the oil industry (Radnejad, Vredenburg, and Woiceshyn Citation2017). Such a wide-ranging research effort does also include transition economies (Pilav-Velić and Marjanovic Citation2016) or middle-income countries (Goedhuys and Veugelers Citation2012; Wang, Chang, and Shen Citation2015).
This section summarises the key findings on the effects of an open mode on innovative performance in this literature.
One of the most cited contribution that empirically assessed the open innovation mode is Laursen and Salter (Citation2006). The article empirically assesses how different strategies for using external knowledge sources (namely suppliers, users, and universities) affect the innovative performance on a cross-sectional sample of U.K. firms drawn from the U.K. innovation survey. They differentiate between two main strategies: external search breadth and external search depth and they assess their effects on the innovation made by firms.
The first strategy is conceived in terms of the number of different search channels a firm draws upon in its innovative activities. Ex-ante, managers do not know which of the possible sources would be effective and rewarding given that this process of exploiting external knowledge channels faces uncertainty and its routinisation undergoes a process of trial and error. Consequently, external search breadth can improve innovative performance but there is also a concrete risk of unbalanced use of this strategy that would ultimately lead to a negative innovative outcome.
Firms may also ‘over-search' for external sources, and this choice may be detrimental. Firms can fail in handling too wide a set of new ideas and knowledge (‘the absorptive capacity problem’), the time the new ideas come can be inappropriate (‘the timing problem’) and firms may pay little too attention to so many ideas (‘the attention allocation problem’). Overall, the empirical paper supports a direct and positive effect of external search breadth on the innovative outcome of a firm, but it also depicts a curvilinear effect pointing to the final result that external search is not costless, as it involves the risk of ‘over-search’ which might also lead to negative returns.
The second strategy regards external search depth and involves drawing intensively on the sources of external information. What is needed for such a search strategy to be intensive is a deep and sustained pattern of interaction with external knowledge partners, such as lead users, suppliers, or universities, that would allow them to build a ‘shared understanding and common ways of working together' to achieve virtuous exchanges (Laursen and Salter Citation2006, 136). Relying too deeply on these knowledge flows may however be detrimental, as the maintenance of such links requires attention and resources. Indeed, the paper finds a curvilinear function between external search depth and innovative performance. Using a sample of U.K. manufacturing firms, Tomlinson and Fai (Citation2016) further analyse the differential impact of search depth on both product and process innovations when considering, separately, collaborations with buyers and suppliers. They find that embedded relationships with both suppliers and users positively correlate with either product and/or process innovations. However, they only find evidence of a curvilinear relationship between the depth in cooperation with suppliers and product innovation.
Sofka and Grimpe (Citation2010) find empirical support for the positive effect of open search strategy on innovation, and that this positive gain is mainly moderated by two factors: the absorptive capacity of firms, namely their own investment in R&D, and the potential of the external environment to provide knowledge spillovers to exploit.
Along the same line of research, Radicic and Balavac (Citation2019) provide new evidence on the complementarity effect of internal and external R&D activities, conditional on the breadth of R&D cooperation, and on the innovation output of Spanish manufacturing firms observed during the period from 2001 to 2011. In particular, when measuring the innovation output with the number of patents, the joint effect of external and internal R&D is conditional on the number of cooperative ties while they do not find this conditionality for product and process innovations. In a survey of the innovation practices of knowledge-intensive business service providers (KIBS) in Canada, Doloreux, Shearmur, and Rodriguez (Citation2016) find a much stronger association between high R&D intensity and internal technological and management capacity than with openness. At the same time, external R&D is strongly associated with connections and external capacity for collaboration, and it appears to complement internal capacity.
Roper, Vahter, and Love (Citation2013) focus on the social benefits of the OI mode and on what they call ‘externalities of openness'. They suggest that openness itself is capable of generating positive externalities that go beyond the organisations involved in the partnership. Their empirical analysis is based on the Irish innovation survey in the period 1994–2008 and is based on the plant (rather than firm) level of analysis. They argue that an overall increase in the average degree of openness in a sector may result in positive externalities raising the innovation productivity of the sector itself. They do find support for the positive effect of the ‘externality of openness’ on the innovation outcome of firms.
Following an OI mode is not at all without cost to the firm. First, it requires adequate absorptive capacity to capture and internalise the knowledge produced by external actors. Second, a business strategy that is too oriented toward gaining from external information sources may indeed be detrimental to the firm because firms also need to focus on extracting the returns of the (open) innovations. The so-called ‘paradox of openness’ postulates that while the creation and invention phase benefits from openness, the commercialisation (through which an invention becomes an innovation) would require protection rather than openness because, at the moment a cooperation is set up, certain knowledge would inevitably flow to the partners (Laursen and Salter Citation2014). In other words, the appropriability strategy a firm selects to protect itself from imitation when it goes open, i.e. when it engages in collaborations with the external environment, does matter in explaining the rents it can capture from its innovation. The appropriability strategy is measured according to the formal or informal protection methods a firm exploits, namely: patents, registration of design, trademarks, secrecy, lead time, and complexity. The empirical paper on a sample of U.K. manufacturing firms finds evidence for the exploitation of legal appropriability methods affecting the choice of selecting an OI mode by giving managers the confidence to engage with external actors safely (Laursen and Salter Citation2014).
A survey by Hagedoorn and Ridder (Citation2012) supports the absence of contradiction between patenting and open innovations as firms can do both and one option does not exclude the other. In their sample, 90% of ‘open' firms declared patents to be a relevant tool for signalling their capabilities to the market, pointing to the conclusion that ‘firms active in open innovation appear to prefer systematic protection of their innovative capabilities from their open innovation partners' (Hagedoorn and Ridder Citation2012, 27).
This paradox has been revised in a recent contribution by Arora, Athreye, and Huang (Citation2016). The authors try to explain the apparently contradictory trend which on the one hand sees an increase in patenting as an appropriability tool and, on the other hand, an increase in openness in innovations. Arora, Athreye, and Huang (Citation2016) build an empirical analysis of U.K. manufacturing firms to test for the ‘paradox of openness' and more precisely for the openness trade-off: firms will seek external collaborations if their knowledge can be protected (‘spillover prevention view' (Cassiman and Veugelers Citation2002)) but firms that are too focused on patenting will be less effective in collaborations, weakening their attractive power as partners (‘organizational openness view'). The paper finds that the decision whether to patent and/or opt for external sourcing is contingent, is jointly determined, and depends on whether firms are leaders or followers in the market, the first being more vulnerable to knowledge spillovers than the latter. More precisely, ‘open' leaders patent more than ‘closed' leaders and more than ‘open' followers, whereas ‘closed' leaders and followers patent at similar degrees. The explanation for this result is that leading firms
are more vulnerable to unintended knowledge spillovers during collaboration compared to followers, and consequently (…) the increase in patenting due to openness is higher for leaders than for followers. Followers, with incremental innovations that do not benefit as much from patenting and with little proprietary technology and knowhow, may be less willing to patent because it makes them a less attractive open partner and are also perhaps not as able to derive value from collaboration. (Arora, Athreye, and Huang Citation2016, 1360)
In addition, Zobel, Lokshin, and Hagedoorn (Citation2017) analysed how the degree of openness in innovation affects the choice on appropriation instruments between formal ones (patents, trademarks, copyrights, and design rights) and informal ones (secrecy, lead-time, and complexity) on a sample of Dutch firms. Whereas both external search breadth and depth are positively associated with the use of the second typology, i.e. informal appropriation mechanisms, only external search breadth is associated with the former, i.e. formal appropriation mechanisms.
In involving multiple internal and external technology sources and technology commercialisation channels, firms may become open to two possible directions: inbound OI or outbound OI.
Inbound open innovation refers to a process of technology transfer from external sources inward, while outbound OI is related to outward technology transfer, whereby firms pursue a strategy of gaining monetary/strategic opportunities by commercialising a technology, e.g. by out-licensing (Gambardella, Giuri, and Luzzi Citation2007). A firm in an outbound setting must be able to capture value from their technology. Consequently, a strong patent protection system might affect the possibility of a firm profiting from outbound OI.
Dahlander and Gann (Citation2010) systematise the literature on the definition of OI through a bibliographic analysis, finding conceptualisations on two inbound processes, sourcing and acquiring external knowledge, and two outbound processes, revealing and selling. The two forms of OI, therefore, depend on the pecuniary versus non-pecuniary compensation of the knowledge flow. ‘Sourcing' is a type of inbound OI and is related to the ways in which firms can exploit external information sources and their search for those sources. ‘Acquiring' is related to the acquisition of sources and inputs to the innovation process in the market. ‘Revealing' refers to an outbound openness where firms reveal internal resources without direct pecuniary compensation whereas ‘Selling' refers to commercialisation of the inventions or technologies of firms by sales or licences.
The literature has mostly focused on either inbound or outbound flows. Little evidence is provided on the interplay between these choices and their possible complementarity. An exception to this is Cassiman and Valentini (Citation2016), who empirically tested Belgian manufacturing firms for the presence of a complementarity in the two strategies, namely that firms that combine the two strategies significantly outperform those that choose only one. This outperformance would be explained by a reduction in cognitive costs, transaction costs, and organisational costs that would be achieved when inbound and outbound strategies are combined.
2.2 Open-innovation – economic outcome
Contrarily to the evidence on the links between OI and innovation outlined in the previous section, there is a lack of systematic evidence about the effect of external sourcing of knowledge on economic outcomes.
This section reviews the sporadic available evidence.
Goedhuys and Veugelers (Citation2012) empirically analyse the effects of the interplay between external technology sourcing (‘technology buy') and internal technology development (‘technology make') on both innovation and growth of firms on a sample of Brazilian manufacturing firms in the period 2000–2002. In particular, starting from the strategies of firms developing technology versus technology acquisition (which includes acquiring new technology embodied in new machinery, key personnel as well as licensing-in technology), they taxonomise four groups of firms depending on their innovation strategies. The first group is composed of firms that only report in-house development of technology, the second is composed of firms that only buy, the third consists of firms who report both their own development activities and embodied technology acquisition, and the last group includes firms with no make or buy strategy. Not only do they support both ‘technology buy' and ‘technology make' increasing innovation but also confirm the innovation effects of OI mode. Furthermore, it was found that only those firms that combine successful product innovations with process innovations realise higher sales growth.
Considering a large sample of Italian manufacturing firms and a different measure of economic performance, namely growth in total factor productivity, Medda, Piga, and Siegel (Citation2006) find evidence of a positive return to collaborative research with other companies on productivity, which is significantly higher than the effect associated with internal R&D only, whereas collaborative research with universities does not appear to enhance the productivity of firms.
An assessment of the effects of both inbound and outbound OI on the economic performance of firms is also provided for a sample of 176 Taiwanese high-tech firms by Hung and Chou (Citation2013). The main finding is that inbound versus outbound OI have differential effects on the performance of firms, measured in terms of financial performance using Tobin’s q index (ratio of firm market value to the replacement cost of its assets). In particular, external technology acquisition positively affects firm performance while external technology exploitation does not have a significant effect on the performance of firms.
Differential effects of inbound openness on the performance of firms have been also tested for two main typologies of openness, namely, horizontal versus vertical technological collaborations (Wang, Chang, and Shen Citation2015). The first corresponds to a cooperative and co-developmental way of sourcing for technology with multiple partners in which firms look for complementary resources to develop new knowledge and technologies jointly with selected external partners. This first type applies to collaborations with competitors, suppliers and similar external partners. The set of collaborations established with customers belongs to the vertical typology and not only allows new ideas to be extracted and future demand needs anticipated but also facilitates the suggestion of alternative ways to solve problems in the products/services the firm produces in a co-creative open production mode. Wang, Chang, and Shen (Citation2015) showed that the vertical technological collaborations pay more than horizontal ones, using a sample of Taiwanese firms operating in the high-tech sector.
The contribution by Segarra and Teruel (Citation2014) estimates the determinants of firms’ growth in a sample of Spanish high-growth enterprises, and interesting evidence was found for the growth effect of openness. In assessing the impact of R&D investment on growth in sales and employees, the authors found that internal R&D has a significant positive impact on the upper quartiles in the growth distribution while external R&D impacts up to the median point of the distribution. In other words, investment in internal R&D is an important driver for the fast-growing firms while it has no effect on those that grow at a slower rate. On the other hand, external R&D is effective for firms with a median growth rate while it is ineffective for the group of fast-growing firms. Furthermore, in assessing the probability for a firm to be ‘high-growth', only internal R&D has been found to have an effect, and only so for manufacturing firms.
In assessing OI determinants and economic effects on Spanish SMEs operating in the manufacturing sectors by using structural equation models, Popa, Soto-Acosta, and Martinez-Conesa (Citation2017) find that both inbound and outbound OI positively affect the economic performance of firms, the latter being measured as a self-reported value on a scale going from worse to better than the competitors of firms.
The role of OI and in particular of the interactive search for knowledge by firms affecting sales from new products is also confirmed by a study of U.K. firms (Roper, Love, and Bonner Citation2017) in all sectors, and also when differentiating between the manufacturing and the service sector. This study also confirms the curvilinear effect of interactive searches of knowledge on sales, suggesting that this relationship suffers from diminishing returns: as the number of collaborative partners increases, after a certain point the sales decrease.
Generally speaking, empirical literature on the effect of OI on the economic performance of firms is rather scant. The same scarcity is encountered at the theoretical level.
First and foremost, there is an inherent problem in correctly measuring the value of inputs and outputs in an open mode of innovation. OI involves the use of knowledge as an intermediate input, which, due to its properties including limited appropriability and non-rivalry in use, is underpriced as it is not only under-supplied but also under-purchased by economic agents (Antonelli Citation2017).
Reed, Storrud-Barnes, and Jessup (Citation2012) explored the theoretical changes in the drivers of competitive advantage and the consequent economic rents when firms adopt an OI mode. Some sources of economic rents for incumbents in an industry are expected to be reduced, for example, rents extracted from property rights, due to economies of scale and capital requirements. Instead of this, the rents a firm extracts from experience-curve effects, differentiation, distribution, and switching costs as well as those from ‘difficult-to-imitate resources of networks and reputation' remain. The ultimate conclusion is that the competitive advantage of some firms will not be eroded by an OI mode. Firms who gain a competitive advantage from barriers to entry, skills in innovation, the capability to anticipate customer needs, or from proprietary product design can be expected to loose from OI in the long term.
Consequently, since the effect of OI on economic performance is expected to be rather unevenly distributed between the firms in the same industry (with the presence of both ‘winners' and ‘losers' in the same changing OI environment), one of the contributions of the present paper is to assess the net ‘aggregate' effect of different OI modes in different industries and countries, also given the lack of empirical studies that have analysed this nexus at meso or macro level.
2.3 Open innovation in sectoral innovation systems
Sectoral innovation systems provide a useful framework for conceptualising open innovation at the industry rather than firm level. Since the knowledge base and learning processes, the actors, networks, and the institutions – components of sectoral innovation systems – are industry-specific, there are considerable differences across industries in how firms organise their innovative activities (Malerba Citation2005). The nature and stage of technological regimes (the maturity in the life-cycle of a technology) also differ from one sector to another (Abernathy and Utterback Citation1978; Malerba and Orsenigo Citation1997). The idea of open innovation, or knowledge sourcing from outside the firms’ boundaries fits the concept well considering that the knowledge base is typically distributed across actors in a sectoral innovation system (companies, universities, research institutes), which creates incentives for innovating firms to collaborate (Christensen, Olesen, and Kjær Citation2005; Aslesen and Freel Citation2012).
Institutions that shape innovation-related interactions between system actors are expected to be further conditioned by cross-border differences, as suggested by national innovation systems literature (see Nelson Citation1993; Freeman Citation1995; Lundvall Citation2007). A few recent studies have addressed this argument from a theoretical and empirical perspective. Belussi, Sammarra, and Sedita (Citation2010) argue that the concept of openness is also relevant from the perspective of regional innovation systems – as shown by the life science industry in the Italian region of Emilia Romagna. Tödtling, van Reine, and Dörhöfer (Citation2011) use case studies from across Europe to show that in addition to regional characteristics, industry-specific characteristics also shape how open innovation occurs.
The emerging literature that links sectoral innovation systems and open innovation focuses on the organisation of the innovation process. Christensen, Olesen, and Kjær (Citation2005), using the case of a transformation in sound amplification technology, demonstrate how the maturity of a technology regime and position of the actors in the innovation system influence the process in which OI happens, and how it may change over time. The success of innovation strategies are not only conditioned by the position of a firm in the innovation system and stage of a technology’s maturity, but also on the level and mode of the openness of companies in finding collaborative partners – as well as their ability (or luck) to exploit opportunities (Christensen, Olesen, and Kjær Citation2005).
The industrial knowledge base conditions the recombination of knowledge for innovation. Based on data from 1,302 companies surveyed across Norwegian city-regions, Aslesen and Freel (Citation2012) show that cooperation and knowledge sourcing, both from an institutional and geographic aspect, varies between 3 ideal types of knowledge bases – analytical, synthetic, and symbolic – defined after Asheim and Gertler (Citation2005). For instance, (longer distance) R&D collaboration and formal relations are more important for industries with an analytical knowledge base (i.e. biotech and pharmaceutical industries) while actors along the value chain, formal as well as informal multi-level learning networks, are the key for industries characterised by synthetic knowledge bases (i.e. engineering, machinery, ICT services). Tomlinson and Fai (Citation2013) show that various forms of collaboration with suppliers increases the likelihood of product and process innovation in small- and medium-sized companies in the U.K. in traditional and high-tech sectors. Furthermore, cooperation with buyers increases the likelihood of successful product innovation (but not process innovation). The authors found that the strength of innovation varies according to industry.
This evidence suggests that the openness of sectoral innovation systems shapes the way in which innovation happens as well as the successful outcome of the process. Yet, more comprehensive cross-sectoral and cross-border studies are needed to improve understanding of the dynamics at these aggregate levels. As the previous sub-sections have shown, most of the evidence available on the impact of openness on innovation and, in turn, economic performance, relies on firm-level investigation.
2.4 Research hypothesis
Bogers et al. (Citation2016) stress that research on OI has predominantly had the firm as its unit of analysis but other units of analysis should be considered. The focus of the multi-country study presented in this paper is coherently the country-sector.
The choice of focusing on the sectoral level is supported by three main arguments: (i) the growing recognition that other units of analysis than the firm ‘need to be considered [in order to] get a more detailed understanding of the antecedents, processes, and outcomes of OI' (West et al. Citation2014); (ii) the need to correct for the bias associated with the subjective nature of self-reported perceptions and responses typical of innovation survey data (Bogliacino and Pianta Citation2016); and also (iii) to obtain a more integrated perspective on industrial dynamics, as suggested in the literature on sectoral innovation systems.
Furthermore, a set of industry-level contingencies are relevant to explaining the effectiveness of OI across different sectoral settings. For instance, more R&D intensive sectors in which innovation is more uncertain than in others might induce firms to share both knowledge and risks (Dyer, Furr, and Lefrandt Citation2014).
Lastly, and more technically speaking, the use of aggregated industry analysis in innovation studies overcomes some sources of bias which are standard when exploiting survey data (Bogliacino and Pianta Citation2016). It corrects the bias associated with the subjective nature of questions and answers if the direction of the error is non-systematic for firms aggregated in the same sector, and it also captures some sectoral features that the firm level would omit.
With regard to sector coverage, it is well known that open innovation mainly started in the high-tech sector, but there this is also now influencing the low-tech sector. According to Gassmann, Enkel, and Chesbrough (Citation2010, 215), ‘Open innovation’s management innovation has spread to different sectors, such as machinery, turbines, medical tools, fast moving consumer goods, food, architecture and logistics'.
Furthermore, Love, Roper, and Bryson (Citation2011) coherently extend the evidence on OI to the service sector, analysing a sample of U.K. knowledge-based service firms and finding evidence for the positive effects of openness in searching for information or creating knowledge.
The analysis of OI in services is further explored by Battisti et al. (Citation2015) who consider 17 different service sectors in 18 EU countries. They find no evidence of significant use of external knowledge sources in radical service product innovation whereas innovation followers rely more extensively on external sourcing of knowledge and ideas although with decreasing returns to innovation performance.
Consequently, the empirical analysis needs to be conducted on both the manufacturing and service sectors in Europe.
When both the breadth and the depth dimensions of the OI modes are considered as in the literature discussed in Section 2.1, it can be hypothesised that:
H1: OI positively affects innovation adoption at the sectoral level up to a certain degree of openness (across both depth and breadth dimensions), above which curvilinear effects are expected.
It is less straightforward from studying the literature discussed in Sections 2.2 and 2.3 to derive any clear research hypothesis concerning the nexus between OI modes and economic performance at the sectoral level. In fact, besides the ex-ante theoretical ambiguity on the sign of this relationship and the inconclusive corresponding ex-post evidence found at the firm level, making predictions at a more aggregated level is even more difficult because of the complex relationships and trade-off dynamics that may emerge among the different actors in the same industry. Consequently, the overall effect of OI on the economic outcomes in a given industry may be very different from the simple sum of the OI effects found for each member of that industry. As a result, no ex ante expectation can be formulated on the industry economic returns of an OI mode, which constitutes the second research line of this paper.
Due to data availability, the hypothesis and research lines and, consequently, the empirical analysis presented in this paper only focuses on inbound OI because sufficient information on the outbound forms of OI is lacking.
3 Empirical strategy
To test the research hypotheses presented in this paper along the main research lines, a dataset was built that combined three waves of the harmonised Community Innovation Survey (CIS) micro data with statistics provided by Eurostat. The basic unit of the analysis is the combination of country, industry, and CIS wave. The selection of countries and industries depends on the availability in the CIS micro data in the three waves 2006–2008, 2008–2010, and 2010–2012. The dataset covers 16 European Union (EU) countries: Bulgaria, Croatia, Cyprus, Czech Republic, Estonia, Germany, Hungary, Italy, Latvia, Lithuania, Norway, Portugal, Romania, Slovakia, Slovenia, Spain (code list in the Appendix). In doing so, we have a broader geographical coverage than previous studies, even if Southern and Eastern EU Member States are better represented. Sectors covered are maximum 21 per country, classified according to NACE Revision 2 classification to include both manufacturing and services, and are reported in the Appendix. The resulting sample size is composed of 298 country-industry-year units of observation.
CIS was used to construct the shares of innovative and exporting firms and of firms being part of a group within each country-sector-wave unit, as well as indicators of the use of the OI mode. Eurostat data was used to provide information on value added, RD expenditure, and average number of employees at the country-sector-wave level of analysis. reports the main statistics for the variables, whose detailed construction is described later in this section after the formal introduction of the regression models.
Table 1. Variables: descriptive statistics.
Combining data from different sources linked using country, industry, and survey-years as matching variables is not new in the innovation literature. For example, in their study on the relationships between the economic cycle, innovation, and employment, Lucchese and Pianta (Citation2012) combine data on innovation from the second (1994–1996), third (1998–2000), and fourth (2002–2004) wave of the CIS with data on macroeconomic variables and employment from the 2010 OECD Structural Analysis (STAN) database for 21 manufacturing sectors in 6 European countries. Another example is the Micro Moments Database (see Bartelsman, Hagsten, and Polder Citation2018 for a detailed description), which combines innovation variables from the CIS with ICT variables from the Survey on ICT Usage and e-Commerce in Enterprises and business performance and productivity variables from the Business Register and the Structural Business Survey at industry-level across a large sample of European countries.
In principle the nature of the dataset would allow for the use of panel data techniques, with almost 70% of the 148 unique country-industry combinations being observed for two or three waves. Yet, the short length of the panel (the average per firm observed time length equals to two) and the low variability of the dependent variables (innovation and value added) across time (most of the variance being due to differences across units) coupled with the rejection of the random effects specification (through Hausman tests) led to the use of a pooled regression approach with standard errors adjusted (i.e. clustered) to account for the repetition across time of country-industry combinations.
The empirical approach is composed of two separate steps of analysis.
Firstly, a knowledge production function is estimated, aimed at unveiling the drivers, especially the OI proxies, of innovation adoption. The specification follows the empirical strategy typically adopted by previous studies at the micro firm level, and adapts it to the meso country-industry-year level. This allows the first research hypothesis to be answered. The following pooled OLS model is estimated:(1)
(1) with i = 1, … , 298 denoting country-industry-wave combinations, β parameters to be estimated and ε independently and identically distributed (iid) error terms with mean zero and constant variance.
The main dependent variable Y of the first step reflects the share of innovators (INNO) (product and/or process) in the sector, and is constructed from an aggregation of the micro data of the CIS at the country and sectoral level. As a robustness test, all variables constructed from the CIS micro data were built both with and without using CIS sampling weights. Results for this choice are robust.Footnote1 To disentangle the heterogeneity across different typologies of innovation, the analysis was extended by additionally focusing on two alternative dependent variables: the share of product innovators in the sectors (INPD) and the share of process innovators in the sectors (INPS).Footnote2
As for the explanatory variables, the main variable of interest, Open Innovation (OI), is constructed at the firm level using microdata following the breadth and depth concepts of OI (as in Laursen and Salter Citation2006) and subsequently aggregated at the sectoral level. BREADTH therefore captures, at the firm level, the number of external information sources on which the firm relies on to innovate out of a list of 9 potential knowledge providers (i.e. suppliers; customers; competitors; consultants, and private R&D institutes; universities; government or public research institutes; conferences, trade fairs, exhibitions; scientific journals and trade/technical publications; professional and industry associations). DEPTH captures the number of these external information sources to which firms attribute a ‘high’ degree of importance, which is the strongest among available options (i.e. not used, low, medium, or high importance) to qualify the importance of external information sources. BREADTH and DEPTH, constructed at the micro level, are later aggregated at the sectoral level by mean of their average value across sectors and countries.
The baseline model is then extended to include quadratic terms for both BREADTH and DEPTH in order to test for the presence (if any) of curvilinear effects.
Standard controls are included in order to limit the risk of bias due to the omission of relevant regressors. EXPORT controls for the share of exporting firms in the country-sector-wave unit of analysis were examined. This was constructed from the self-reported information collected from the CIS at the micro level. Similarly, GROUP represents the share of firms that belong to a group. R&D expenditures of the country-sector-year unit of analysis were retrieved from the Eurostat statistics for ‘Business R&D expenditure', expressed in billions purchasing power standards (PPS) at 2005 prices and introduced into the model after a logarithmic transformation (logRD). Lastly, country (COUNTRY) and CIS-wave (WAVE) dummies are included.
This first step aims at shedding light on the determinants of sectoral innovation by taking various forms of open innovation into account. Then the second part of the analysis, aimed at unveiling the economic effects of OI mode, can be carried out. The second step assesses the economic returns associated with OI, once innovation has been controlled for. This constitutes the second research line of this paper, where no ex ante expectation on the role of OI was formulated. Country-sectoral value added is the dependent variable, and it is estimated as a function of OI, labour, capital, and R&D in an augmented Cobb Douglas production function framework. The following baseline econometric log-linear augmented Cobb–Douglas model (Cobb and Douglas Citation1928) was estimated using a pooled OLS:(2)
(2) with i = 1, … , 298 denoting country-industry-year combinations, γ parameters to be estimated, and η iid error terms with mean zero and constant variance.
The economic output is the dependent variable and is measured with country-sector value added (source: Eurostat National Accounts). Regarding inputs, capital input K is approximated by net investments in tangible capital (logK) (Eurostat: Structural Business Statistics),Footnote3 labour by the number of employees in the country-sector (logL) (Eurostat National Accounts). The basic Cobb–Douglas model is augmented with R&D expenditure (logRD), which is a proxy of innovation input and absorptive capacity. Country (COUNTRY) and CIS-wave (WAVE) dummies again complete the specification.
Additionally, we test whether the effects of R&D and OI on economic performance reinforce, offset, or do not interact. The model is therefore augmented by an interaction term between OI and R&D (in log) using logRD*BREADTH and logRD*DEPTH respectively, kept separate to limit double counting and collinearity. This would allow whether the sector absorptive capacity affects its economic output to be assessed. As a further robustness check, alternative time leads of the dependent variable have been considered, especially a one year lead having VA in t + 1 as dependent variable, and a two years lead having VA in t + 2 as dependent variable. These are reported in Appendix () and confirm the findings of the baseline specification. In order to focus on the main explanatory variable of interest, shows the degree of open innovation – measured in terms of BREADTH and DEPTH – of the industries and countries in the sample. It provides a first indication that the technological intensity of the industry is positively related to the degree of OI. For instance, industries typically characterised by a medium to low technological intensity such as construction (NACE Rev. 2 codes 41-43), accommodation and food services (55-56), real estate activities (68), and land transport and transport via pipelines (49) are among the industries that do not rely so much on open innovation in their innovative activities according to both breadth and depth measures. On the contrary, industries typically considered to be medium or highly technologically intensive such as the manufacture of machinery and equipment (28), telecommunications (61), and professional, scientific, and technical activities (69-75) have a larger degree of openness according to both breadth and depth measures. Another class of industries that show consistently high values of both breadth and depth measures of open innovation include the NACE Rev. 2 codes from 19 to 23. This industry class includes quite heterogeneous industries in terms of technological intensity, namely the medium-high or high chemistry (20) and pharmaceutical (21) industries as well as the medium-low manufacture of coke and refined petroleum products (19), of rubber and plastic products (22), and of other non-metallic mineral products (23).
Table 2. Aggregate measures of open innovation across industries and countries.
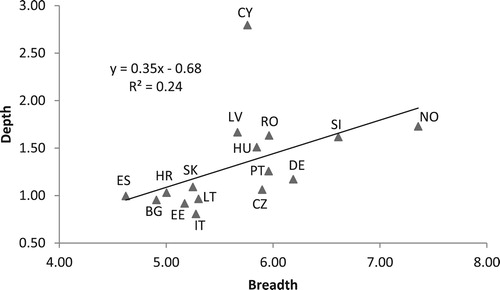
With regard to countries, provides an initial indication of a positive relationship between the closeness to the technological frontier and the degree of openness. Central and northern European countries such as Germany and Norway are among the most open. In contrast, peripheral countries have a differentiated degree of openness. While many of them, such as Bulgaria, Croatia, Estonia, Italy, and Spain, have moderate degree of open innovation according to both depth and breadth measures, others, namely Hungary, Romania, and Slovenia, have comparatively large degrees of openness.
and place industries and countries in the open innovation space defined by breadth and depth. They clearly show that open innovation measures are positively correlated. In particular, the Pearson correlation coefficient is equal to 0.8 in the case of industries, and 0.5 in the case of countries. The lower correlation for countries is due to the comparatively large value of depth for Cyprus: if Cyprus is removed, the correlation increases to 0.8.
Figure 1. Industries in the breadth-depth open innovation space. in Appendix provides a description of sector codes.
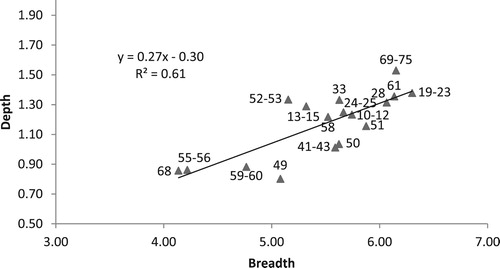
Figure 2. European countries in the breadth-depth open innovation space. in the Appendix provides a description of country codes.
reports the pairwise correlations between all variables employed in the regression analysis.
Table 3. Variables: correlation matrix.
Regarding the dependent variables, the alternative measures of innovation are highly correlated between each other and basically uncorrelated with value added. INNO denotes the share of firms that either introduced at least a product or a process innovation (or both) and is unsurprisingly showing a high-positive correlations (above 0.9) with the share of firms introducing a product (INPD) and the share of those introducing a process (INPS) innovation. The positive correlations between innovation variables on the one hand and, on the other hand, R&D expenditures (RD, between 0.4 and 0.6 according to the innovation variable) as well as, to a less extent (i.e. 0.2–0.3), the OI variable breadth (BREADTH), the share of exporters (EXPORT), and of firms being part of a group (GROUP) are an initial indication of positive relationships between those variables and the share of innovative firms at the country-sectoral level, which we test in the multivariate framework of Equation (1) in the following section. An analogous point can be made with reference to Equation (2) for the high positive correlations between value added on the one hand and, on the other hand, labour and capital inputs (0.9) and R&D expenditures (0.7), while OI variables are uncorrelated to valued added, suggesting that there is no direct relationships.
Focusing on the correlations between explanatory variables, it was observed that high correlations (above 0.9) between the OI variables BREADTH and DEPTH and their quadratic terms could create a multicollinearity issue. The Variance Inflation Factor (VIF), which is a standard statistical test for the severity of multicollinearity in an ordinary least squares regression analysis, increases from 8.5 to 18.8 when OI quadratic terms are introduced, crossing the standard threshold (equal to 10) to be taken as an indication of the presence of multicollinearity (Lin Citation2008). This test casts some doubt on the estimates of the standard errors from the models including OI quadratic terms since they could be inflated by the high multicollinearity. Accordingly, OI quadratic terms do not typically enter the specification of econometric models in the analysis. An exception is made for models on innovation (Equation (1)), for which results from specifications with OI quadratic terms (alongside those without them) are also shown to be aligned with most previous studies finding curvilinear effects of OI on innovation at the firm level (e.g. Laursen and Salter Citation2006). OI quadratic terms are not used in models for economic performance (Equation (2)). Though some explanatory variables of these models display a relatively high correlation (in particular, the labour and capital inputs have 0.8 correlation), VIF statistics are below the statistical threshold in all adopted specifications, indicating that multicollinearity is a minor issue in these models.
4 Results and discussion
As for the first hypothesis we find a confirmation that OI affects innovation – even at the aggregate level, and that curvilinear effect emerge.
Results of the first part of the analysis (), focussing on the sectoral drivers of innovation, confirm some of the curvilinear effects of the different OI modes on the innovation outcomes, as found in Laursen and Salter (Citation2006) at the firm level, can also be extended to a broader industry level with further significant differences and qualifications. When distinguishing between product and process innovation outcomes, it was found that widening OI modes (BREADTH) have a larger effect with a stronger statistical significance than deepening OI modes (DEPTH) when predicting innovation outcomes, with DEPTH being not significant for the single typologies of product and process innovation. Consequently, if the industry-country units are considered to be ‘systems of actors', then increasing the number of connections and collaborations between the ‘nodes' within each system increases the likelihood of introducing more innovations at the aggregate level since when more knowledge is shared between a wider variety of actors, the more innovation tends to be distributed. The curvilinear effect of BREADTH is confirmed, and it can be explained again in the framework of innovation network theory, by assuming that, as the number of connections becomes larger, the redundancy of information shared between the nodes also increases (Uzzi Citation1996).
Table 4. Initial equations estimating drivers of innovation, product innovation, and process innovation.
Therefore, since the marginal value (in term of originality of information shared) of adding one more connection into the system tends to decrease (when the number of connections are too large), then a decreasing aggregate level of innovation may be observed when there are too many links since the units tend to become more ‘homogeneous' when they share the same type of knowledge (Granovetter Citation1973; Burt Citation1992). In addition, the curvilinear effects of deepening OI modes are almost negligible for product and process innovation, meaning that the returns in terms of innovation outcomes decrease more steeply when widening rather than deepening OI modes. On the one hand, these results suggest that having a wide set of sources is a key asset that is likely to generate a wider variety of new ideas for general, product, and process innovations. On the other hand, engaging deeply in OI does not affect product nor process innovation probably due to the enhanced risk of information leakages and hold-up situations stemming from too close and exclusive relationships with external partners (Uzzi Citation1996). With regard to the main control, internal R&D remains an important determinant, confirming the key role that investment in innovation has in enhancing both the innovative and absorptive capacity of the firms (Cohen and Levinthal Citation1990).
When considering economic performance as dependent variable (in terms of value added, ), results concerning capital (logK), labour (logL), and R&D (logRD) are coherent with the existing literature (column 1) and can be read in terms of elasticities as dependent and explanatory variables included in logarithms. Once OI variables (column 2) have been included, none of them directly influences value added. However, column 3 and column 4 show that, when adding the interaction terms in our models, R&D and OI do positively interact. plots the average marginal effect on value added of each interacted variable when the other varies. It makes clear that R&D expenditures and open innovation reinforce each other in boosting country-industry’s value added. Statistically significant positive effects of open innovation appear when R&D expenditures are high enough (the two graphs on the left of ). Conversely, the positive effect of R&D expenditures on country-industry value added is only statistically significant for high levels of open innovation (the two graphs on the right of ). Therefore, there is evidence of complementarity between OI modes and the ‘absorptive capacity’ (proxied by R&D) when explaining the performance of an industry, a result that is different from the ‘substitution effect' between internal R&D and openness at the firm level found by Laursen and Salter (Citation2006).
Figure 3. Average marginal effects of R&D expenditures and open innovation on value added with 95% confidence intervals.
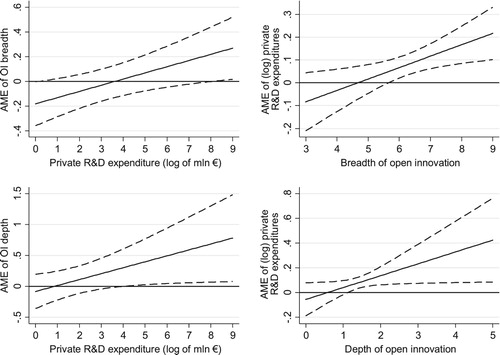
Table 5. Cobb Douglas on value added.
These results can be explained by assuming a direct positive relationship between the radicalness of the innovation developed and the economic returns generated by its commercialisation. Although this cannot be directly tested on our empirical framework can be assumed, that is, the radicalness of an innovation able to shed light on this finding. In fact, while exploiting a wide set of information sources may be beneficial to introducing clusters of incremental innovations in a given industry, developing a radical (and economically breakthrough) innovation (that usually requires some time to become profitable) is more likely to rely on the access to exclusive and specialised knowledge which can be effectively only exploited by establishing closed and repeated relationships with a restricted number of key external partners.
These results suggest the OI mode has a double effect, which contributes to both innovative and economic outcomes. However, only deep and persistent relationships with partners generate significant economic outcomes and strategic advantages some years after its development. Policy implications are derived from this finding.
Continuous and dashed lines respectively indicate average marginal effects’ (AMEs) point –estimates, and 95% confidence interval. The two graphs at the top are derived using estimates of model (3) in with the interaction between OI breadth and (log) R&D expenditures. The two graphs at the bottom using estimates of model (4) with the interaction between OI depth and (log) R&D expenditures.
5 Concluding remarks
This paper presents findings on the innovative and economic returns of having an open innovative strategy at the aggregate sectoral level for 16 EU countries. In general, the analysis supports the presence of positive returns of OI on innovative outcomes, that is, on both overall innovation and, more specifically, on product and process innovations. However, OI suffers from possible diminishing returns: relying too much on external knowledge can be detrimental to sectoral innovativeness. In addition, OI mode is found to have an indirect impact on aggregate value added due to positively interacting and complementing the other innovation input (R&D expenditures) that are shown to be significant in explaining economic performance. For policy makers, the evidence on the importance of an open mode for successful innovation, and especially of having a broader range of partners firms can draw upon when searching for information, indicates that it is important to create and maintain conditions in which knowledge and innovation networks flourish. The interplay between OI and R&D in promoting value added also suggests a role for policy to create conditions of stability that enable persistent, intensive collaborations between companies and partners. Furthermore, the results not only confirm the importance of absorptive capacity in general for (open) innovation, but also more specifically of being actively involved in pursuing R&D. Therefore, it further confirms that policies promoting R&D investments throughout the innovation system point in the right direction. These findings are also relevant in the context of ‘smart specialization’ policies of the European Union, which, put simply, are grounded on a place-based approach that identifies strategic areas for intervention based on sectoral strengths. They suggest that, on the one side, monitoring the openness of sectors should be part of the assessment of local innovative assets; and, on the other side, promoting an OI mode should be part of the policy mix to boost the impact of R&D expenditure in R&D-intensive industries.
There are certain limitations the study could not solve, which should be acknowledged. Although largely a useful source of information, the Community Innovation Survey contains self-reported information at the firm level, which is therefore subjective to a systematic response bias. Values were aggregated at the sectoral level so that in principle, if the direction of the error is random, this should largely mitigate the problem, but it is not possible to be sure about the absence of any bias in this respect. Secondly, data on OI was only available for the 3 selected consecutive waves because the next edition of the CIS (2012–2014) has removed the section on external information sourced. This limited the sample of the analysis and forced us to limit the number of explanatory variables to the– reasonable – minimum.
Nevertheless, despite the data constraints, the new empirical evidence provided in this paper can be used to assess the overall economic returns and innovation outcomes associated with different OI modes, possibly moderated by internal R&D investments, when considering a cross industry level of analysis in different EU countries.
Acknowledgements
The authors would like to thank the Editor, three anonymous reviewers and the participants of the R&D Management 2018 (Jul 2018, Milan) and the Science, Technology and Innovation Indicators 2018 (Sep 2018, Leiden) conferences for precious feedbacks that substantially contributed to improving this work. The views expressed are those of the authors and do not imply a policy position of the European Commission. Neither the European Commission nor any person acting on behalf of the Commission is responsible for the use which might be made of this publication.
Disclosure statement
No potential conflict of interest was reported by the authors.
Additional information
Funding
Notes
1 Henceforth only tables with non-weighted variables are reported. The others are available upon request.
2 Alternative innovation outputs have also been considered for the analysis. The share of marketing innovators and the share of organisational innovators have shown similar results to those outlined for the selected outcomes with respect to the OI variables. New to the markets product innovations are also considered, and no influence of OI on it was found. One explanation is that the relatively low occurrence of new to the markets product innovations prevents the analysis from establishing aggregate links with industry and country characteristics.
3 An alternative would have been to measure Capital through a Capital Formation variable, but too many missing values conditioned the choice made here.
References
- Abernathy, W. J., and J. M. Utterback. 1978. “Patterns of Industrial Innovation.” Technology Review 80 (7): 40–47.
- Antonelli, C. 2017. “The Derived Demand for Knowledge.” Economics of Innovation and New Technology 26 (1–2): 183–194.
- Arora, A., S. Athreye, and C. Huang. 2016. “The Paradox of Openness Revisited: Collaborative Innovation and Patenting by UK Innovators.” Research Policy 45 (7): 1352–1361.
- Asheim, B. T., and M. S. Gertler. 2005. “Regional Innovation Systems and the Geographical Foundations of Innovation.” In The Oxford Handbook of Innovation, 291–317.
- Aslesen, H. W., and M. Freel. 2012. “Industrial Knowledge Bases as Drivers of Open Innovation?” Industry and Innovation 19: 563–584.
- Bartelsman, E., E. Hagsten, and M. Polder. 2018. “Micro Moments Database for Cross-Country Analysis of ICT, Innovation, and Economic Outcomes.” Journal of Economics & Management Strategy 27 (3): 626–648.
- Battisti, G., J. Gallego, L. Rubalcaba, and P. Windrum. 2015. “Open Innovation in Services: Knowledge Sources, Intellectual Property Rights and Internationalization.” Economics of Innovation and New Technology 24 (3): 223–247.
- Belussi, F., A. Sammarra, and S. R. Sedita. 2010. “Learning at the Boundaries in an “Open Regional Innovation System”: A Focus on Firms’ Innovation Strategies in the Emilia Romagna Life Science Industry.” Research Policy 39 (6): 710–721.
- Bogers, M., A. Zobel, A. Afuah, E. Almirall, L. Dahlander, L. Frederiksen, and A. Ter Wall. 2016. “The Open Innovation Research Landscape: Established Perspectives and Emerging Themes Across Different Levels of Analysis.” Industry and Innovation 24 (1): 8–40.
- Bogliacino, F., and M. Pianta. 2016. “The Pavitt Taxonomy, Revisited: Patterns of Innovation in Manufacturing and Services.” Economia Politica 33 (2): 153–180.
- Burt, R. 1992. “Structural Holes: The Social Structure of Competition.” In Networks and Organizations: Structure, Form and Action, edited by N. Nohria and R. Eccles, 57–91. Boston: Harvard Business School Press.
- Cassiman, B., and G. Valentini. 2016. “Open Innovation: Are Inbound and Outbound Knowledge Flows Really Complementary?” Strategic Management Journal 37: 1034–1046.
- Cassiman, B., and R. Veugelers. 2002. “R and D Cooperation and Spillovers: Some Empirical Evidence.” The American Economic Review 92 (4): 1169–1184.
- Chesbrough, H. W. 2003. Open Innovation. Cambridge, MA: Harvard University Press.
- Chesbrough, H. W. 2006. Open Innovation: Researching a New Paradigm. Oxford: Oxford University Press. (eds. Vanhaverbeke, W., and West, J.).
- Christensen, J. F., M. H. Olesen, and J. S. Kjær. 2005. “The Industrial Dynamics of Open Innovation – evidence from the Transformation of Consumer Electronics.” Research Policy 34: 1533–1549.
- Cobb, C. W., and P. H. Douglas. 1928. “A Theory of Production.” American Economic Review 18 (sup): 139–165.
- Cohen, W. M., and D. A. Levinthal. 1990. “Absorptive Capacity: A New Perspective on Learning and Innovation Wesley M. Cohen; Daniel A. Levinthal Absorptive Capacity: A New Perspective on Learning and Innovation.” Administrative Science Quaterly 35 (1): 128–152.
- Colombo, M. G., E. Piva, and C. Rossi-Lamastra. 2014. “Open Innovation and Within-Industry Diversification in Small and Medium Enterprises: The Case of Open Source Software Firms.” Research Policy 43 (5): 891–902.
- Dahlander, L., and D. M. Gann. 2010. “How Open Is Innovation ?” Research Policy 39 (6): 699–709.
- Dankbaar, B., and G. Vissers. 2010. “The Changing Role of the Firm.” In The Theory and Practice of Innovation Policy, edited by R. E. Smits, S. Kuhlmann, and P. Shapira, 50–74. Northampton: Edward Elgar.
- de Paulo, A. F., and G. S. Porto. 2017. “Solar Energy Technologies and Open Innovation: A Study Based on Bibliometric and Social Network Analysis.” Energy Policy 108 (June): 228–238.
- Doloreux, D., R. Shearmur, and M. Rodriguez. 2016. “Determinants of R&D in Knowledge-Intensive Business Services Firms.” Economics of Innovation and New Technology 25 (4): 391–405.
- Dyer, J., N. Furr, and C. Lefrandt. 2014. “The Industries Plagued by the Most Uncertainty.” Harvard Business Review. Digital article. https://hbr.org/2014/09/the-industries-plagued-by-the-mostuncertainty.
- European Commission. 2016. Better Regulations for Innovation-Driven Investment at EU Level, Commission Staff Working Document.
- European Commission. 2017. Europe’s Future Open Innovation, Open Science, Open to the World: Reflections of the Research, Innovation and Science Policy Experts (RISE) High Level Group. Luxemburg: Publication Office of the European Union.
- Freeman, C. 1995. “The ‘National System of Innovation’ in Historical Perspective.” Cambridge Journal of Economics 19 (1): 5–24.
- Gambardella, A., P. Giuri, and A. Luzzi. 2007. “The Market for Patents in Europe.” Research Policy 36 (8): 1163–1183.
- Gassmann, O., E. Enkel, and H. Chesbrough. 2010. “The Future of Open Innovation.” R&D Management 40 (3): 213–221.
- Goedhuys, M., and R. Veugelers. 2012. “Innovation Strategies, Process and Product Innovations and Growth: Firm-Level Evidence from Brazil.” Structural Change and Economic Dynamics 23 (4): 516–529.
- Granovetter, M. S. 1973. “The Strength of Weak Ties.” American Journal of Sociology 78: 1360–1380.
- Greco, M., G. Locatelli, and S. Lisi. 2017. “Open Innovation in the Power and Energy Sector: Bringing Together Government Policies, Companies’ Interests, and Academic Essence.” Energy Policy 104: 316–324.
- Hagedoorn, J., and A.-K. Ridder. 2012. “ Open Innovation, Contracts, and Intellectual Property Rights: An Exploratory Empirical Study (No. 2012–25).” UNU-MERIT Working Papers. Maastricht.
- Hu, Y., P. McNamara, and D. McLoughlin. 2015. “Outbound Open Innovation in Bio-Pharmaceutical Out-Licensing.” Technovation 35: 46–58.
- Huggins, R., H. Izushi, N. Clifton, S. Jenkins, D. Prokop, and C. Whitfield. 2010. “ Sourcing Knowledge for Innovation, the International Dimension.” http://www.nesta.org.uk/publications/sourcing-knowledge-innovation.
- Hung, K. P., and C. Chou. 2013. “The Impact of Open Innovation on Firm Performance: The Moderating Effects of Internal R&D and Environmental Turbulence.” Technovation 33 (10–11): 368–380.
- Laursen, K., and A. Salter. 2006. “Open for Innovation: The Role of Openness in Explaining Innovation Performance among U.K. Manufacturing Firms.” Strategic Management Journal 27 (2): 131–150.
- Laursen, K., and A. J. Salter. 2014. “The Paradox of Openness : Appropriability, External Search and Collaboration.” Research Policy 43 (5): 867–878.
- Lin, F.-Jenq. 2008. “Solving Multicollinearity in the Process of Fitting Regression Model Using the Nested Estimate Procedure.” Quality and Quantity 42 (3): 417–426. doi:10.1007/s11135-006-9055-1.
- Love, J. H., S. Roper, and J. R. Bryson. 2011. “Openness, Knowledge, Innovation and Growth in UK Business Services.” Research Policy 40 (10): 1438–1452.
- Lucchese, M., and M. Pianta. 2012. “Innovation and Employment in Economic Cycles.” Comparative Economic Studies 54: 341–359.
- Lundvall, B. A., ed. 1992. National Systems of Innovation: Towards a Theory of Innovation and Interactive Learning. London: Pinter.
- Lundvall, BÅ. 2007. “National Innovation Systems – Analytical Concept and Development Tool.” Industry and Innovation 14 (1): 95–119.
- Malerba, F. 2005. “Sectoral Systems of Innovation: A Framework for Linking Innovation to the Knowledge Base, Structure and Dynamics of Sectors.” Economics of Innovation and New Technology 14: 63–82.
- Malerba, F., and L. Orsenigo. 1997. “Technological Regimes and Sectoral Patterns of Innovative Activities.” Industrial and Corporate Change 6 (1): 83–118.
- Marshall, A. 1890. Principles of Economics. London: Macmillan.
- Medda, G., C. Piga, and D. S. Siegel. 2006. “Assessing the Returns to Collaborative Research: Firm-Level Evidence From Italy.” Economics of Innovation and New Technology 15 (1): 37–50.
- Nelson, R. R., ed. 1993. National Innovation Systems: A Comparative Analysis. Oxford: Oxford University Press.
- Ozkan, N. N. 2015. “An Example of Open Innovation: PandG.” Procedia – Social and Behavioral Sciences 195: 1496–1502.
- Pilav-Velić, A., and O. Marjanovic. 2016. “Integrating Open Innovation and Business Process Innovation: Insights from a Large-Scale Study on a Transition Economy.” Information and Management 53 (3): 398–408.
- Popa, S., P. Soto-Acosta, and I. Martinez-Conesa. 2017. “Antecedents, Moderators, and Outcomes of Innovation Climate and Open Innovation: An Empirical Study in SMEs.” Technological Forecasting and Social Change 118: 134–142.
- Radicic, D., and M. Balavac. 2019. “In-House R&D, External R&D and Cooperation Breadth in Spanish Manufacturing Firms: Is There a Synergistic Effect on Innovation Outputs?” Economics of Innovation and New Technology 28 (6): 590–615.
- Radnejad, A. B., H. Vredenburg, and J. Woiceshyn. 2017. “Meta-organizing for Open Innovation Under Environmental and Social Pressures in the oil Industry.” Technovation 66): 14–27.
- Reed, R., S. Storrud-Barnes, and L. Jessup. 2012. “How Open Innovation Affects the Drivers of Competitive Advantage: Trading the Benefits of IP Creation and Ownership for Free Invention.” Management Decision 50 (1): 58–73.
- Roper, S., J. H. Love, and K. Bonner. 2017. “Firms’ Knowledge Search and Local Knowledge Externalities in Innovation Performance.” Research Policy 46 (1): 43–56.
- Roper, S., P. Vahter, and J. H. Love. 2013. “Externalities of Openness in Innovation.” Research Policy 42 (9): 1544–1554.
- Segarra, A., and M. Teruel. 2014. “High-growth Firms and Innovation: An Empirical Analysis for Spanish Firms.” Small Business Economics 43 (4): 805–821.
- Sofka, W., and C. Grimpe. 2010. “Specialized Search and Innovation Performance – evidence Across Europe.” R&D Management 40 (3): 310–323.
- Sovacool, B. K., J. Jeppesen, J. Bandsholm, J. Asmussen, R. Balachandran, S. Vestergaard, and F. Bjørn-Thygesen. 2017. “Navigating the “Paradox of Openness” in Energy and Transport Innovation: Insights from Eight Corporate Clean Technology Research and Development Case Studies.” Energy Policy 105: 236–245.
- Tödtling, F., P.P. homme van Reine, and S. Dörhöfer. 2011. “Open Innovation and Regional Culture-Findings From Different Industrial and Regional Settings.” European Planning Studies 19: 1885–1907.
- Tomlinson, P. R., and F. M. Fai. 2013. “The Nature of SME co-Operation and Innovation: A Multi-Scalar and Multi-Dimensional Analysis.” International Journal of Production Economics 141: 316–326.
- Tomlinson, P. R., and F. M. Fai. 2016. “The Impact of Deep Vertical Supply Chain Relationships upon Focal-Firm Innovation Performance.” R&D Management 46: 277–290.
- Uzzi, B. 1996. “The Sources and Consequences of Embeddedness for the Economic Performance of Organizations.” American Sociological Review 61: 674–698.
- Wang, C.-H., C.-H. Chang, and G. C. Shen. 2015. “The Effect of Inbound Open Innovation on Firm Performance: Evidence from High-Tech Industry.” Technological Forecasting and Social Change 99: 222–230.
- West, J., A. Salter, W. Vanhaverbeke, and H. Chesbrough. 2014. “Open Innovation: The Next Decade.” Research Policy 43 (5): 805–811.
- Zobel, A. K., B. Lokshin, and J. Hagedoorn. 2017. “Formal and Informal Appropriation Mechanisms: The Role of Openness and Innovativeness.” Technovation 59: 44–54.