
 ?Mathematical formulae have been encoded as MathML and are displayed in this HTML version using MathJax in order to improve their display. Uncheck the box to turn MathJax off. This feature requires Javascript. Click on a formula to zoom.
ABSTRACT
For a long time, the measurement of innovation has been at the forefront of policymakers' and researchers' agenda worldwide. Therefore, there is an ongoing debate about which indicators should be used to measure innovation. Recent approaches have favoured the use of composite innovation indicators. The European Innovation Scoreboard (EIS) is a relevant tool for benchmarking innovation in Europe. Still, the EIS lacks a proper scheme for weighting the included indicators according to their relative importance. Moreover, despite there is a consensus on the importance of interaction between different dimensions of innovation, there is no composite indicator taking into account of this. We propose an appraisal methodology permitting to take into consideration the interaction of dimensions to be aggregated and robustness concerns related to the elicitation of the weights assigned to the elementary indicators structured in a hierarchical way. With this aim, we apply a multiple-criteria decision-making approach being the conjunction of three methodologies, namely, the multiple-criteria hierarchy process, the Choquet integral and the stochastic multicriteria acceptability analysis. It helps the users to rank and benchmark countries' innovation performance at partial and global level taking into account the importance and interaction of dimensions as well as robustness concerns.
1. Introduction
Innovation is considered among, if not the main driver(s) of sustainable economic growth. Since 1992, the Oslo Manual has been recognized as the international standard of reference for conceptualizing and measuring innovation. According to it ‘an innovation is a new or improved product or process (or combination thereof) that differs significantly from the unit's previous products or processes and that has been made available to potential users (product) or brought into use by the unit (process)’ (OECD/Eurostat Citation2018). Following its guidelines, the European Union has induced a need for developing a monitoring framework to assess the innovation performance across EU countries to understand and benchmark the success of policy measures in facilitating innovation and further economic growth.
Since innovation activities are very complex, they are consequently challenging to measure (Holgersson and Kekezi Citation2018). There is no consensus about which indicators should be used to measure innovation. Initially, the use of individual indicators from national statistics such as the number of patents (Schmookler Citation1950) or research and development (R&D) expenditures (Griliches Citation1984) was the most commonly applied measures. However, starting from the 1990s, after such pioneering works as Hollenstein (Citation1996) who introduced the use of Composite Innovation Indicators (CIIs), scholars have started to favour and develop aggregate measures for innovation at different geographical levels. The most comprehensive CII is the Global Innovation Index published jointly by Cornell University, INSEAD, and the World Intellectual Property Organization (WIPO). It is constructed in a multi-stage weighted average aggregation procedure from 80 single indicators (Dutta, Lanvin, and Wunsch-Vincent Citation2019). In Europe, the European Commission has introduced the European Innovation Scoreboard. It provides a composite indicator, the Summary Innovation Index (SII), in which the innovation performance of EU countries is assessed from the unweighted average of the scores for 27 indicators covering 10 dimensions structured in 4 main blocks/pillars (Framework Conditions, Investments, Innovation Activities and Impacts) (Hollanders and Es-Sadki Citation2017). In a similar approach, but at regional level, the Regional Innovation Scoreboard is computed as the unweighted average of the normalized indicators for 238 EU regions (Hollanders and Es-Sadki Citation2019).
To construct CIIs, summarizing national innovation performance seems not to be an easy task and three main problems are usually considered: (i) how to choose individual variables to be used as innovation indicators, (ii) how the values are normalized and (iii) how to choose the weights to be assigned, and the aggregation rules to be implemented (Cherchye et al. Citation2008). The application of such CIIs for measuring (national) innovation performance and their utility in directing innovation policy has also been questioned (Grupp and Mogee Citation2004; Schibany and Streicher Citation2008; Grupp and Schubert Citation2010; Makkonen and van der Have Citation2013; Adam Citation2014; Edquist and Zabala Citation2015; Kozłowski Citation2015; Hauser et al. Citation2018) mainly due to the problems related to the varying statistical and mathematical methods utilised for determining weights when aggregating the indicators into a CII.
In this paper, we are employing a methodology presented in Angilella et al. (Citation2016) and, then, applied in Angilella et al. (Citation2018) and Corrente, Greco, and Słowiński (Citation2019), to construct a new CII which is grounded on the basic idea expressed by the most advanced theories on the innovation capacity of countries, such as the National Innovation System (Lundvall Citation2010), the Triple and Quadruple Helix (Etzkowitz and Leydesdorff Citation2000) and the Innovation Ecosystems (Moore Citation1993) that consider the innovation as the result of the cooperation of different actors (primarily: university, industry and government). Indeed, we believe that a reliable CII should take into account the following points that the considered methodology is able to consider:
interaction between elementary indicators to represent synergy or redundancy between their performances,
hierarchical structure of indicators permitting to group homogeneous subsets of indicators in order to handle their plurality and heterogeneity,
robustness concerns related to the consideration of a probabilistic ranking representing fluctuations of the scores assigned to countries in an interval of variation of the weights assigned to considered indicators;
definition of a score for each one of the main innovation system actors, that is, university, industry and government taking into account their specific preference elicitation.
Let us discuss one by one the above four points. With respect to the interaction between different indicators measuring innovation capacity, despite its widely acknowledged relevance, it has never been considered before in the construction of any CII. In fact, as pointed out in one of the most relevant empirical analysis on the domain (Furman, Porter, and Stern Citation2002), ‘the various elements of national innovative capacity are complementary in the sense that the marginal boost to ideas production from increasing one factor is increasing in the level of all of the other factors’. For example, according to Porter and Stern (Citation2001), ‘innovation intensity depends on an interaction between private sector strategies and public sector policies and institutions’. Therefore, since there are synergies between the different dimensions of innovation, a ‘surplus’ should be given to those countries that present good values for both, the quality of private sector strategies and the quality of public sector strategies, when measuring their innovative performance. Again Porter and Stern (Citation2001) points out that, ‘many policy discussions assume the existence of a sharp trade-off between goals such as health, environment, safety, and short-term economic growth. However, a healthy rate of innovation increases the likelihood that new technologies will emerge that substantially temper or even eliminate such trade-offs’. Therefore, the performance of countries doing well in dimensions measuring health, environment, safety and short-term economic growth may be over-evaluated: these dimensions are highly correlated with each other and, therefore, there is a certain level of redundancy in the information they supply.
With respect to the hierarchical structure of elementary indicators, the EIS methodological report (Hollanders and Es-Sadki Citation2017) claims the need for a new methodology in constructing the EIS: ‘it may be advisable for future refinements of the EIS to make use of a hierarchical structure in which indicators are first aggregated in dimension composites and subsequently, into group or overall averages’. Accordingly, hierarchy of considered indicators is an issue we want to take into account. While the EIS does include ten innovation dimensions, to the best of our knowledge, the consideration of hierarchical structure of indicators has not been properly taken into account in the literature on CIIs by applying sophisticated aggregation methods. Indeed, the classical CIIs provide a whole ranking of the countries at hand, aggregating their performances and, therefore, putting together all considered aspects. Regarding the EIS, countries are evaluated on indicators that can be grouped in four different macro-indicators, that is: Framework Conditions, Investments, Innovation Activities and Impacts. In this paper, we propose a methodology to obtain a CII that provides policy makers with more detailed information by building a ranking for each node of the hierarchy according to their interest. This has an added value for the policy maker since it helps them to discover the strong and weak points of the innovation performance of a given country as shown by the macro-indicators in which they display the highest or lowest rank positions.
With respect to the robustness concerns, we claim that the weights assigned to elementary indicators cannot be fixed in a rigid and punctual form, but it is necessary to consider intervals of variation related to their relative indeterminacy (see e.g. Greco et al. Citation2018, Citation2019a). This indeterminacy is specifically relevant in the evaluation of a complex phenomenon as the innovation process in which the relevance of each indicator depends on many specific conditions that can change in space and time according to the perception of the involved agents. It appears reasonable to consider a probabilistic rather than a deterministic ranking, so that for each country, the methodology supplies a more realistic probability distribution of its ranking position than a rather meaningless univocal placement.
With respect to actors (university, industry and government), it is reasonable to assume that each actor has specific aims and objectives that a single ‘objective’ ranking would not take adequately into account. Consequently, the assessment of a single comprehensive ranking ‘valid for all the actors’ would be quite abstract, rather meaningless and, consequently, of little use. Instead, a ‘subjective’ ranking based on the preference elicitation of the experts representing each actor is much more realistic, meaningful and useful to understand the phenomenon.
From the methodological point of view, the CII we are proposing is based on the MCHP-Ch-SMAA methodology (Angilella et al. Citation2016), being a multiple-criteria decision-making (MCDM) approach putting together three different MCDM methodologies, namely, the multiple-criteria hierarchy process (MCHP), the Choquet integral (Ch) and the stochastic multicriteria acceptability analysis (SMAA). The methodology has already been applied in other domains (Angilella et al. Citation2018; Corrente, Greco, and Słowiński Citation2019).
The remainder of the paper is organized as follows. In Section 2, we briefly introduce the MCDM and the main characteristics of the proposed new composite index. Section 3 describes the composite index combining MCHP, Choquet integral and SMAA. In Section 4, a case study related to the ranking of EU countries according to their innovation performance based on EIS criteria and incorporating Triple Helix agents point of view is presented. Conclusions and future lines of research are provided in Section 5.
2. Multiple-criteria decision-making and the characteristics of the new composite index
In MCDM, a set of alternatives are evaluated on several criteria to deal with a ranking, choice or sorting problem (Greco, Ehrgott, and Figueira Citation2016). Let us underline that, in our context, the alternatives will be the countries which innovation performances should be measured, while the criteria are the different indicators (such as human resources, finance and support, sales impacts, etc.) in which the countries are evaluated. The only objective information stemming from the evaluations of the alternatives is the dominance relation for which alternative a dominates alternative b if a is at least as good as b for all criteria and better for at least one of them. However, the objectivity of this relation is compensated by its poverty since, in comparing two alternatives, in general, none of them dominates the other.
To deal with any decision-making problem, therefore, the evaluations of the alternatives have to be aggregated. Most used MCDM aggregation methods are provided by the Multiple Attribute Value Theory (MAVT) (Keeney and Raiffa Citation1976). In MAVT, a utility/value function assigns a value
to each alternative
being representative of its goodness w.r.t. the problem at hand. In its simplest form, a utility function can be expressed as a weighted sum
, where n is the number of criteria,
is the weight of criterion
and
is the performance of a on
. In particular, it is assumed that
for all
and
.
From an MCDM perspective, a composite indicator can be considered as a value function assigning to each alternative (country) a single value and permitting, therefore, to rank order all the alternatives from the best to the worst. MCDM methodologies have been claimed as highly suitable alternatives for constructing composite indicators (Cherchye et al. Citation2008; Carayannis, Goletsis, and Grigoroudis Citation2018; El Gibari, Gómez, and Ruiz Citation2019; Garcia-Bernabeu, Cabello, and Ruiz Citation2020). Despite the use of MCDM to build composite indices, there still is no clear consensus on the best system as each method has its own strengths and limitations (Greco et al. Citation2019a). In particular, the main issues are related to the aggregation of indicators, indicators' weighting, robustness concerns and hierarchy of criteria.
With respect to the aggregation issue, while linear or additive aggregation prevails and it is the most widely used method, sometimes geometric aggregation is better suited for the purpose of constructing composite indicators. However, in all these cases, it is assumed that the set of indicators is mutually preferentially independent (Keeney and Raiffa Citation1976), while this is a strong assumption in defining composite indicators, since, as observed in the previous section, some of them present a positive interaction (synergy) or a negative interaction (redundancy). Considering the case study we will present in Section 4, for example, Intellectual Assets (IAS) and Linkages (LIN) are positively interacting, while IAS and Innovation (IT) are negatively interacting. Indeed, on one hand, a country presenting good performances on IAS does not present the same good performances on LIN. Therefore, a bonus should be given to countries presenting simultaneously good performances on IAS and IT. On the other hand, countries presenting good performances on IAS have good performances on IT as well. Therefore, when adding up the importance of these two indicators, there is the risk of over-evaluating the considered country. As a consequence, a malus should be added to those countries presenting good performances on these two indicators. For this reason, in this paper, we propose the application of the Choquet integral (Choquet Citation1953; Grabisch Citation1996) to take into account the possible positive and negative interactions that could be observed among the indicators. The Choquet integral is a multiple-criteria decision analysis method that permits, first, to give a ‘bonus’ to countries that are performing well on dimensions where there are synergies and, second, to avoid the problems of over-evaluation in case of countries that are performing well in dimensions where there are redundancies. In fact, the Choquet integral generalizes the usual weighted arithmetic mean permitting to take into account weights of the considered dimensions that are not additive.
With respect to the indicators' weighting and the robustness concerns, the proposed composite index is based on the judgements (or preferences) of experts representing the three helices of the Triple Helix model, that are, university, government and industry (Leydesdorff and Etzkowitz Citation1998; Etzkowitz and Leydesdorff Citation2000). In particular, the information provided by these experts will be used in an indirect procedure to infer the weights of the indicators. However, differently from the known composite indices using a single weight vector, our procedure will take into account a plurality of weight vectors by applying the SMAA. This approach will produce robust information on the ranking of each country in probabilistic terms.
Finally, in addition to a comprehensive ranking aggregating simultaneously all the indicators, the MCHP-Ch-SMAA methodology will produce robust information taking into account single aspects of the problem at hand by the application of the MCHP. In this way, the policy makers will get more precise indications on the strong and weak points of each country depending on the rank position of each of them on the partial rankings therefore obtained.
3. Multiple-criteria hierarchy process, Choquet integral preference model and stochastic multicriteria acceptability analysis
The MCHP (Corrente, Greco, and Słowiński Citation2012) is a methodology recently introduced in MCDM to deal with decision-making problems in which criteria are not at the same level but they are structured in a hierarchical way. This means that it is possible to define a root node , being the objective of the problem, macro-criteria
descending from it, and so on, until the elementary criteria
being the criteria placed at the bottom of the hierarchy and on which the alternatives at hand are evaluated (see for an example of an hierarchy of criteria).
Figure 1. Example on an hierarchy of criteria with 10 elementary criteria taken from Angilella et al. (Citation2018).
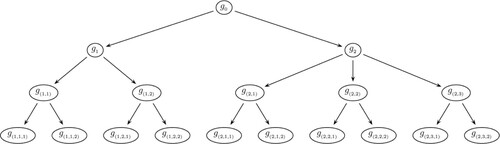
The advantage of taking into account the MCHP is two-fold: (i) it permits the Decision Maker (DM) to provide information on the alternatives not only at the comprehensive level (that is at the level) but also considering a particular criterion
in the hierarchy; (ii) it gives deeper information to the DM by defining a preference relation at each node of the hierarchy as well as at the comprehensive level. In this way, the DM can compare the alternatives not only globally, taking therefore into account all aspects simultaneously, but also focusing on the aspects which are relevant for her/him.
In the following, we shall briefly recall the terminology that will be useful for the description of the methodology as well as for the discussion on the results of the considered application:
denotes the set of alternatives at hand,
The Choquet integral preference model can be included under the MAVT and it can be considered as a generalization of the weighted sum.
Differently from the weighted sum, the use of the Choquet integral is based on a capacity , being a set function that assigns a weight not only to each criterion, but to all subsets of criteria
such that the monotonicity constraints (
) for all
and the normalization constraints (
and
) are satisfied.
The main point of the Choquet integral preference model is that it is able to take into account the possible positive or negative interaction existing between criteria. Given , we say that
and
are positively interacting if the importance assigned to them together (
)) is greater than the sum of their importance when considered separately (
)), while we say that
and
are negatively interacting if the importance assigned to them together is lower than the sum of their importance when considered separately. Of course, the same type of interactions can be defined for non-elementary criteria placed at the same level of the hierarchy of criteria.
To make things easier, a Möbius transform of μ (Rota Citation1964) and k-additive capacities (Grabisch Citation1997) are used in practical applications:
a Möbius transform of the capacity μ is a set function
μ is called k-additive iff its Möbius transform is such that
Considering 2-additive capacities, the monotonicity and normalization constraints above can be rewritten in the following way:
(1)
(1) Therefore, for each
and for each criterion
in the hierarchy, the Choquet integral of a on
is computed as
(2)
(2) As already mentioned above, in applying the Choquet integral, a single value is assigned to each criterion and to each subset of criteria. Therefore, the importance of a criterion is not dependent on itself only but also on its contribution to all coalitions of criteria. To take into account this aspect, the Shapley index (Shapley Citation1953) and the Murofushi index (Murofushi and Soneda Citation1993) are defined:
the Shapley index
the Murofushi index
As it is evident from above, the application of the 2-additive Choquet integral involves the knowledge of several parameters: considering the Möbius decomposition m, one value for each elementary criterion and one for each pair of elementary criteria. Asking the DM to provide directly all these parameters is meaningless both for their huge number as well as for the difficult interpretation of their meaning. For this reason, to fix their values, an indirect elicitation procedure can be used. The DM is asked to provide information in terms of comparison between alternatives (for example, a is preferred to b), comparison between criteria ( is more important than
, with
) or in terms of interactions between criteria (
and
are positively or negatively interacting). This preference information is therefore translated into inequality constraints (for example, the preference of a over b on
is translated into the constraint
, while the positive interaction between
and
is translated into the constraint
; in both cases, ε is an auxiliary variable used to transform the strict inequality constraints into weak inequality ones). Denoting by
the set of constraints translating the preferences provided by the DM, to check if there exists at least one instance of the preference model, that is one vector
for which all the technical constraints
as well as all constraints translating the preferences provided by the DM (
) are satisfied, one has to solve the following LP problem:
(3)
(3) If E is feasible and
, then there exists at least one instance of the preference model compatible with the preferences provided by the DM (briefly, a compatible model). In the opposite case, there is no compatible model and the reason can be investigated by using one of the methods proposed in Mousseau et al. (Citation2003). In general, if there is at least one compatible model, there are many of them. Even if all of them are compatible with the preferences provided by the DM, the application of the considered preference model using different compatible models would provide different recommendations w.r.t. the problem at hand. For such a reason, the choice of only one compatible model could be considered meaningless or arbitrary to some extent and, therefore, a composite index taking into account all the models compatible with the preferences provided by the DM would be preferable. Moreover, from the innovation perspective, the use of a single weight vector (equal weights or any other weight vector) implies the consideration of the perspective of a unique policy maker. However, in evaluating the innovative capabilities of a country, a policy maker could give more importance to one indicator and less importance to others, while another policy maker could be interested into giving more importance to other indicators. For such a reason, a CII being able to take into account the perspectives of several policy makers, providing therefore robust information on the rank position got by a country varying the importance of the weights attached to the different indicators could be welcome. Consequently, in the following, we shall describe the SMAA (Lahdelma, Hokkanen, and Salminen Citation1998), being the methodology applied to the Choquet integral preference model that we have used in our application (for some recent extensions and applications of the SMAA methodology, see Angilella et al. Citation2018; Corrente et al. Citation2019; Greco et al. Citation2019b).
SMAA provides to the DM robust recommendations by considering not just one but the whole set of models compatible with her/his preferences. Since the constraints in E define a set composed by an infinite number of vectors, the application of SMAA begins with the sampling of several of them. Following Tervonen and Lahdelma (Citation2007), the number of sampled compatible models in SMAA applications varies between and
and it depends from the accuracy that one would like to achieve. In our case study, we performed 10,000 sampling of vectors compatible with the preferences provided by the DM. We shall denote by M the set composed of all sampled vectors. To each of these compatible vectors
corresponds an alternatives' ranking, where the rank position of the alternative a w.r.t. criterion
obtained considering the vector of parameters
is computed as
(4)
(4) where
and
. Pay attention to the fact that in the definition of the rank function we used
instead of
, just to underline that the computation of the Choquet integral of a is made by considering the parameters in the vector
.
For each , for each criterion
and for each rank position
, it is therefore possible to consider the set
composed of the sampled compatible vectors giving to a the position s w.r.t.
:
(5)
(5) The recommendations of SMAA are then given in statistical terms by computing several indices. However, in this paper, we shall use only the rank acceptability index
, being the frequency with which a takes the
position on criterion
and obtained as
(6)
(6) On the basis of the Rank Acceptability Indices, for each alternative
and for each criterion
, it is possible to compute the best and the worst positions got by a on
as well as the most frequent ones.
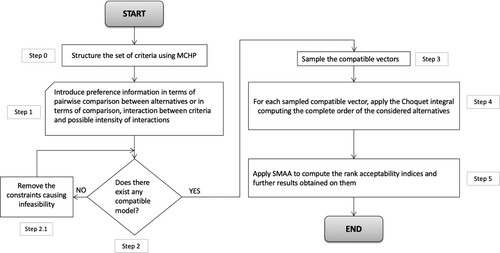
To conclude this section, we shall briefly summarize by means of the flow chart in , the main steps of the methodology that has been described and that will be applied to the Triple Helix innovation performance indicator:
Step 0: The criteria at hand are structured in a hierarchical way starting from the root until the elementary criteria;
Step 1: The DM is asked to provide her/his preference information that can be expressed in terms of comparison between alternatives, preferences between criteria, interaction between criteria, or intensity of interaction between criteria;
Step 2: Check if there exists at least one model compatible with the preferences provided by the DM by solving the LP (Equation3(3)
(3) ). If this is not the case, check for the cause of the inconsistency and remove constraints causing the feasibility (Step 2.1). If there is at least one compatible model, pass to step 3;
Step 3: Sample several models compatible with the preferences provided by the DM in Step 1;
Step 4: For each compatible model sampled in Step 3 and for each non-elementary criterion compute the Choquet integral of each alternative and, therefore, the consequent alternatives' rankings;
Step 5: Apply the SMAA methodology computing for each alternative and for each position in the ranking, the rank acceptability index. On the basis of the obtained rank acceptability indices, compute, for each alternative:
| (1) | Best and worst reachable positions, | ||||
(2) The ranking positions presenting the highest rank acceptability indices that are, consequently, the most frequent positions for that alternative, | |||||
(3) The expected ranking obtained by aggregating the different rank acceptability indices as shown in the next section. | |||||
Let us conclude this section by underlying pros and cons of the applied methodology.
As to the pros, the CII based on the MCHP-Ch-SMAA methodology is reflecting, without doubt, the preferences provided by the DM since the sampled models in which the SMAA recommendations are provided are built on the preferences given by her/him. For such reason, we think that it could be considered better than an abstract CII based on a fixed weight vector that not necessarily represent the preferences of the DM on the indicators used to study the innovation performance of each country.
As to the cons of the MCHP-Ch-SMAA, the involvement of the DM from the beginning, implies a great cognitive effort from her/his part who has to provide several information regarding comparison between indicators in terms of their importance or regarding positive or negative interactions between the same indicators. Of course, the application of a simple-weighted sum with equal weights or whichever other weight vector does not imply the same cognitive effort from the part of the DM.
Figure 2. Flow chart of the applied methodology.
4. Application and results
In this section, we develop a real-world application in order to evaluate the innovation performance of 28 countries of the EU with respect to the SII criteria structured in a hierarchical way as shown in . The description of each elementary criterion is given in .
Figure 3. Hierarchical structure framework for the EIS.
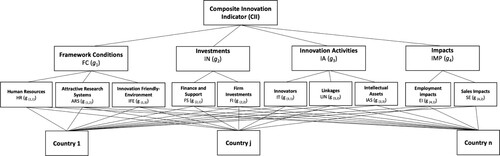
Table 1. EIS description for the elementary criteria.
This research focuses on the perception of Triple Helix agents (University, Industry and Government) about the significance of criteria involved in the SII. These agents have different profiles to determine the degree of relative importance of criteria in order to obtain a CII. To show the potential of the applied methodology, we have simulated the decision-making process in order to obtain the information about preferences from a sample of Triple Helix agents. Through a consensus-driven decision-making process, three DMs per each group agreed the preference information in the form of pairwise comparisons related to the importance and interaction of the four macro-criteria as well as for the elementary criteria. A pool of experts from different European countries with solid background in knowledge and professional experience concerning innovation has been consulted aiming at reflecting different views of the relative importance of criteria:
University Experts: academics expert in the field of innovation from the United Kingdom, technical staff of a University Technology Transfer Office from Spain, and academic expert in the field of EU innovation policies from Spain.
Industry Experts: business manager in the field of international business from Belgium, chief innovation officer from Spain, and project manager from Italy.
Government Experts : R&D program manager from Germany, the director of a Technological Institute from Spain, and deputy director of a patent and trademark office from Poland.
The university experts specified the following preference information on the considered macro-criteria:
FC and IN are more important than IA and IMP; in turn FC is equally important than IN, and IA is more important than IMP.
With respect to FC, HR and ARS are more important than IFE.
With respect to IN, FS is more important than FI.
With respect to IA, LIN is more important than IT and IAS.
With respect to IMP, EI is more important than SE.
FC and IN are positively interacting.
IN and IA are positively interacting.
IA and IMP are positively interacting.
The interaction between IN and IA is greater than the interaction between FC and IN, and between IA and IMP.
The interaction between IA and IMP is greater than the interaction between FC and IN.
With respect to FC, HR and ARS are positively interacting.
With respect to IA, IAS and LIN are positively interacting, while IAS and IT are negatively interacting.
For the industry experts, the preference information on the considered macro-criteria was:
IN is more important than IA, that in turn is more important than IMP, that in turn, is more important than FC.
With respect to FC, ARS is more important than IFE, which is more important than HR.
With respect to IN, FS is more important than FI.
With respect to IA, LIN is more important than IT, that in turn, is more important than IAS.
With respect to IMP, SE is more important than EI.
FC and IN are positively interacting.
IN and IA are positively interacting.
IA and IMP are positively interacting.
The interaction between IN and IA is greater than the interaction between FC and IN, and between IA and IMP.
The interaction between IA and IMP is greater than the interaction between FC and IN.
With respect to FC, HR and ARS are positively interacting.
With respect to IA, IAS and LIN are positively interacting, while IAS and IT are negatively interacting.
Finally, for the government experts, the preference information on the considered macro-criteria was:
IMP is more important than FC, that in turn, is more important than IN, that in turn, is more important than IA.
With respect to FC, ARS is more important than IFE, that in turn, is more important than HR.
With respect to IN, FS is more important than FI.
With respect to IA, LIN is more important than IAS, that in turn, is more important than IT.
With respect to IMP, SE is more important than EI.
FC and IN are positively interacting.
IN and IMP are positively interacting.
IA and IMP are positively interacting.
The interaction between IN and IMP is greater than the interaction between FC and IN, and IA and IMP.
The interaction between IA and IMP is greater than the interaction between FC and IN.
With respect to FC, HR and ARS are positively interacting.
With respect to IA, IAS and LIN are positively interacting, while IAS and IT are negatively interacting.
The use of the Choquet integral preference model implies that all evaluations are expressed on the same scale. For this reason, before applying it, we performed a normalization of the countries performances proposed in Greco et al. (Citation2018) and composed of the following steps:
| (1) | First step: for each elementary criterion | ||||
| (2) | Second step: for each a and for each | ||||
| (3) | Third step: for each a and for each | ||||
Sampling 10,000 models compatible with the preferences provided by the DM and applying the MCHP-Ch-SMAA approach to the Triple Helix agents at the comprehensive level and for the four macro-criteria, the rank acceptability indices for the best and worst performers as well as the three highest rank acceptability indices (most frequent positions) showing which are the most likely position for a country based on the appreciation of each actor's capabilities and needs are calculated. In , this information is provided for the case of Denmark. As one can see, with respect to industry, Denmark has the highest rank acceptability indices for the first two positions at comprehensive level as well as on Framework Conditions and Investments. Instead, the two highest rank acceptability indices are in correspondence of the 7th and 8th positions with respect to Innovation Activities and of the 12th and 11th with respect to Impacts. Analogous considerations can be drawn regarding Industry and Governments. Tables 1–3 in the supplementary material file present the results concerning the top five and the bottom three countries. The following observations can be made based on the results:
With respect to the university, the top five innovative countries are Sweden, Denmark, Finland, the Netherlands and Germany and the last three positions are for Croatia, Bulgaria and Romania. At the macro-criterion level, it is important to note that the rank position for Denmark and Finland significantly varies for the Impact dimension. Denmark reached as best position the 7th even if the rank acceptability index is basically zero (0.70%); moreover it reaches most frequently the 12th position with 45.04%. Concerning the last three countries the case of Croatia is worth pointing out, in which its position with respect to macro-criterion investments moved up to 16th position, even if its frequency is negligible (0.25%) for the best position.
With respect to the industry, Sweden, Finland, the Netherlands, United Kingdom and Denmark can be considered the most innovative countries, whereas Poland, Bulgaria and Romania are in the worst positions. From the industry perspective, in Denmark, the dimension corresponding to framework conditions is highlighted with a rank acceptability index of 98.29%. Among the last three countries, quite stable results are presented at all levels.
With respect to the government, the top five countries are Sweden, United Kingdom, Denmark, the Netherlands, and Ireland. Croatia, Bulgaria and Romania are placed at the bottom of the ranking. Regarding the last positions, while Bulgaria and Romania present the highest rank acceptability indices for the 27th and 28th position (100%), respectively, Croatia has a frequency of 22.04% of being in the 25th position. Furthermore, Croatia has risen to the 7th place in the Investments with a frequency of 0.11% and to 15th as first most frequent position with 52.91%.
Table 2. Denmark Rank Acceptability Indices, best and worst positions and three highest rank acceptability indices.
The rank position got by each country at global level as well as on the considered macro-criteria depends, of course, on the sampled Möbius parameters compatible with the preferences provided by the DM and on the consequent value assigned from the 2-additive Choquet integral to the considered country. Just to give an example, let us again consider Denmark taking into account the Industry preferences and the IN macro-criterion. As one can see in , Denmark can get as best position the 3rd and as worst the 15th. Therefore, on one hand, we computed the barycenter of the Möbius parameters for which Denmark got the 3rd position (Baryc_3) and, on the other hand, the barycenter of the Möbius parameters for which Denmark got the 15th position (Baryc_15). The barycenter is obtained by averaging the vectors of the Möbius parameters component by component and it is called central weight vector in SMAA (Lahdelma, Hokkanen, and Salminen Citation1998). The central weight vector can be considered as representative of the preferences of a typical DM giving to the considered alternative a certain rank position. Observing that the ranking of the countries at hand on IN are obtained considering only the five elementary criteria descending from it, we obtain the two barycenters shown in .
Table 3. Barycenters of the Móbius parameters vectors giving to Denmark the 3rd and the 15th positions, respectively.
Looking carefully at the values in , one can see that the Möbius values assigned to the five considered criteria and that can be interpreted as their importance, are quite different. In both barycenters is the most important among the five considered criteria, while the criteria rankings with respect to their importance is quite different. For example,
is the second most important criterion in Baryc_3, while it is the least important one in Baryc_15. Analogously,
is the least important criterion in Baryc_3, while it is the third in Baryc_15. These results can be used to desing policies. For example, the fact that
is the second most important criterion in Baryc_3 means that to maintain the third position, Denmark should develop policies aiming to maintain the Denmark's performances on this criterion together with
. Analogously, the fact that
is the second most important criterion in Baryc_15 means that if a great importance is assigned to this criterion, Denmark performs quite badly and, therefore, this can be considered as a drawback of the country. Consequently, policies aiming to improve the performances of the country on this criterion should be developed.
As explained in Kadziński and Michalski (Citation2016), the expected ranking is computed as a summary of the rank acceptability indices of each country. In the same way, the expected ranking of each country at comprehensive level is computed and results are shown in . For each , and for each criterion
in the hierarchy, the expected ranking of a on
is computed as follows:
On the basis of the values
, the countries are therefore ordered from the best to the worst on each criterion
.
Table 4. Expected ranking of countries from the Triple Helix agents at the comprehensive level and significant discrepancies with the EIS ranking.
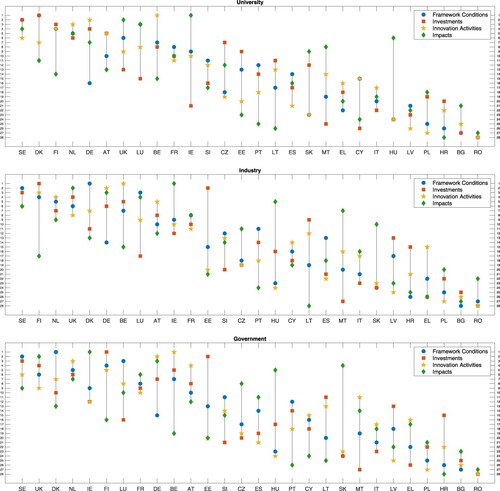
plots the expected rankings of the countries at the comprehensive level in the X-axis as well as the expected rankings at the macro-criteria level in the Y-axis per each Triple Helix actor. In this figure, top-tier countries appear on the top left-hand corner for each Triple Helix agent and also maintain leading positions at the macro-criteria level. When analysing , we should draw attention to specific countries. Looking at the comprehensive level (X-axis), for example, Finland, one of the nations in the top five, lies in the third position according to university experts, the second from the industry perspective but only sixth in the ranking of government experts. When looking at the macro-criteria level (Y-axis), we can observe that the macro-criterion Investments is the best valued and Impacts has the worst position for all the actors.
Figure 4. EU countries innovative performance expected rankings for the Triple Helix agents.
To better understand the potentialities of the MCHP-Ch-SMAA approach, in , we reported also the global country ranking provided by the EIS. Looking at the results, it seems there is a consensus among the Triple Helix agents and the EIS that Sweden is the most innovative country while Bulgaria and Romania get the worst positions in all rankings. There is a small difference in the positions of Belgium, Czech Republic, Spain, Croatia, Italy, Latvia, Luxembourg, Netherlands, Poland, and Slovenia. However, there is a significant deviation of at least three ranking positions in Denmark, Germany, Estonia, Ireland, Greece, France, Cyprus, Lithuania, Hungary, Malta, Austria, Portugal, Slovakia, Finland, and United Kingdom.
The complete results of the application of the MCHP-Ch-SMAA approach to the 28 countries at the comprehensive level and to the four macro-criteria for the interested reader can be downloaded by clicking on the following link: complete results.
5. Concluding remarks and future research
Promoting innovation is considered a key policy instrument to enhance competitiveness. To this end, it is also important to monitor national innovation performances. Recent approaches for assessing the innovation of countries have adopted composite indicators. The main contribution we are giving in this paper, is the consideration of interaction between elementary indicators in the construction of the composite indicators. This is very important for innovation. Indeed, as stated by the most important theories in this domain, the active involvement of firms, universities and public sector, is fundamental and a distinctive feature in the innovation field. In this context, it is clear that this cooperation can lead to interaction between dimensions. Therefore we believe that the proposal of a composite indicator taking into account interaction between criteria is specifically beneficial for the domain of innovation.
This approach provides a more in-depth analysis of the countries innovation performance at the comprehensive level and for the specific macro-criterion incorporating the Triple Helix framework perspective. This proposal can be a valuable tool for innovation policy makers and practitioners to first, identify the strengths and weaknesses of their respective national innovation systems and, thus, second to design, deploy and develop specific policies and practices accordingly.
As established in this paper, there is a large body of literature on the construction of CIIs and several different methods to construct them. The nuances within these various methods impact the results and aggregated rankings. The method presented in this paper ‘embraces’ this diversity as it permits the stakeholders to choose themselves the indicators that count the most in the construction of the CII. This allows, for example, academics at universities interested in increasing scientific collaboration, business managers who want to explore potential market opportunities and public sector managers concerned with developing collaborative relationships in the field of innovation to benefit from implementing this approach in practice.
In our research, we are assuming that a group of experts for each group of the Triple Helix agree on the preference information that we are listing, a further direction of research could be to investigate how integrate the preferences of several experts in the decision-making process. Moreover, while we are confident that the considered approach can also be applied to other domains (besides the measurement of innovation performance) where composite indicators are used, we acknowledge that further systematical comparisons between the EIS methodology discussed in this paper and other frameworks are still needed to validate the feasibility of our approach beyond the case presented here. In the future we plan to investigate if and how the Multidimensional Item Response Theory (Reckase Citation2009) could be applied to infer the parameters of our model in an objective way. Further research would also benefit from testing the applicability of the outranking approach in the aggregation stage of composite indicators by adopting ELECTRE and PROMETHEE methods to overcome the limitations related to the ‘compensability’ between criteria (Greco et al. Citation2021).
Let us conclude with some final reflections on the methodology that we adopted to construct composite indicators. Our basic assumption was that, to be fully meaningful and sensible, composite innovation indicators need to take into account some fundamental aspects being the interaction between elementary indicators, the hierarchical structure of indicators, the robustness concerns related to the consideration of a range of variation in the adopted weights, the involvement of a set of stakeholders that can focus their attention on different criteria. These aspects are for sure relevant for composite innovation indicators, as we have tried to show in this paper. However, these aspects are relevant practically in any domain in which composite indicators can be applied, from sustainable development to university ranking and healthcare systems. In this perspective, the methodology presented in this paper has relevance for the whole domain of composite indicators that, to provide a realistic representation of considered phenomena, cannot abstract from the premises on which our approach is based.
Supplemental Material
Download PDF (106 KB)Acknowledgements
Salvatore Corrente and Salvatore Greco acknowledge: Ministero dell'Istruzione, dell'Universitá e della Ricerca (MIUR) – PRIN 2017, project “Multiple Criteria Decision Analysis and Multiple Criteria Decision Theory”.
Disclosure statement
No potential conflict of interest was reported by the author(s).
References
- Adam, F. 2014. Measuring National Innovation Performance: the Innovation Union Scoreboard Revisited. Berlin: Springer.
- Angilella, S., P. Catalfo, S. Corrente, G. Giarlotta, S. Greco, and M. Rizzo. 2018. “Robust Sustainable Development Assessment with Composite Indices Aggregating Interacting Dimensions: the Hierarchical-SMAA-Choquet Integral Approach.” Knowledge-Based Systems 158: 136–153.
- Angilella, S., S. Corrente, S. Greco, and R. Słowiński. 2016. “Robust Ordinal Regression and Stochastic Multiobjective Acceptability Analysis in Multiple Criteria Hierarchy Process for the Choquet Integral Preference Model.” Omega 63: 154–169.
- Carayannis, E. G., Y. Goletsis, and E. Grigoroudis. 2018. “Composite Innovation Metrics: MCDA and the Quadruple Innovation Helix Framework.” Technological Forecasting and Social Change 44(2) 131: 4–17.
- Cherchye, L., W. Moesen, N. Rogge, T. Van Puyenbroeck, M. Saisana, A. Saltelli, R. Liska, and S. Tarantola. 2008. “Creating Composite Indicators with DEA and Robustness Analysis: the Case of the Technology Achievement Index.” Journal of the Operational Research Society 59 (2): 239–251.
- Choquet, G.. 1953. “Theory of Capacities.” Annales De L'institut Fourier 5: 131–295.
- Corrente, S., S. Greco, M. Nicotra, M. Romano, and C. E. Schillaci. 2019. “Evaluating and Comparing Entrepreneurial Ecosystems Using SMAA and SMAA-S.” The Journal of Technology Transfer 44: 485–519.
- Corrente, S., S. Greco, and R. Słowiński. 2012. “Multiple Criteria Hierarchy Process in Robust Ordinal Regression.” Decision Support Systems 53 (3): 660–674.
- Corrente, S., S. Greco, and R. Słowiński. 2019. “Robust Ranking of Universities Evaluated by Hierarchical and Interacting Criteria.” In Multiple Criteria Decision Making and Aiding. International Series in Operations Research & Management Science, edited by S. Huber, M. Geiger, and A. de Almeida, chapter 5, 145–192. Cham: Springer.
- Dutta, S., B. Lanvin, and S. Wunsch-Vincent. 2019. The Global Innovation Index 2018: Energizing the World with Innovation. 11th ed. Cornell University, INSEAD, and WIPO.
- Edquist, C., and J. M. Zabala. 2015. The Innovation Union Scoreboard Is Flawed: The Case of Sweden–Not Being the Innovation Leader of the EU. Lund: CIRCLE.
- El Gibari, S., T. Gómez, and F. Ruiz. 2019. “Building Composite Indicators Using Multicriteria Methods: A Review.” Journal of Business Economics 89 (1): 1–24.
- Etzkowitz, H., and L. Leydesdorff. 2000. “The Dynamics of Innovation: From National Systems and “Mode 2” to a Triple Helix of University–industry–government Relations.” Research Policy 29 (2): 109–123.
- Furman, J. L., M. E. Porter, and S. Stern. 2002. “The Determinants of National Innovative Capacity.” Research Policy 31 (6): 899–933.
- Garcia-Bernabeu, A., J. M. Cabello, and F. Ruiz. 2020. “A Multi-Criteria Reference Point Based Approach for Assessing Regional Innovation Performance in Spain.” Mathematics 8 (5): 797.
- Grabisch, M. 1996. “The Application of Fuzzy Integrals in Multicriteria Decision Making.” European Journal of Operational Research 89 (3): 445–456.
- Grabisch, M. 1997. “k-order Additive Discrete Fuzzy Measures and Their Representation.” Fuzzy Sets and Systems 92 (2): 167–189.
- Greco, S., M. Ehrgott, and J. R. Figueira. 2016. Multiple Criteria Decision Analysis: State of the Art Surveys. New York: Springer.
- Greco, S., A. Ishizaka, B. Matarazzo, and G. Torrisi. 2018. “Stochastic Multi-attribute Acceptability Analysis (SMAA): An Application to the Ranking of Italian Regions.” Regional Studies 52 (4): 585–600.
- Greco, S., A. Ishizaka, M. Tasiou, and G. Torrisi. 2019a. “On the Methodological Framework of Composite Indices: A Review of the Issues of Weighting, Aggregation, and Robustness.” Social Indicators Research 141: 61–94.
- Greco, S., A. Ishizaka, M. Tasiou, and G. Torrisi. 2019b. “Sigma-Mu Efficiency Analysis: A Methodology for Evaluating Units Through Composite Indicators.” European Journal of Operational Research 278 (3): 942–960.
- Greco, S., A. Ishizaka, M. Tasiou, and G. Torrisi. 2021. “The Ordinal Input for Cardinal Output Approach of Non-compensatory Composite Indicators: The PROMETHEE Scoring Method.” European Journal of Operational Research 288 (1): 225–246.
- Griliches, Z. 1984. R&D, Patents and Productivity. Chicago: University of Chicago Press.
- Grupp, H., and M. E. Mogee. 2004. “Indicators for National Science and Technology Policy: How Robust are Composite Indicators?” Research Policy 33 (9): 1373–1384.
- Grupp, H., and T. Schubert. 2010. “Review and New Evidence on Composite Innovation Indicators for Evaluating National Performance.” Research Policy 39 (1): 67–78.
- Hauser, C., M. Siller, T. Schatzer, J. Walde, and G. Tappeiner. 2018. “Measuring Regional Innovation: A Critical Inspection of the Ability of Single Indicators to Shape Technological Change.” Technological Forecasting and Social Change 129: 43–55.
- Holgersson, T., and O. Kekezi. 2018. “Towards a Multivariate Innovation Index.” Economics of Innovation and New Technology 27 (3): 254–272.
- Hollanders, H., and N. Es-Sadki. 2017. European Innovation Scoreboard 2017: Methodology Report. Brussels: European Commission.
- Hollanders, H., and N. Es-Sadki. 2019. Regional Innovation Scoreboard: Methodology Report. Brussels: European Commission.
- Hollanders, H., N. Es-Sadki, and M. Kanerva. 2016. European Innovation Scoreboard 2016. Brussels: European Commission.
- Hollenstein, H. 1996. “A Composite Indicator of a Firm's Innovativeness: An Empirical Analysis Based on Survey Data for Swiss Manufacturing.” Research Policy 25 (4): 633–645.
- Kadziński, M., and M. Michalski. 2016. “Scoring Procedures for Multiple Criteria Decision Aiding with Robust and Stochastic Ordinal Regression.” Computers & Operations Research 71: 54–70.
- Keeney, R. L., and H. Raiffa. 1976. Decisions with Multiple Objectives: Preferences and Value Tradeoffs. New York (NY): Wiley.
- Kozłowski, J. 2015. “Innovation Indices: The Need for Positioning them Where they Properly Belong.” Scientometrics 104 (3): 609–628.
- Lahdelma, R., J. Hokkanen, and P. Salminen. 1998. “SMAA-stochastic Multiobjective Acceptability Analysis.” European Journal of Operational Research 106 (1): 137–143.
- Leydesdorff, L., and H. Etzkowitz. 1998. “The Triple Helix As a Model for Innovation Studies.” Science and Public Policy 25 (3): 195–203.
- Lundvall, B.-Å. 2010. National Systems of Innovation: Toward a Theory of Innovation and Interactive Learning. Vol. 2. London: Anthem Press.
- Makkonen, T., and R. P. van der Have. 2013. “Benchmarking Regional Innovative Performance: Composite Measures and Direct Innovation Counts.” Scientometrics 94 (1): 247–262.
- Mayag, B., M. Grabisch, and C. Labreuche. 2011. “A Representation of Preferences by the Choquet Integral with Respect to a 2-Additive Capacity.” Theory and Decision 71 (3): 297–324.
- Moore, J. F. 1993. “Predators and Prey: A New Ecology of Competition.” Harvard Business Review 71 (3): 75–86.
- Mousseau, V., J. R. Figueira, L. Dias, C. Gomes da Silva, and J. Climaco. 2003. “Resolving Inconsistencies Among Constraints on the Parameters of An MCDA Model.” European Journal of Operational Research147 (1): 72–93.
- Murofushi, T., and S. Soneda. 1993. Techniques for Reading Fuzzy Measures (iii): Interaction Index. In 9th Fuzzy System Symposium, 693–696.
- OECD/Eurostat. Oslo Manual. 2018. Guidelines for Collecting, Reporting and Using Data on Innovation, 4th Edition, The Measurement of Scientific, Technological and Innovation Activities, OECD Publishing. Paris/Eurostat, Luxembourg..
- Porter, M. E., and S. Stern. 2001. National Innovative Capacity. The Global Competitiveness Report, 2002:102–118.
- Reckase, M. D. 2009. Multidimensional Item Response Theory. New York: Springer.
- Rota, G. 1964. “On the Foundations of Combinatorial Theory I. Theory of Möbius Functions.” Zeitschrift für Wahrscheinlichkeitstheorie und Verwandte Gebiete 2 (4): 340–368.
- Schibany, A., and G. Streicher. 2008. “The European Innovation Scoreboard: Drowning by Numbers?” Science and Public Policy 35 (10): 717–732.
- Schmookler, J. 1950. “The Interpretation of Patent Statistics.” Journal of the Patent Office Society 32 (2): 123–146.
- Shapley, L. S. 1953. “A Value for n-person Games.” In Contributions to the Theory of Games. Vol. II, edited by H. W. Kuhn and A. W. Tucker, 307–317. Princeton: Princeton University Press.
- Tervonen, T., and R. Lahdelma. 2007. “Implementing Stochastic Multicriteria Acceptability Analysis.” European Journal of Operational Research 178 (2): 500–513.