
 ?Mathematical formulae have been encoded as MathML and are displayed in this HTML version using MathJax in order to improve their display. Uncheck the box to turn MathJax off. This feature requires Javascript. Click on a formula to zoom.
ABSTRACT
Police activity on social media has emerged as a significant and expanding area of research. However, the existing body of research has predominantly adopted qualitative methods or focused on small-scale samples for quantitative analysis. This study presents a novel approach to analysing police social media behaviours, employing automated classification methods to generate a substantial sample of categorised police tweets. Encompassing over 40,000 tweets from five United Kingdom forces, collected over a three-year period, this dataset represents one of the largest evaluated samples in the domain of police social media research. A core objective of this research is to investigate the extent to which police tweeting behaviours align with three common categories identified in the literature: providing information, engagement, and intelligence gathering. To achieve this, a two-pronged methodology is employed, combining manual content analysis and an applied automated classification approach. This comprehensive method aims to create a sample of classified police tweets, effectively representing their diverse tweeting behaviours. The classicisation process involves the training and testing of three automated models, namely naïve Bayes, logistic regression, and XGBoost, evaluating the accuracy of their results to ensure a robust and reliable classification outcome. Furthermore, the resulting sample is subject to additional in-depth analyses. The exploration encompasses various facets of tweet content, style, overall usage, and adaptability across different police forces. Additionally, the research considers public interactions with the police tweets. These analyses are conducted for each force and class, thereby establishing connections between social media interactions and their potential impact on highlighted agendas.
Introduction
Police forces have embraced social media as ‘communication machines’ (Wright Citation2001), using it to complement, develop, and correct traditional media (Ralph Citation2021), promote community relations (Huang and Wu Citation2018), and establish vital online police presences as important as walking on the beat. Their goals include building legitimacy (Mawby Citation2002, Grimmelikhuijsen and Meijer Citation2015), trustworthiness (Warren et al. Citation2014), transparency (Bullock Citation2018, Mayes Citation2021), and managing public relations (Rosenbaum Citation2011, Lee and McGovern Citation2013). Moreover, police social media enables engagement with hard-to-reach or antagonistic groups who may be otherwise uninterested (Police Foundation Citation2014, Grimmelikhuijsen and Meijer Citation2015). This extended reach of police visibility underscores its importance of social media as a primary platform for community perceptions to be formed. Given the intended use cases of social media in policing, it becomes crucial to understand how forces are utilising these online accounts, assessing their use and impact (Mayes Citation2021).
In the past decade, there has been an increased research focus on various police social media approaches, with studies conducted in different countries. For example, in the United Kingdom (U.K.), research has explored police engagement with social media, missing persons reporting, and tweeting during riots (Crump Citation2011, Denef et al. Citation2013, Solymosi et al. Citation2020). Similarly, the United States has been at the forefront of police social media strategy research, analysing Twitter for crisis communication and community policing (Fowler Citation2017, Williams Citation2018). In the Netherlands, studies have emerged on message diffusion and the bureaucratisation of social media usage by the Dutch police (van de Velde et al. Citation2015, Meijer and Torenvlied Citation2016). Canada has also contributed influential research discussing community building and image work (O’Connor Citation2017, Kudla and Parnaby Citation2018). Moreover, research beyond the Western context includes qualitative studies on social media and police-citizen relations in Nigeria (Odeyemi and Obiyan Citation2018) and an exploration of Kenyan police social media usage (Dwyer Citation2020). Despite these diverse studies, there has been a lack of large-scale analysis of police tweeting behaviour. Previous methodologies have been qualitative or limited to manual coding and classification, providing depth but lacking a broad perspective due to restricted sample sizes. Assumptions related to police social media usage remain untested on larger samples that account for changes in strategy over extended periods. Additionally, the impact of such strategies is challenging to measure effectively when results are drawn from samples frequently relevant to only one specific police force or period potentially influenced by changing reputations and perceptions.
This research endeavours to address the existing gap by focusing on three primary police tweeting styles commonly identified in smaller-scale studies within the literature: providing information, engaging with the public (engagement), and intelligence gathering. A large sample of police tweets from five different forces will be used to attempt an automated classification into these categories. The aim is to determine whether this categorisation remains effective when applied to tweets from diverse forces over extended periods. Given the novelty of applying automated classification to police tweets, thorough exploration and analysis of the results will be conducted. The outcomes of the automated classification will contribute to a comprehensive understanding of policing strategies. This analysis will begin by examining the consistency in content and use of these tweet categories to gain insights into how different police forces prioritise them, and thereby link them to traditional policing strategies (further discussed in the Literary context). Subsequently, the tweet metrics of these categories will be assessed to understand how variations in strategy and prioritisation impact interaction. Finally, a detailed investigation of tweet attributes will provide insights into what factors can lead to successful interaction. This information will help inform police forces when researching effective social media strategies for each category, aligning with the desired agenda of the given category.
Background
Prior to delving into the investigation of police use of Twitter, the relevant research concerning this topic, and the specific categories of police tweeting behaviour, a concise background will be provided on Twitter as a social media platform and its interaction with U.K. law enforcement.
Twitter, established in 2006, is a micro-blogging platform enabling users to post instant messages, known as ‘tweets’, to their profiles and followers’ feeds within a limit of 280 characters (previously 140 until November 2017). The U.K. ranks sixth globally in Twitter usage, boasting 18.4 million users as of January 2022 (Statista Research Department Citation2022). Twitter users can interact with tweets by liking, retweeting (sharing to their followers’ feeds), or quote tweeting (sharing with comments). Interaction with other users is possible by mentioning their Twitter ‘handle’ in a tweet (Honeycutt and Herring Citation2009), and topical linking of tweets is facilitated by using the ‘#’ symbol before an unbroken word or phrase (Boyd et al. Citation2010). Tweets can also include weblinks, images, videos, and emojis. Twitter profiles are public by default, enabling conversation engagement among accounts without requiring reciprocal ‘follow’ or ‘friendship’ connections, fostering unique interactivity in how easily and readily users who may not know each other otherwise can communicate (Lovejoy et al. Citation2012). This promoted conversational environment creates the perfect space for official organisations to reach large audiences efficiently with minimal resources (Williams Citation2018). As a result of this, Twitter has emerged as a central platform for sharing news and information, often preceding or complementing mainstream media (Schneider Citation2016, Nikolovska et al. Citation2020). This makes it a suitable social media platform for police to integrate into their strategies, enabling them to engage with the public by disseminating information and receiving feedback (Schneider Citation2016). It should be noted that Twitter has been rebranded as 'X' since this research was conducted, meaning that some terms in this paper are no longer accurate (for example, 'tweeting' is now 'posting'). However, the main features and uses of the app remain the same.
The police on Twitter
In the U.K., police forces began integrating social media into their strategies since 2008, with Twitter becoming one of the most common platforms used (Bullock Citation2018). Presently, all police forces in England and Wales have Twitter accounts (Police Foundation Citation2014). Described as ‘masters of social media’ by Johnston and McGovern (Citation2013, p. 1679), police effectively utilise their accounts and gain significant followings. Twitter allows police to foster public engagement, seek support for police activities, and disseminate information rapidly and directly (Beshears et al. Citation2019, Ralph Citation2021). Simultaneously, the public benefits by staying informed about police activity, engaging in public safety discussions, and actively participating in police matters (van de Velde et al. Citation2015).
Twitter is widely used by U.K. police forces, but there is no national strategy or protocol governing their usage. Local and regional forces have the discretion to determine their own posting practices, leading to variation in tweeting styles both between and within forces (Police Foundation Citation2014). Some national guidance exists, such as the ACPO publication ‘Guidelines on the Safe use of the Internet and Social Media by Police Officers and Police Staff’ (Lawson Citation2013). However, it is not specific enough to standardise usage across all forces, resulting in differentiation based on followers and community demographic factors, such as age, education, interests, or political beliefs (Ruddell and Jones Citation2013). Consequently, a significant portion of police activity on Twitter remains unaddressed regardless of the fact that data is readily available and accessible, escaping the scrutiny of mainstream policing research due to the rapid and extensive growth of usage.
Literary context
This research introduces a novel methodological approach to classifying police tweeting behaviour, aiming to gain a deeper understanding of police use of social media and its effectiveness. Therefore, a literary background for the research is necessary, first reviewing studies on police social media usage, outlining the goals pursued by police. These goals will be categorised into three distinct categories, each with defined objectives and indicators of success. Finally, the review will identify gaps in existing studies, highlighting the potential contributions of this research.
What are the police using Twitter for?
Research has shown that while official uses of Twitter by police may not be standardised nationally, there are clear purposes for their engagement on the platform. Social media provides an opportunity for police to shape their image independently of first-hand experiences. By leveraging the wide reach and integral role of social media in modern society, police can rapidly and inexpensively disseminate their force's image, engaging with groups who may not otherwise encounter the police. This strategic use of social media enables government agencies to build trust (Porumbescu Citation2016) and legitimacy (Johnston and McGovern Citation2013), building their image and shaping public perception. This in turn reinforces a commitment to community-oriented policing strategies aimed at building relationships to reduce crime (Mayes Citation2021) and dialogue policing focused on fostering two-way communication (Hofmann Citation2013). This becomes particularly valuable after highly politicised events, especially those involving police behaviour which can strain public-police relations (Denef et al. Citation2013). In such times, police must make efforts to mend their reputation and relationship with the public, emphasising the critical role of social media as a platform for reputation management (Anderson and Hitlin Citation2016).
Police also utilise social media to disseminate information, aiming to create an informed public perception of the police as vigilant and up-to-date. This approach proves particularly beneficial in high-risk or crisis situations, such as the U.K. 2011 riots (Procter Citation2013), terrorist attacks like the 2014 Boston Bombings (Davis et al. Citation2014), and protests like the 2009 G20 event in Pennsylvania (Earl et al. Citation2013). This type of one-way social media usage can be useful in these settings (Waters and Williams Citation2011), aligning with reassurance policing to demonstrate that the police are doing their job (Fielding and Innes Citation2006). Additionally, social media serves as a valuable tool for police to aid in crime-solving efforts, such as searching for witnesses, identifying suspects, and sharing information on missing persons and appeals (Solymosi et al. Citation2020). This usage signifies a commitment to intelligence-led policing, effectively addressing one of the core functions of law enforcement – crime resolution. Consequently, by employing social media in these ways, police can achieve conventional policing objectives through a modern and immediate approach.
Categorising police tweeting behaviours
The above goals can be divided into three overarching categories of police tweeting behaviour: engagement, providing information, and intelligence gathering. These categories have been explicitly referenced in various academic studies (Heverin and Zach Citation2010, Lieberman et al. Citation2013, Meijer and Thaens Citation2013, Huang and Wu Citation2018, Kudla and Parnaby Citation2018, Walsh Citation2020, Mayes Citation2021), and their features are solidified in Police Foundation's 2014 briefing on ‘Police use of social media’ (Police Foundation Citation2014). Each category represents distinct styles and goals, forming a solid basis for automated classification. The engagement category comprises tweets aimed at building trust and legitimacy through community-oriented interactions (Warren et al. Citation2014). These tweets leverage social media's potential for two-way relationship building, presenting a more accessible and ‘human’ side of the police (Beshears Citation2016) with informal language and humour (Ralph Citation2021) which helps create an image of decentralised social media usage (Meijer and Torenvlied Citation2016). Examples include substantive two-way conversations with the public, tweets of a personal nature such as discussing individual officers or thanking the public, and engagement with light-hearted trends or hashtags.
The second category, providing information, involves one-way communication where police share various topics such as crimes, patrol activities, traffic updates, meetings, events, and safety notices (Brainard and McNutt Citation2010, Lieberman et al. Citation2013, Schneider Citation2016, Bullock Citation2018). This allows for instant and cost-effective dissemination of information beyond traditional media like news, radio, or leaflets. Examples include notifying the public of road closures or reminding followers to follow COVID-19 safety protocols, like wearing masks on public transport. The final category concerns crime-solving and intelligence gathering, characterised by tweets seeking information on crimes, suspects, or missing persons. Research has demonstrated the effectiveness of such tweets in locating missing persons (Tsoi Citation2018), underscoring their significance for police utilisation.
The benefits of the three categories are evident; however, literature suggests that police forces do not equally prioritise them (Brainard and Edlins Citation2015), and this prioritisation can vary between forces (Denef et al. Citation2013). The prioritisation of these categories reflects the agenda set by each force, as such ‘social media offers local police departments many opportunities to set the agenda on issues that affect their ability to serve the community, whether that agenda aims to establish credibility or trust, to communicate important public safety information, or to source information from recipients of a message’ (Williams Citation2018, p. 213). Understanding how police employ these categories or agendas allows for measuring their effectiveness, enabling informed police social media strategies. The subsequent section outlines studies that have acknowledged and used this categorisation, laying the groundwork for this study's unique contribution through novel data collection and classification methods.
Related work
Prior studies have attempted to classify tweets into the aforementioned categories, but, to the author’s knowledge, all have done so manually on small to mid-range sample sizes. Denef et al. hand classify tweets by content, function, and style to compare police Twitter usage in the U.K. 2011 riots (2013), concluding that forces differ in their tweet styles for a given class. Meijer and Thaens classify the tweeting behaviours of three United States police forces through interviews, and content and document analysis (2013), to discover that forces prioritise classes differently. A two-tier manual classification method is utilised by Huang and Wu to investigate different tweeting behaviours between forces (2018), which concludes that certain tweet styles will be interacted with differently by the public. Additionally, some studies have isolated one of the three categories and focussed solely on its use and impact, such as explorations of public interaction with intelligence gathering tweets (Solymosi et al. Citation2020), or analysing three months of tweets to understand the two-way engagement strategies undertaken by five police forces (Williams Citation2018). These studies offer a solid foundation for this research, affirming the relevance of tweet categorisation to analyse police tweeting agendas and justifying the evaluation of these three categories. Comparative studies suggest that understanding how forces use these categories can provide insights into their policing agenda. However, all of these studies are limited by snapshot samples due to practical constraints of manual coding. Therefore, this research will build on the above literature, providing a new lens through which to analyse police tweeting behaviours.
Proposed research questions
Automated tweet classification brings multiple advancements to this area of research. Larger sample sizes can encompass multiple police forces over extended periods, providing a comprehensive view of actual tweeting behaviours rather than a potentially biased snapshot of tweets in a particular period. This allows for a deeper understanding of how police forces use tweets to fulfil their agendas, prioritise and enact these agendas, and how the public engages with their choices. By addressing four research questions, this study aims to leverage the advantages of a larger sample size to gain new insights into police social media usage.
RQ1: Are the three identified categories of police tweeting behaviour from the literature suitable?
The current understanding of the suitability of these categories is based on small to mid-range samples, raising uncertainty about their representation in a broader context.
RQ2: Does the use of these categories vary among police forces in terms of content, adaptability, and absolute use?
Larger sample sizes allow exploration of variation in tweeting habits between forces, examining differences in prioritisation, styles, and usage over time.
RQ3: How does the public interact with these categories?
Metric counts will gauge public reactions to the categories, providing insights into their impact which is possible across multiple forces due to the larger sample.
RQ4: Are there specific tweet attributes linked to increased public interaction?
Analysing positive interactions with tweet classes will identify attributes that lead to successful engagement, informing police social media strategies in terms of their agenda.
Data and methods
This research aims to gain deeper insights into the practical usage of social media by police forces and identify effective tweet strategies for achieving specific agendas by classifying and analysing a substantial sample of police tweets. The processes of data collection, cleaning, and analysis will be presented to provide necessary context for the obtained analytical results and conclusions. As novel methodologies are introduced in this study, it is essential to elucidate and justify these methodological processes, recognising their potential impact on the research outcomes and conclusions.
Data
The original data for this study comprises all tweets (n = 61,056) from five police forces spanning three years (1st January 2019 to 1st January 2022). This timeframe was selected for its relevance to current policing strategies on Twitter, as well as the fact it includes significant events which have impacted policing strategy and perceptions such as the COVID-19 pandemic and policing-related protests. The five chosen forces – West Yorkshire Police (WYP), Avon and Somerset Police (ASP), Greater Manchester Police (GMP), West Midlands Police (WMP), and the Metropolitan Police Service (MET) – represent some of England's largest forces (Clark Citation2022), operating in cities with notable police activity and public attention (for example, London, Bristol, and Manchester). Therefore, the sample should contain a diverse range of tweets, capturing any changes in response or approach.
Data extraction
All tweets were obtained using Twitter's Application Programming Interface (API) with academic research access, which allowed for the extraction of up to 10 million tweets per month. The R package academictwitteR (Barrie and Ho Citation2021) and the ‘get_all_tweets’ function were employed to extract tweets from specified accounts between set dates. The dataset included retweets, replies, likes, and quotes for each tweet. It also provided a column with an ‘author ID’, a unique identifier of the author’s account, and a ‘reply ID’, a unique identifier of the account replied to if the tweet was a reply. All tweets which were retweets were prefixed with ‘RT’, which helped derive the tweet type in the cleaning process. Notably, since the data collection for this research, Twitter has discontinued free academic access, making this sample one of the last freely accessible collections of police tweets.
Data processing
In this stage, the aim was to extract useful information from the dataset and condense tweets to their essential form for analysis. A new column called ‘tweet_type’ was added to categorise tweets into replies, tweets, and retweets. During this process, tweets were categorised based on their content. Those starting with ‘RT’ were categorised as retweets, and for replies, the reply ID was cross-referenced with the author ID. If the reply ID matched the author ID, indicating a self-reply, it was coded as a tweet rather than a reply, as the author was replying to themselves (in other words, creating a ‘thread’ or series of tweets). All other tweets that were neither retweets nor replies were also classified as tweets. Retweets were discarded, resulting in a sample of 43,435 tweets. A new column ‘base_text’ was created to contain the tweet text without ‘RT’ strings, URLs, or emojis, achieved using string matching and regular expressions. Blank tweets and replies were dropped, reducing the sample to 43,191. A Python function was developed using the spaCy package (Honnibal Citation2020) for further pre-processing. The function followed a pipeline of tokenising, removing stop words, punctuation, spaces, or irregular characters, and lemmatising the tokens. The tokenizer included an additional ‘merge_entities’ pipe to group named entities together as one token, preserving phrases like ‘West Yorkshire Police’ as a whole entity.
Sample overview
The sample consisted of five police force Twitter accounts: MET (@metpoliceuk) with 1.3 million followers, GMP (@gmpolice) with 600,000, WMP (@WMPolice) with 500,000, WYP (@WestYorksPolice) with 220,000 followers, and ASP (@ASPolice) with 180,000. This does not directly correspond to the size of the forces, as WMP is larger than GMP. The accounts’ creation dates are as follows: WMP (December 2008), GMP and WYP (February 2009), ASP (March 2009), and MET (August 2009). provides a summary of their general activity across the three-year period.
Table 1. Tweeting behaviours per force.
The extracted data included retweets, but they were not included in the sample as they are not directly written by police accounts. However, they provide a thorough picture of overall activity. ASP, GMP, and MET tweeted similar amounts, and WMP tweeted at a similar rate but retweeted significantly more. WYP had the largest number of tweets among all five forces, even though they retweeted the least. The MET and WYP tweeted replies much less than the other forces, with the MET having the lowest number of replies in a three-year period (42), while ASP replied the most (3123).
Methodological approach
This paper will clearly define the methodological approach used for tweet classification and analysis of the sample. It will not only provide technical details of the methods but also explain how these approaches will be employed to address each of the four research questions.
Classification
The tweet classification process involved two main steps: manual content analysis of a subset of tweets to determine their fit into three categories, and the identification of an appropriate automated classification method. This process addressed RQ1, aiming to categorise a larger sample of police tweets into the categories of providing information, engagement, and intelligence gathering. Broader categories were chosen for practicality and alignment with existing literature. Using more categories would have required more hand-classified training data, which wasn't feasible for this project. However, any additional categories would have been sub-categories of the current three, and so not including them did not undermine the value of this distinct classification. Classifying tweets presented challenges due to their brevity, lack of symmetrical format, diverse topics, and inclusion of unstructured text like URLs, hashtags, emojis, and images (Tao Citation2013). Supervised machine learning, specifically in the form of logistic regression, Naïve Bayes, and XGBoost, were used and compared as an appropriate means to facilitate this tweet classification (Finch and Schneider Citation2007, Jurafsky and Martin Citation2021, Edgari et al. Citation2022).
To address the initial stage of the classification process, an overview of the 43,191 text-based tweets in the sample was needed. Creating a descriptive plot for such a vast amount of information proved challenging. Therefore, an interactive Bokeh plot was used to embed the tweets in a two-dimensional space based on their content similarity (Bokeh Development Team Citation2018). This scatter plot allowed for exploration by revealing dense clusters containing duplicate tweets (6,104 duplicates of 1,439 tweets – or 7,543 total duplicates). Unique duplicates (1,439) were hand-coded, and a new variable called ‘tweet_form’ was created to indicate whether a tweet was a duplicate. To gain a deeper understanding of the tweet content and create hand-labelled test and training data, 8,912 tweets (one-quarter of the remaining sample) were randomly extracted for analysis. This subsample was distributed evenly among police forces: WMP (22%), GMP (21%), ASP (20%), MET (19%), and WYP (18%). Analysing the content of this subsample was essential to determine if the tweets could be classified into the three categories and identify distinct language patterns for differentiation. Through multiple iterations, the first 1,000 tweets were assessed to assign them to one, multiple, or no classes. This process involved noting language and style patterns to create a reference list for tweet types per class. It allowed for learning and adapting to the data and understanding how tweets associated with each class. The findings from this content analysis laid the groundwork for hand classifying the remaining subset.
In the second stage of the classification process, multiple models were trained to find the most suitable for classifying tweets into three categories. To evaluate model performance, the hand-classified data was split into test and training sets (25% and 75% respectively) to prevent overfitting (Hamoud et al. Citation2018). The models tested were naïve Bayes, logistic regression, and XGBoost classifiers, utilising TF-IDF and embedding-based vectorizers. Each model learns text features and patterns differently, based on numerical representations (word vectors) of the text. Naïve Bayes calculates word probabilities of occurrence in a tweet:
where P(Class | Document) represents the probability that that the document (tweet) belongs to the specific class (category). P(Class) is the overall probability of any tweet belonging to a given category, P(Document | Class) is the probability of observing the tweet given that it belongs to the specific category, and P(Document) is the probability of the tweet appearing regardless of the category (Abascal-Mena and Lopez-Ornelas Citation2020). Logistic regression classifiers model the log odds of a tweet belonging to a specific class:
where
is the probability that the tweet belongs to a given class, the Document is the feature vector representing the tweet, and z is the linear combination of the feature vector and the regression coefficient weights which represent the importance of each of the feature values within the vector (Beitia-Antero et al. Citation2018):
Finally, XGBoost uses a decision tree algorithm to combine models for final predictions:
where
is the probability that a tweet belongs to a given class and
is the sum of the weighted predictions for multiple decision trees in the model for the given tweet (Costache et al. Citation2021). TF-IDF maps words to representative numbers for each tweet (Hamoud et al. Citation2018), while word embeddings are deep learning representations where similar words have similar vector representations (Brownlee Citation2019). Therefore, it was important to measure performance on all combinations of models and vectors as their differing processes can produce different results.
Classification performance was measured and compared using k-fold cross-validation to calculate accuracy scores, preventing overfitting and biased results (Liu Citation2011). Accuracy was the only performance metric used, as it is most relevant in this case. Accuracy measures the correct classification rate across all tweets:
and is suitable when each class is equally important and the dataset is balanced with no minority classes (Davis and Goadrich Citation2006). This holds true in this research, as classifying an engagement tweet correctly is equally important as classifying an intelligence gathering tweet, and the training data was balanced per class after hand-classification.
Exploratory analysis
The second stage of the methodological approach involved an exploratory analysis of the tweets post-classification. It aimed to provide further insights into police social media usage addressing RQ2, RQ3, and RQ4. However, it is termed exploratory as it does not attempt to be exhaustive or deterministic in its conclusions of how forces use the classes, how the public interacts with them, or how these questions should be explored. Rather, this exploration is an initial representation of what can be analysed using this style of large-scale automated classification. While this representation can still add to the literature in addressing the research questions, it should not be assumed to be the only way to address these questions.
RQ2 was addressed by examining category counts per force to understand prioritisation and overall agendas. Additionally, language and tweet attributes were explored to illustrate how different forces implement these categories, and variations over time were examined to understand adaptability to prevalent events. For RQ3, metric counts per class and force were analysed to highlight patterns of public interaction within and between forces. This also further explores the effectiveness of a given class compared to another. Finally, RQ4 involved using a multilevel linear regression model to measure the relationship between tweet attributes and positive interactions (retweets for intelligence gathering, likes for providing information, and quotes/replies for engagement), allowing the variation to be measured between forces:
Level 1 (individual level):
Level 2 (group level):
where
is the public interactions,
are any given tweet attributes, and
are regression coefficients that represent the effect of each attribute on
. On the group level,
is the random intercept for a given force,
is the fixed effect at the group level, and
is the random effect representing each group specific deviation. This can provide insight into the impact of the force writing the tweet as opposed to the tweet itself given the attributes on positive engagement.
Results
The results section will firstly present classification results, then an exploratory analysis. Whilst the classification results are only addressing RQ1 – the suitability of categorising tweets into providing information, engagement, and intelligence gathering on larger scale data – an appropriate amount of time will be dedicated to exploring these results due to the novelty of the process. Additionally, understanding the output, success, and drawbacks of this method provides the basis to address all other questions through the new lens of a large dataset.
Tweet categorisation
As stated above, the classification was a twofold process to explore the potential of automated categorisation for a large dataset. A manual content analysis was first completed and observations from the process will be presented below before discussing the performance of the automated classification techniques.
Content analysis
Before hand-classifying the tweets, a content analysis was conducted on a randomly extracted subset of 1000 tweets from the training and testing data. These tweets were divided into further subsets and manually filtered through across multiple iterations to understand the types of tweets that fit into each of the three categories and how effective the categorisation was in practice. The decision of the type of tweet which should belong to a class was based off the general assumption that providing information should be an attempt to inform the public (Mayes Citation2021), intelligence gathering is communication with the goal of collecting information to solve crimes (Holmes Citation2016), and engagement tweets are those that aim to substantively relate to the public (Mawby Citation2002). The initial results, presented in , include example topics and tweets for each class, which formed the basis of the hand-classification process. These were divided by force, to help understand if the hand-labelling process would require differentiation between tweet styles for forces.
Table 2. Example tweets for all forces and classes.
Throughout the classification process, the identified topics and examples served as a reference guide to ensure consistency in defining the classes. An important finding from analysing the 1000 tweets was that all of them fit into at least one of the three categories, with no tweets falling outside of these identified agendas. While most tweets clearly belonged to one category, some engagement and intelligence gathering tweets also contained an element of providing information. Further analysis revealed that such tweets could be categorised based on their core agenda, as they provided information as a means to engage or intelligence gather, rather than engaging or gathering intelligence as a means to provide information. For instance, tweets that provided details of a specific event (for example, a Question-and-Answer session between the force and public) aimed to engage the public through this event, even though they also conveyed information such as event times and locations. Similarly, some intelligence gathering tweets included links to ‘Find out more here: … ’ relating to appeals or witness information, indicating that the primary purpose was to gain information. The content analysis showed that no engagement tweets could be categorised as intelligence gathering, and vice versa. Additionally, no tweets were found to be unsuitable for any of the three classes. Moreover, during the process, observed language and subject similarities and differences within and between categories indicated that an automated text classifier could have the potential differentiate between classes even with short tweets.
The hand classification process confirmed that 1000 police tweets from five different forces spanning three years could each be categorised into at least one of the three identified categories in the literature, confirming at this stage that these categories offer a comprehensive classification for police tweets. While this served as a solid foundation, the automated classification training and testing process on a larger sample would further validate the appropriateness of these categories. Nevertheless, this initial result provided a basis to proceed with trialling an automated approach.
Classification
For automated classification, a training and testing process was conducted, involving the hand labelling of an additional 7,912 tweets. Unique or inconsistent tweet examples found during this process were added to the reference list, developed in the content analysis stage, for improved tagging. Three classifiers in combination with two vectorizers were trained using 75% of the labelled data, considering tweets with and without stop words. Performance metrics were calculated for ten folds on the remaining 25% of the labelled data, and shows the average accuracy scores. Since the ramifications of false positives and false negatives were balanced in this study, only accuracy was considered as the main interpretation, representing the number of correctly classified tweets across all three classes. A detailed assessment of false positives and false negatives per class will be provided later, focusing on the best performing model.
Table 3. Classification results for all classifier and vectorizer combinations.
The logistic regression classifier with TF-IDF word vectors and stop words included achieved the highest accuracy of 86%. Interestingly, models without stop words generally had lower accuracies across all combinations. In NLP studies, stop word removal is common (Hamoud et al. Citation2018, Pratama Citation2019), but for short-form data like tweets, it may not always yield the best results due to the significant presence of stop words in tweet text. The lowest accuracy of 79% was observed with XGBoost using embeddings without stop words. The combinations of XGBoost with embeddings and stop words, and naïve Bayes with TF-IDF and no stop words both achieved an accuracy of 80%. Though the performance differences among logistic regression combinations were minor, the logistic regression classifier with TF-IDF word vectors consistently outperformed the others across all ten folds, making it less likely to be influenced by result randomness.
Before assuming that the logistic regression with TF-IDF model and stop words was suitable for classifying a large sample of police tweets, a detailed examination of the results was necessary to evaluate the 14% of misclassified tweets. This analysis complements the content analysis results and helps address the first research question regarding the appropriateness of automated classification. Studying the misclassifications will provide insights into whether the classes provided a suitable means to categorise tweets, or if the methods used are ineffective in performing the classification. To aid in this evaluation, a confusion matrix () is presented, outlining the number of correctly and incorrectly categorised tweets per class.
Figure 1. Confusion matrix of logistic regression classification results.
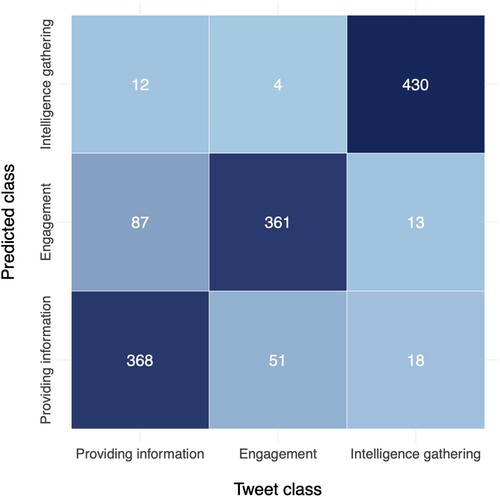
The category with the best classification results was intelligence gathering, with 430 true positives and only 31 false negatives (13 classified as engagement and 18 as providing information). This outcome was expected, as the intelligence gathering category exhibited clear language patterns in the content analysis, such as ‘appeal’, ‘witnesses’, or ‘missing’, which made it distinguishable. However, the other two categories (engagement and providing information) showed more nuanced language differences, leading to less accurate classifications. While the classifier still achieved a majority of correct classifications (361 true positives for engagement and 368 true positives for providing information), there were 55 and 99 instances of false negatives, respectively. These false negatives mostly occurred within the other category (providing information for engagement and vis versa), and intelligence gathering false positives were relatively rare. There were 51 cases where engagement tweets were incorrectly labelled as providing information and 87 cases where providing information tweets were classified as engagement. The content analysis revealed similar patterns, identifying more overlap in language and content between these two classes. To gain a deeper understanding of the implications of these misclassifications, it is essential to examine examples of incorrectly labelled tweets.
presents representative examples of false positives for each category. In the false positive cases for intelligence gathering, common words included ‘investigating’, ‘victim’, ‘help’, and ‘contact’, which often appear in appeals or missing person tweets. There were not many instances of this misclassification. For misclassifications as providing information, tweets often included terms like ‘Find out more’ or ‘Here is’, characteristic of providing information tweets. While this misclassification offers information, the classifier struggled to prioritise the engagement or intelligence agenda due to subtle language differences. Engagement false positives were harder to understand, likely due to the subjectivity of this class. Cases where intelligence gathering was misclassified as engagement (only ten instances) seemed to result from what the tweet did not explicitly mention, such as ‘appeal’ or ‘missing person’.
Table 4. Examples of classification false positives.
The misclassifications did not include any tweets that were completely outside of the three identified categories, indicating that these categories from the literature can be applied to larger sample sizes. Moreover, the misclassifications mostly occurred when tweets could be placed into one of two categories, supporting the content analysis findings. As a result, the implications of misclassification are likely to involve tweets being categorised under their sub-agenda rather than their core agenda, which is not hugely concerning in terms of further analysis. This suggests that the automated text classification is a suitable method for facilitating the confirmed appropriate categorisation from the literature, enabling larger datasets to be analysed.
Transferring the 86% accuracy to the remaining data (26,711 tweets), along with the 95% accuracy (allowing for human error) of the reintegrated hand-labelled test, training, and duplicate tweets, suggests an overall accuracy of 89% for the entire sample of tweets moving forward towards analysis.
Exploratory analysis
In this results section, an exploratory analysis of the classified dataset will be conducted. The section will be divided into three parts. The first part will focus on RQ2, examining the content, patterns, and overall use of classes by different forces. This analysis aims to determine if forces vary in their style, frequency, and adaptability when using these classes. The second part will address RQ3, investigating how the public interacts with the different classes. Potential differences in public engagement between classes and forces will be explored, which may indicate the relative success of one force over another. Finally, the third part will delve into RQ4, building on the previous sections to identify any inherent connections between the tweeting practices of forces and their impact. This analysis will provide valuable insights to help forces effectively use tweets to achieve their agenda goals.
Differing agendas
At this stage, it’s useful to briefly reiterate how policing goals are linked to the classes, implying a specific policing agenda based on their usage. The providing information class signifies a commitment to informing the public, increasing visibility, building confidence, and thereby reassuring the community that the police are doing their job (Herrington and Millie Citation2006). The engagement class indicates a dedication to fostering trust and open dialogue with the public, aligning with community and dialogue policing approaches (Omanga Citation2015, Gilmore et al. Citation2019). Lastly, the intelligence gathering class shows a commitment to data-driven policing and proactive crime prevention, aligning with an intelligence-led policing agenda (Carter and Carter Citation2009).
Considering that the way in which forces must achieve these goals is not formally regimented, different forces may adopt diverse tweet styles. Understanding the impact of each class requires clarity on the specific practices employed by forces. presents the top ten words used by each force within the classes. While individual words may not fully capture a tweet's essence, they offer insights into associated topics and purposes. For the providing information class, common words include ‘arrest’, ‘report’, ‘contact’, ‘police’, and ‘find’. Language patterns show consistency across forces in tweeting styles, involving information on arrests, crimes, live chats, website links. This aligns with the findings from content analysis. Intelligence gathering tweets exhibited the most distinct and representative language for their class, consistently using words like ‘appeal’, ‘help’, ‘information’, ‘101’, and ‘witness’ across all forces. There is a clear and specific pattern in this class across forces without any noticeable deviations. However, WYP utilises a unique hashtag (#caughtoncamera) to seek public assistance in identifying offenders, highlighting the significance of information dissemination within this category.
Table 5. Top 10 most common words for each class per police force.
Finally, the language used in the engagement category is less distinctive compared to the other two classes. The nature of engagement tweets involves personability, making similarity and predictability less prevalent, as they may undermine the core values of the tweeting style. However, some words remain representative of the engagement category across forces, such as ‘help’, ‘safe’, ‘support’, and ‘thank’. These words exhibit more sentimental and agreeable tones compared to the providing information category. Different forces show variations in their choice of words, with GMP and ASP using appreciative and inclusive language, while MET and WYP use less emotive terms. Overall, the analysis reveals distinctions in language and content between classes, with minor variations in how forces use each class, particularly within the engagement class.
Language and content analysis is just one aspect of understanding force differentiations in tweet style. Other tweet attributes, such as length, type, hashtags, media, and links, also contribute to representing varying approaches to style. summarises the use of these attributes per class across the five forces. Regarding links, all forces predominantly include them in providing information and intelligence gathering tweets but not in engagement tweets. WYP stands out by using links in half of their engagement tweets compared to other forces who use them less, while WMP uses them in half of their intelligence gathering tweets compared to other forces who use them more. The use of media attachments (images and videos) is inconsistent across forces and classes. ASP uses media the most in intelligence gathering tweets, MET uses them most often in engagement tweets, and WYP uses them in providing information and engagement. GMP uses media the most in intelligence tweets but also frequently includes them in the other classes. WMP, on the other hand, does not frequently use media across any class, suggesting no clear pattern between media usage and classes within or between forces. Hashtag usage is relatively balanced between providing information and engagement tweets for all forces, except for MET, which uses hashtags frequently in all classes, and ASP, which rarely uses them. Intelligence gathering tweets consistently include hashtags, except for ASP, which rarely uses them, and WMP, which uses them 50% of the time.
Table 6. Summaries of tweet attributes for each class per police force.
When analysing tweet types, it is essential to determine if forces reply more frequently in one class compared to another. Providing information tweets are mostly tweets rather than replies, but each force still uses replies within this class. ASP's providing information tweets consist of more direct replies to the public, showcasing a distinctive approach to providing information.
Surprisingly, no force replies more frequently than tweets in the engagement category, and their levels of replying are not higher than those in providing information tweets, except for ASP. Intelligence gathering tweets are rarely replies, and this pattern is consistent across all forces. Regarding average tweet length, approaches vary per force. The MET has its shortest tweets on average in the providing information class, WMP and ASP have the longest intelligence tweets compared to the other classes, but WYP has the shortest intelligence gathering tweets. GMP's tweets have roughly the same length across all three classes. Each force appears to draft tweets of different lengths across classes, and this variation also occurs between forces. In summary, analysing these tweet attributes provides valuable insights into the unique tweeting approaches of each force per class. Variations in links, media, hashtag usage, type, and length contribute to their differentiation. Despite all forces falling into one of the three classes within the large sample, the way they enact these classes is not uniform, offering an interesting foundation for analysing variations in use and impact.
Now the distinct styles adopted by forces are understood, it becomes interesting to explore how frequently they use these styles, which may indicate variations in force prioritisation of the related agenda for each class. Analysing how frequently these styles are used on a large-scale basis can reveal tweeting agenda beyond what is claimed in qualitative research (Meijer and Torenvlied Citation2016) or smaller quantitative studies (Williams Citation2018). shows the class usage per force, with absolute tweet counts on the right-hand side of the bars. The providing information category is the most commonly used by all forces, accounting for approximately 50% of tweets from MET, WMP, and WYP. ASP uses this category 55% of the time, while GMP uses it the most at 62%. From the content analysis and classification, it was noted that this category consisted of generic tweets, often duplicated across forces. This suggests that all forces use Twitter to achieve an information-based reassurance agenda, likely due to its usefulness and ease of creating tweets. Forces do still prioritise this category differently, with a 12% difference between MET and GMP.
Figure 2. Tweet class usage per force.
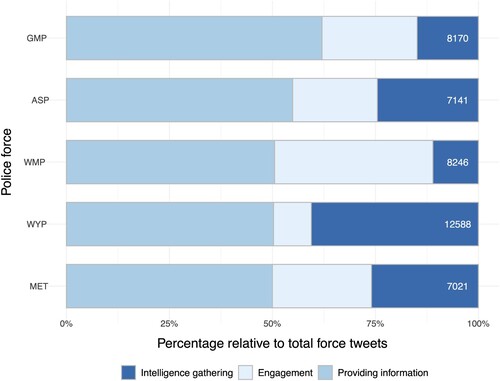
In terms of engagement, WMP stands out the most, with 38% of their tweets linking to a community agenda, making up nearly two-fifths of their content over three years. MET and GMP follow with 24% and 23% engagement respectively, significantly lower than WMP. ASP's engagement tweets make up 20%, while WYP only has 9% aiming to engage the public. These results indicate that WMP places a high priority on community engagement in their tweeting strategy, while WYP does not prioritise it over the three-year period – suggesting engagement with the public is not a core aspect of their overall tweeting agenda. Notably, the above findings () show that forces generally do not reply frequently in their engagement tweets, suggesting that the prioritisation (or lack thereof) does not signify two-way dialogue.
The intelligence gathering class is directly linked to intelligence-based policing. WYP utilised this tweeting strategy the most at 41%, demonstrating a strong commitment to intelligence policing through social media. MET and ASP follow with 26% and 25% of their tweets falling within this class respectively, while GMP and WMP have 15% and 11% respectively. Overall, forces prioritise their Twitter agendas differently. All forces commit to providing information to some extent, but they vary in their approaches to the other two classes. WMP, with the highest percentage of engagement tweets, focuses less on intelligence gathering, while WYP, with the highest intelligence gathering, has the least engagement. WMP and WYP stand out in their commitment to engagement and intelligence gathering, respectively, showcasing an effort to display community-based and intelligence-led policing agendas through social media beyond the other forces. ASP emphasises intelligence gathering over engagement, while GMP prioritises engagement over intelligence gathering, albeit to a lesser extent compared to WMP and WYP. The MET maintains an equal balance between both approaches. This finding indicates that forces’ tweeting agendas differ when analysed over a large sample of tweets – with some forces placing more important on using the tool for community building and other for a crime solving agenda.
Considering the sample size, analysing if the use of classes varies over time is crucial to understand force prioritisation and determine if strategies are reactionary or flexible. shows the tweet count per force aggregated by week over a three-year period, normalising extreme jumps observed when plotting per day. Three key dates are marked on the graph: the first U.K. lockdown during the COVID-19 pandemic (23rd March 2019), the murder of George Floyd (25th May 2019), and the murder of Sarah Everard (4th March 2021). These points highlight potential periods when police tweeting strategies should have been subject to change if they wish to adapt in response to important events or political tension. Regarding information provision, ASP, WMP, and GMP witnessed a peak in their weekly tweet numbers in response to the first lockdown announcement, indicating a strong reactionary response for this class. Furthermore, all three forces experienced peaks in providing information tweets after the deaths of George Floyd and Sarah Everard. Even though engagement tweets would be expected to increase after such events, an increase in providing information indicates a commitment to reassuring the public during these highly politicised periods. However, it's important to note that GMP's providing information tweeting peaks several times across various weeks throughout the period, suggesting the potential for overall fluctuating police tweeting strategies rather than specific reactions to events. On the other hand, GMP and the MET did not demonstrate a reactionary providing information strategy at all during the three-year period, gradually decreasing their use of this category over time.
Figure 3. Number of tweets (aggregated per week) for each class per force.
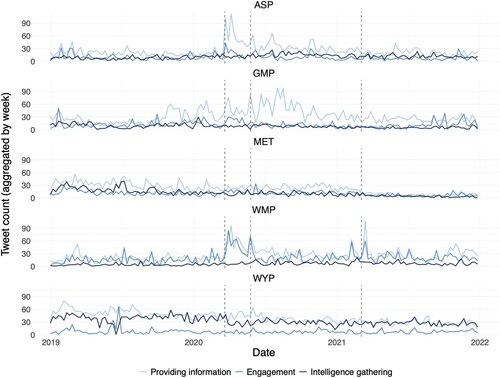
Regarding engagement strategies, they were generally less reactionary than providing information. WMP showed a consistent commitment to reactionary tweeting, similar to providing information. In contrast, ASP had occasional surges in engagement after the COVID-19 lockdown and George Floyd's death but remained consistent otherwise. GMP's engagement tweets increased slightly after the lockdown announcement but decreased overall, while the MET had a slight increase after George Floyd's death but reduced their use over time. WYP did not adjust their engagement tweeting practices throughout the three-year period. Apart from WMP (who also had the highest number of overall engagement tweets.), no force exhibited a strong commitment to reactionary engagement during significant events or periods of political tension. This finding is concerning, considering the benefits of engagement during these periods (Fowler Citation2017). It may be related to perceived risks of negative interactions on social media, leading police to avoid engagement when community relationships are weakened (Goldsmith Citation2010, Goldsmith Citation2015). Intelligence gathering appeared to be the least reactionary category, aligning with the fact intelligence policing should react to operational factors rather than public relations. WYP, who had a strong intelligence-led agenda on social media, consistently prioritised this approach over the three years. Other forces’ intelligence efforts were not impacted by their prioritisation of providing information or engagement strategies, as intelligence gathering remained consistently present in the background. Overall, no force showed that focusing on one strategy came at the expense of another, indicating that these strategies were not mutually exclusive.
In conclusion, the analysis of tweeting strategies over time reveals significant variations in how police forces prioritise these strategies and the extent to which they do so. WMP displayed a highly reactionary tweeting agenda, while ASP and GMP exhibited varying degrees of reactivity in different categories. In contrast, WYP and the MET showed no evident attempts to adapt their tweeting styles based on key events or periods. This analysis underscores the importance of larger sample sizes for understanding police actions on social media and their force agendas. Snapshots from a limited timeframe may misrepresent a force’s actual approach to using these categories and fail to provide a comprehensive picture of the differing approaches among forces.
Public interactions
It is now understood that police forces tend to differ in their approach to the three tweet categories in their content, style, frequency, and adaptability. It is useful to gain an understanding of how the public interact with these differing approaches, which can be measured using tweet metrics such as likes, retweets, quote tweets, and replies. This addresses RQ3. Interpreting these interactions has its challenges as they can be both positive and negative (replies and quotes), and there are other measures of effectiveness beyond interactions (such as information reach and changing perceptions). As this study methodologically focuses on tweet classification, capturing the deeper content of interactions and subjective aspects of success falls outside of its scope. However, there are clear success indicators that can be measured using these metrics for specific agendas. For example, likes on providing information tweets can signify overall engagement and positive perception linking to a reassurance agenda. Retweets on intelligence gathering tweets demonstrate the willingness of the public to collaborate with the police in solving crimes and symbolises the effective dissemination of information. Engagement tweets’ success can be measured through likes, but also replies and quotes as these represent a two-way dialogue (even if negative). displays mean tweet metrics (retweets, likes, replies, and quote tweets) per force within each category.
Table 7. Average tweet metric for each class per force.
On average across all forces, tweets receive more likes than retweets, replies, or quotes, except for intelligence gathering tweets, which are retweeted more frequently (reflecting their information dissemination purpose). Quotes are consistently the least common metric, and replies are more common than quotes but less than retweets. Both of these metrics are most common amongst engagement tweets, suggesting that even though they are not the most frequent interaction (most likely due to the effort they take), the public are more willing to make this effort in response to an engagement tweet. Among all forces other than WMP, engagement tweets receive the highest number of likes, indicating a positive reception from the public. For ASP, WYP, and GMP, engagement tweets receive at least twice as many likes as providing information or intelligence gathering tweets. In the case of the MET, engagement tweets receive twice as many likes as intelligence gathering tweets and 1.5 times as many likes as providing information tweets. As likes and retweets represent a positive attitude toward a tweet (unlike replies and quotes, which can be either positive or negative), this suggests that engagement tweets are well-received by the public.
WMP's strong commitment to engagement and a reactionary strategy raises questions about how the public interacts with their tweets in terms of metrics. On average, their engagement tweets receive fewer retweets and likes compared to the MET and GMP, and fewer replies and quotes compared to the MET. Therefore, it cannot be assumed that mere frequency of tweeting will lead to increased interaction. However, their providing information tweets receive more engagement on average than all forces except the MET, indicating that being flexible to public opinion may lead to increased interaction. WYP tweets more in the intelligence gathering category than any other force, but this doesn't seem to translate to higher reaction levels, as their intelligence tweets are retweeted much less than any other force. The MET, which did not prioritise any specific agenda and did not exhibit reactionary tweeting patterns, consistently received more likes, retweets, quotes, and replies than any other force across all three categories. These findings suggest that the prioritisation of a particular agenda may not directly link to increased public interaction and the associated measures of success. This calls for further exploration of other factors influencing tweet interaction, such as tweet attributes, or underlying features of a force not evident from their tweeting habits.
Generating impact
The final research question aims to understand what aspects of police tweets contribute to gathering interactions related to their specific agendas. To address this question, three multilevel linear regression models were employed, one for each tweeting strategy (providing information, engagement, and intelligence). Each model used tweet attributes (tweet length, mentions, hashtags, media, and links) as independent variables, with likes as the dependent variable for providing information, a combined total of quotes and replies for engagement, and retweets for intelligence. The links between these tweet interactions and success based on force agendas are detailed above. The multilevel nature of the models accounts for potential variations in tweet attributes across different police forces, an assumption supported by the results in relation RQ2, considering the hierarchical structure of the data – tweets nested within force accounts. This approach allows for estimating variations in the relationship between tweet attributes and interactions across different forces through random intercepts at the police level. While the model does not provide specific insights per force regarding the impact of a particular attribute, it captures and quantifies the variation in public interaction between forces, revealing general patterns rather than specific details for each force individually. The choice of this model is appropriate for this research as it helps to understand if force differences account for more variation in public interaction than individual tweet attributes. The results can be generalised to assist any force in understanding whether they can modify their tweets to gain more interaction, or if it is related to force characteristics. The results are presented in .
Table 8. Multilevel linear regression models per tweeting strategy
The data shows that tweet length has a positive correlation with the number of likes for providing information tweets. Each additional unit in tweet length corresponds to an average increase of 1.3 likes. Tweets with hashtags received more likes, while those with links got fewer likes compared to those without links. Mentions and media did not significantly impact the number of likes for providing information tweets. The random intercept variance for police force was 3893, indicating that there were differences in likes between police forces even after considering fixed effects. However, the residual variance at the tweet level is 46 times greater than at the force level, suggesting that there were still unexplained variations in likes for providing information tweets, possibly due to factors beyond tweet attributes or between force differences. For engagement tweets, there was a positive significant relationship between tweet length and interactions (replies and quotes). Conversely, mentions had a negative significant relationship with interactions, meaning that tweets tagging specific accounts receive fewer replies or quotes overall. Additionally, links and hashtags had a negative significant relationship with interactions in engagement tweets, likely because they make the tweets less personal, resulting in fewer direct responses. However, media did not show a significant relationship with quotes or replies in engagement tweets. Similarly to providing information, the random effects section of the model indicates that there was a significant amount of unexplained variation at the tweet level compared to the group level, even after accounting for fixed effects. Regarding intelligence gathering tweets, tweet length had a significant positive relationship with the number of retweets on average. Hashtags and media also positively correlated with the number of retweets, while tweets with links received fewer retweets. There was no significant relationship with mentions in this case. This model indicates that there was more variation in retweets between forces for intelligence gathering tweets, with 14% of the variation explained at the group level. However, the residual variance remained high, suggesting that other factors beyond the fixed effects played a role in determining the number of retweets for intelligence gathering tweets.
These results only represent one aspect of interaction per class, and other, more subjective, metrics are also relevant for measuring tweet success. Nevertheless, they provide insights into the impact of editable tweet attributes on measurable success indicators for each agenda. To increase likes for providing information tweets, police forces could make them longer, use hashtags, and avoid links. For more replies or quotes in engagement tweets, it is less clear what the tweets should include, but clearer what they should not (links or hashtags). Intelligence gathering tweets may gain more retweets with longer length, media, and hashtags. Each category's attributes play a unique role, highlighting the significance of style variation for specific agendas and their interactions. In all models, a significant portion of the variation remained unexplained by group-level differences (between forces) or fixed effects (attributes). This indicates the presence of other factors influencing increased class interaction, especially for engagement and providing information tweets. The findings offer police guidance on simple steps to enhance specific interaction metrics per class. However, to achieve their agendas fully, forces should also assess additional characteristics.
Discussion
This discussion will summarise the results, contextualising the findings with relevant literature and research questions, before highlighting study limitations. Recommendations will be provided to researchers and police forces utilising social media before a final conclusion will be presented.
Summary of results
The research aimed to address four main research questions. Firstly, it focused on automated tweet categorisation, which, though methodologically focused, provided insights into police tweeting behaviour. The study manually and automatically analysed over 40,000 tweets, leading to the affirmation that three main tweet classes identified in the literature do represent distinct policing behaviours, which in turn, reflect their social media agendas. These classes were then used to address three additional research questions. RQ2 explored the content and style variation in these tweet classes, revealing that, whilst police forces consistently use all three classes, they prioritise them differently. The large sample size allowed for further understanding of how this prioritisation differs, in terms of overall use and adaptability over a three-year period. RQ3 delved into public interactions with these tweet classes, indicating that while interactions within classes were similar, the extent of interaction varied between forces. This suggested that the differences in how forces execute their agendas impact public engagement, contributing to their success. Finally, the study modelled the relationship between tweet attributes and interactions per tweet class, allowing for the measurement of variation between forces due to highlighted force differences. The findings presented specific attributes that forces can easily manipulate to potentially increase tweet interaction. However, it also emphasised the need for further analysis by forces to better comprehend the variation in tweet interactions. Overall, this study demonstrates that automated police social media categorisation can generate large datasets which are accurate representations of police tweeting behaviour, enabling a broader analysis of this behaviour and a better understanding of their social media agendas.
Limitations
It has been highlighted in the literature that police Twitter behaviour predominantly stems from individual officer or local force accounts (Meijer and Torenvlied Citation2016), which can offer higher engagement compared to main force accounts (Schneider Citation2016). Therefore, the results of this study are not representative of all Twitter behaviour by police. However, due to limited time and workforce, the sample size for hand coding had to be restricted. Another limitation of the practical restrictions of the study was that hand classification was undertaken by one person, introducing potential human errors in assigning classes. The exploration of sub-classes within each category could have allowed for more descriptive insights in terms of tweeting behaviour. Additionally, considering a fourth class for tweets that were both informative and engaging could have enhanced classifier accuracy. Regarding the analysis, incorporating a time series element could have improved the examination of tweets over time, allowing for the significance of fluctuating behaviour to be better understood. Furthermore, considering additional tweet and force characteristics would enable a more comprehensive assessment of how forces can achieve impact with their tweets, beyond a single interaction metric.
Recommendations
Future research could capitalise on the limitations of this study by exploring large-scale datasets further. This could involve incorporating a time series analysis to understand the reactionary nature of police agendas or introducing a random slope element to the multilevel model to examine the precise impact of attributes per force. Replicating the classification approach on samples from different forces, time frames, or municipalities would provide additional insights into various tweeting practices. Moreover, the classification method could be used to delve deeper into each category, such as understanding how providing information approaches are utilised during riots or protests, how interaction with engagement varies over time, or how diverse intelligence prioritisations relate to crime solutions. Police forces can utilise the study’s findings, data, and methods to enhance their evaluation of the use and impact of their social media accounts. Analysing how a force prioritises tweet categories on a large scale can help identify opportunities to shift focus to better align with their agenda. Moreover, considering tweet attributes that align with successful interaction, such as media and hashtags for intelligence tweets, or hashtags and tweet length for providing information, can further improve their social media strategies. Finally, forces could consider how the demographics of their following relate to public interactions of a given class to better adapt their tweeting strategy to their audience or community. Each of these recommendations for future work further displays how automated classification resulting in larger datasets can expand the field of police social media research.
Concluding thoughts
In conclusion, this analysis establishes the feasibility of automated tweet classification as a valuable method for advancing police social media research. By enabling the examination of larger tweet samples over extended time frames, this approach opens avenues for more comprehensive investigations. With the potential for widescale research, police social media strategies can be thoroughly evaluated, leading to a deeper understanding of how forces leverage this crucial tool to effectively address essential policing agendas.
Availability of data and materials
Data extracted using Twitter’s API and is accessible on a public repository.
Acknowledgments
The following work acknowledges the guidance of supervisors Jose Pina-Sánchez and Daniel Birks, as well as the technical support and advice from Pieter Maes.
Disclosure statement
No potential conflict of interest was reported by the author(s).
Additional information
Funding
References
- Abascal-Mena, R., and Lopez-Ornelas, E., 2020. Author detection: analyzing tweets by using a Naïve Bayes classifier. Journal of intelligent & fuzzy systems, 39, 2331.
- Anderson, M., and Hitlin, P., 2016. Social media conversations about race, 35.
- Barrie, C., and Ho, J., 2021. Academictwitter: An R package to access the twitter academic research product track v2 API endpoint. Journal of open source software, 6 (62), 3272. doi:10.21105/joss.03272.
- Beitia-Antero, L., Yáñez, J., and de Castro, A.I.G., 2018. On the use of logistic regression for stellar classification: an application to colour-colour diagrams. Experimental astronomy, 45 (3), 379–395. doi:10.1007/s10686-018-9591-4.
- Beshears, M.L., 2016. Effectiveness of police social media use. American journal of criminal justice, 42 (3), 489–501. doi:10.1007/s12103-016-9380-4.
- Beshears, M., Beshears, M., and Bond, M., 2019. Improving police social media use practices. International journal of social science studies, 7 (5), 34. doi:10.11114/ijsss.v7i5.4449.
- Bokeh Development Team. 2018. Bokeh: Python library for interactive visualization [Computer software].
- Boyd, D., Golder, S., and Lotan, G. 2010. Tweet, Tweet, Retweet: conversational aspects of Retweeting on Twitter. 1–10. doi:10.1109/HICSS.2010.412.
- Brainard, L., and Edlins, M., 2015. Top 10 U.S. municipal police departments and their social media usage. The American review of public administration, 45 (6), 728–745. doi:10.1177/0275074014524478.
- Brainard, L.A., and McNutt, J.G., 2010. Virtual government–citizen relations: informational, transactional, or collaborative? Administration & society, 42 (7), 836–858. doi:10.1177/0095399710386308.
- Brownlee, J. 2019. What are word embeddings for text?
- Bullock, K., 2018. The police Use of social media: transformation or normalisation? Social policy and society, 17 (2), 245–258. doi:10.1017/S1474746417000112.
- Carter, D.L., and Carter, J.G., 2009. Intelligence-led policing: conceptual and functional considerations for public policy. Criminal justice policy review, 20 (3), 310–325. doi:10.1177/0887403408327381.
- Clark, D.. 2022. Number of police officers in the United Kingdom in 2022, by police force. Statista. https://www.statista.com/statistics/877540/leading-police-forces-by-officer-numbers-in-the-uk/.
- Costache, R., et al., 2021. Flash-flood potential index estimation using fuzzy logic combined with deep learning neural network, naïve Bayes, XGBoost and classification and regression tree. Geocarto international, 1–28. doi:10.1080/10106049.2021.1948109.
- Crump, J., 2011. What are the police doing on Twitter? Social Media, the Police and the Public. Policy & Internet, 3 (4), 1–27. doi:10.2202/1944-2866.1130.
- Davis, E., Alves, A.A., and Sklansky, D.A., 2014. Social media and police leadership: lessons from Boston. New perspectives in policing, 24.
- Davis, J., and Goadrich, M., 2006. The relationship between precision-recall and ROC curves. Proceedings of the 233d International Conference on Machine Learning - ICML ‘06, 233–240. doi:10.1145/1143844.1143874.
- Denef, S., Bayerl, P.S., and Kaptein, N.A. 2013. Social media and the police: tweeting practices of British police forces during the August 2011 riots. 3471–3480. doi:10.1145/2470654.2466477.
- Dwyer, M., 2020. Reimagining police engagement? Kenya national police service on social media. Policing and society, 30 (7), 760–776. doi:10.1080/10439463.2019.1589470.
- Earl, J., et al., 2013. This protest will be Tweeted: Twitter and protest policing during the Pittsburgh G20. Information, communication & society, 16 (4), 459–478. doi:10.1080/1369118X.2013.777756.
- Edgari, E., Thiojaya, J., and Qomariyah, N.N. 2022. The impact of Twitter sentiment analysis on bitcoin price during COVID-19 with XGBoost. 2022 5th International Conference on Computing and Informatics (ICCI), 337–342. doi:10.1109/ICCI54321.2022.9756123.
- Fielding, N., and Innes, M., 2006. Reassurance policing, community policing and measuring police performance. Policing and society, 16 (2), 127–145. doi:10.1080/10439460600662122.
- Finch, H., and Schneider, M.K., 2007. Classification accuracy of neural networks vs. discriminant analysis, logistic regression, and classification and regression trees. Methodology, 3 (2), 47–57. doi:10.1027/1614-2241.3.2.47.
- Fowler, B.M., 2017. Stealing thunder and filling the silence_ twitter as a primary channel of police crisis communication. Public relations review, 11.
- Gilmore, J., Jackson, W., and Monk, H., 2019. ‘That is not facilitating peaceful protest. that is dismantling the protest’: anti-fracking protesters’ experiences of dialogue policing and mass arrest. Policing and society, 29 (1), 36–51. doi:10.1080/10439463.2017.1319365.
- Goldsmith, A.J., 2010. Policing’s new visibility. British journal of criminology, 50 (5), 914–934. doi:10.1093/bjc/azq033.
- Goldsmith, A., 2015. Disgracebook policing: social media and the rise of police indiscretion. Policing and society, 25 (3), 249–267. doi:10.1080/10439463.2013.864653.
- Grimmelikhuijsen, S.G., and Meijer, A.J., 2015. Does twitter increase perceived police legitimacy? Public administration review, 75 (4), 598–607. doi:10.1111/puar.12378.
- Hamoud, A.A., et al., 2018. Classifying political Tweets using Naïve Bayes and support vector machines. In: M. Mouhoub, S. Sadaoui, O. Ait Mohamed, and M. Ali, eds. Recent trends and future technology in applied intelligence Vol. 10868. Greensboro, NC: Springer International Publishing, 736–744. doi:10.1007/978-3-319-92058-0_71.
- Herrington, V., and Millie, A., 2006. Applying reassurance policing: is it “business as usual”? Policing and society, 16 (2), 146–163. doi:10.1080/10439460600662148.
- Heverin, T., and Zach, L., 2010. Twitter for city police department information sharing: Twitter for City police department information sharing. Proceedings of the American society for information science and technology, 47 (1), 1–7. doi:10.1002/meet.14504701277.
- Hofmann, S., et al., 2013. What makes local governments’ online communications successful? insights from a multi-method analysis of Facebook. Government information quarterly, 30 (4), 387–396. doi:10.1016/j.giq.2013.05.013.
- Holmes, L., 2016. Missing person appeals: A UK perspective. In: S. Morewitz, and C. Sturdy Colls, eds. Handbook of missing persons. Muncie, IN: Hogrefe & Huber Publishers.
- Honeycutt, C., and Herring, S.C. 2009. Beyond microblogging: conversation and collaboration via Twitter. 10. https://www.computer.org/csdl/proceedings-article/hicss/2009/03-05-05/12OmNBqv2en.
- Honnibal, M., et al. 2020. Spacy: industrial-strength natural language processing in python (1.2.0) [Computer software]. https://spacy.io.
- Huang, Y., and Wu, Q., 2018. Understanding interactions between municipal police departments and the public on Twitter. In: G. Chowdhury, J. McLeod, V. Gillet, and P. Willett, eds. Transforming digital worlds Vol. 10766. Syracuse: Springer International Publishing, 37–46. doi:10.1007/978-3-319-78105-1_5.
- Johnston, J., and McGovern, A., 2013. Communicating justice: a comparison of courts and police Use of contemporary media. International journal of communication, 7, 1667–1687.
- Jurafsky, D., and Martin, J.H., 2021. Speech and Language Processing. 2. Upper Saddle River, NJ: Prentice Hall
- Kudla, D., and Parnaby, P., 2018. To serve and to tweet: an examination of police-related twitter activity in Toronto. Social media + society, 4 (3), 205630511878752. doi:10.1177/2056305118787520.
- Lawson, B.. 2013. Guidelines on the Safe use of the internet and social media by Police Officers and Police Staff. Association of Chief Police Officers. The Association of Chief Police Officers.
- Lee, M., and McGovern, A., 2013. Force to sell: policing the image and manufacturing public confidence. Policing and society, 23 (2), 103–124. doi:10.1080/10439463.2011.647913.
- Lieberman, J.D., Koetzle, D., and Sakiyama, M., 2013. Police departments’ Use of Facebook: patterns and policy issues. Police quarterly, 16 (4), 438–462. doi:10.1177/1098611113495049.
- Liu, Y.Y., et al., 2011. A comparison of logistic regression, classification and regression tree, and neural networks models in predicting violent Re-offending. Journal of quantitative criminology, 27 (4), 547–573. doi:10.1007/s10940-011-9137-7.
- Lovejoy, K., Waters, R.D., and Saxton, G.D., 2012. Engaging stakeholders through twitter: How nonprofit organizations are getting more out of 140 characters or less. Public relations review, 38 (2), 313–318. doi:10.1016/j.pubrev.2012.01.005.
- Mawby, R.C., 2002. Policing images: policing, communications, and legitimacy. Portland, OR: Willan Publishing.
- Mayes, L., 2021. Social media and community-oriented policing: examining the organizational image construction of municipal police on twitter and Facebook. Police practice and research, 22 (1), 903–920. doi:10.1080/15614263.2020.1843459.
- Meijer, A., and Thaens, M., 2013. Social media strategies: understanding the differences between north American police departments. Government information quarterly, 30 (4), 343–350. doi:10.1016/j.giq.2013.05.023.
- Meijer, A.J., and Torenvlied, R., 2016. Social media and the new organization of government communications: an empirical analysis of Twitter usage by the Dutch police. The American review of public administration, 46 (2), 143–161. doi:10.1177/0275074014551381.
- Nikolovska, M., Johnson, S.D., and Ekblom, P., 2020. “Show this thread”: policing, disruption and mobilisation through twitter. An analysis of UK law enforcement tweeting practices during the COVID-19 pandemic. Crime Science, 9 (1), 20. doi:10.1186/s40163-020-00129-2.
- O’Connor, C.D., 2017. The police on twitter: image management, community building, and implications for policing in Canada. Policing and society, 27 (8), 899–912. doi:10.1080/10439463.2015.1120731.
- Odeyemi, T.I., and Obiyan, A.S., 2018. Digital policing technologies and democratic policing: will the internet, social media and mobile phone enhance police accountability and police–citizen relations in Nigeria? International journal of police science & management, 20 (2), 97–108. doi:10.1177/1461355718763448.
- Omanga, D., 2015. ‘Chieftaincy’ in the social media space: community policing in a twitter convened baraza. Stability: international journal of security & development, 4, 1. doi:10.5334/sta.eq.
- Police Foundation. 2014. Police use of social media. 12.
- Porumbescu, G.A., 2016. Linking public sector social media and e-government website use to trust in government. Government information quarterly, 33 (2), 291–304. doi:10.1016/j.giq.2016.04.006.
- Pratama, B., et al., 2019. Sentiment analysis of the Indonesian police mobile brigade corps based on twitter posts using the SVM and NB methods. Journal of physics, 13.
- Procter, R., et al., 2013. Reading the riots: What were the police doing on Twitter? Policing and society, 23 (4), 413–436. doi:10.1080/10439463.2013.780223.
- Ralph, L., 2021. The dynamic nature of police legitimacy on social media. Policing and society, 1–15. doi:10.1080/10439463.2021.1956493.
- Rosenbaum, D.P., et al., 2011. Understanding community policing and legitimacy-seeking behavior in virtual reality: a national study of municipal police websites. Police quarterly, 14 (1), 25–47. doi:10.1177/1098611110392722.
- Ruddell, R., and Jones, N., 2013. Social media and policing: matching the message to the audience. Safer communities, 12 (2), 64–70. doi:10.1108/17578041311315030.
- Schneider, C.J., 2016. Police presentational strategies on twitter in Canada. Policing and society, 26 (2), 129–147.
- Solymosi, R., Petcu, O., and Wilkinson, J., 2020. Exploring public engagement with missing person appeals on twitter. Policing and society, 1–24. doi:10.1080/10439463.2020.1782409.
- Statista Research Department. 2022. Leading countries based on number of Twitter users as of January 2022. Statista. https://www.statista.com/statistics/242606/number-of-active-twitter-users-in-selected-countries/.
- Tao, K., et al., 2013. Information retrieval for twitter data. In: K. Weller, A. Bruns, J. Burgess, M. Mahrt, and C. Puschmann, eds. Twitter and society. New York: Peter Lang, 195–206.
- Tsoi, K.K.F., et al., 2018. How can we better use twitter to find a person who got lost due to dementia? NPJ digital medicine, 1 (1), 14. doi:10.1038/s41746-018-0017-5.
- van de Velde, B., Meijer, A., and Homburg, V., 2015. Police message diffusion on twitter: analysing the reach of social media communications. Behaviour & information technology, 34 (1), 4–16. doi:10.1080/0144929X.2014.942754.
- Walsh, J.P., 2020. Social media and border security: Twitter use by migration policing agencies. Policing and society, 30 (10), 1138–1156. doi:10.1080/10439463.2019.1666846.
- Warren, A.M., Sulaiman, A., and Jaafar, N.I., 2014. Social media effects on fostering online civic engagement and building citizen trust and trust in institutions. Government information quarterly, 31, 291–301.
- Waters, R.D., and Williams, J.M., 2011. Squawking, tweeting, cooing, and hooting: analyzing the communication patterns of government agencies on twitter. Journal of public affairs, 11 (4), 353–363. doi:10.1002/pa.385.
- Williams, C.B., 2018. Leveraging social media to achieve a community policing agenda. Government information quarterly, 13.
- Williams, C.B., et al., 2018. Leveraging social media to achieve a community policing agenda. Government information quarterly, 35 (2), 210–222. doi:10.1016/j.giq.2018.03.001.
- Wright, D.K., 2001. The magic communication machine: examining the internet’s impact on public relations, journalism, and the public. Gainesville, FL: Institute for public relations.