
ABSTRACT
An investigative field survey was performed to gather baseline data on locally available feed ingredients and fish farming practices in different regions of Tanzania. More than 80% of respondents relied on locally available feed ingredients as a major feed supplement for their cultured fish, with maize bran being the most commonly used feed ingredient in all regions. Crude protein content in most analyzed local feed ingredients was medium-high, while crude fat content was high in some animal and agricultural by-products, and medium-low in other ingredients. Most respondents were males and the majority of fish farms were owned by individuals. Earthen pond was the most common fish farming system in all regions except Dar es Salaam. Semi-intensively mixed-sex tilapia monoculture was the dominating fish farming practice. The results of the survey presented provide a good platform for future development of culture systems and feeding strategies for tilapia in Tanzania.
Introduction
Fish farming industry in Africa has shown a remarkable fast growth rate of 2.5% of the world fish farming production in 2016 (FAO Citation2018). The production is led by Egypt (1.7%), followed by Nigeria (0.4%). However, the majority of sub-Saharan countries (excluding Nigeria) continue to report low fish farming production despite great potential resources for fish farming development and past government efforts to assist fish farmers. Fish farming operations in Tanzania started in the 1950s, but its growth was slow until the 1980s due to poor farming methods and technology (Mallya Citation2007). However, the fish farming industry has gained in popularity in recent years, as reflected in the increase in fish farms from 14,100 earthen fishponds in 2004 (FAO Citation2012; Kaliba et al. Citation2006; Mallya Citation2007; Mushi Citation2006) to 26,445 in 2019, producing in total around 18,018.6 MT annually (URT (United Republic of Tanzania) Citation2019). The most commonly cultured fish species is Nile tilapia Oreochromis niloticus, followed by African catfish, Clarias gariepinus (Chenyambuga et al. Citation2014; Kaliba et al. Citation2006; Mallya Citation2007). However, expansion of tilapia fish farming in Tanzania as in other sub-Saharan countries has been constrained for decades by lack of skilled manpower, inadequate quality feeds and seeds supply, poor management, and lack of investment capital.
The majority of farmed tilapia species in Africa, and in Tanzania, are currently reared extensively or semi-intensively for subsistence in ponds, tanks, hapas or cages, and are fed on locally available feed ingredients (Chenyambuga et al. Citation2014; El-Sayed Citation2006; Nguyen Citation2008). In Tanzania, tilapia fish farmers use mixed or single-ingredient diets to feed their fish (Kaliba et al. Citation2006). However, the local feed ingredients used and their nutrient content vary widely within and between African countries (Munguti et al. Citation2014; Ogello et al. Citation2014; Tacon, Metian, and Hasan Citation2009). Surveys on the use and availability of local feed ingredients to tilapia farmers have been performed in Kenya, Uganda, and Egypt, in an attempt at improving fish diets and increasing farm profits (Mamum-Ur-Rashin et al. Citation2013; Munguti et al. Citation2006; Nalwanga et al. Citation2009; Nasim Al Mahmud, Hossain, and Minar Citation2012). Moreover, value chain analysis of the fish farming feed industry has been performed in Egypt, through the use of a structured questionnaire designed for feed manufacturers and fish farmers (El-Sayed Citation2014). However, there is a lack of data on locally available feed ingredients from different regions of Tanzania and their nutrient content; this information is urgently needed in order to expand the fish farming industry in the country. Therefore, the present study was conducted to assess the availability and nutritional content of local feed ingredients commonly used by tilapia fish farmers in Tanzania. Moreover, the aim was also to obtain the current status of fish farming systems and practices from 24 districts and nine regions of Tanzania.
Materials and methods
Study sites
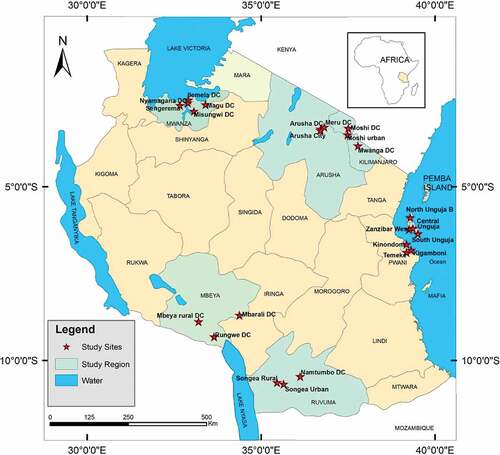
The study was carried out in 95 villages within 24 districts in nine regions of mainland Tanzania and Zanzibar Island during the period of January 2017 to February 2018. The study sites were located between latitude 2°22ʹ and 11°20ʹ and longitude 32°50ʹ and 39°30ʹ and were selected based on existing geographical zones, high water resource potential, presence of large numbers of active tilapia fish farmers and availability of potential local feed ingredients (). The human population at the study sites ranged from 39,242 to 1,220,611 and the sites represented in total 7,368,014 inhabitants (TNBS (Tanzania National Bureau of Statistics) Citation2012). However, the total population projection for the year 2017 was 9,641,386 inhabitants (TNBS Citation2012). The main economic activities at the study sites varied considerably depending on economic resources, climate conditions, and geographical zone, but included tourism, mining, fishing, agriculture, and animal production.
Figure 1. Map of Tanzania showing the study sites (modified from Google, IMS Database, 2016). Courtesy: A.H. Kombo
Data and sample collection
A structured questionnaire comprising questions concerning the type of fish farm, farming system, farming methods and technology, local feed ingredients used, source of fish seeds, investment costs, and stocking density. Other information collected were feeding practices, cost of feeds, type, and sources of water used on the farm and other issues relating to fish farming was used to collect data. Thirty local feed ingredients were collected from four different geographical locations in Tanzania (Dar es Salaam, Morogoro, Mbeya and Mwanza region; ). These ingredients were analyzed to determine their nutrient content. The samples were obtained from fish farmers, local fish feed and fingerling producers, and animal feed centers located near fish farms in each region. In brief, five different local feed ingredient samples each weighing 200 g obtained from five out of 20 randomly selected fish farmers or animal feed centers in three districts per region, depending on geographical zone, availability, specificity, and climate conditions. Therefore, a total of 60 samples (15 per region) of the 30 different local feed ingredients were collected for analysis. An additional 10 commercial and local-made feed samples were collected in four regions (Mwanza, Dar es Salaam, Arusha, and Kilimanjaro) (). The feed samples were dried, packaged and transported to Sokoine University of Agriculture for proximate analysis. Selected samples with high protein content were taken to Tanzania Veterinary Laboratory Agency for amino acid analysis.
Sample preparation
The individual feed ingredient samples from different regions were pooled, sun-dried for 48 h, packaged and transported to the laboratory for proximate analysis according to the method described by Sindirações (Citation2005) and Alimentaruis (Citation2004). The pooled sample of each feed ingredient was then spread out on a clean plain surface marked into quarters and two opposite quarters were taken and mixed. This process was repeated until the two quarters selected comprised the desired amount of 100–200 g. Prior to analysis, these sub-samples were milled by a JYL-D020 Powerful Multifunctional Blender Food Processor, Joyoung, China and sieved by hand through 1.0 mm circular openings.
Proximate chemical analysis
Proximate chemical analysis of fish feeds and ingredients was carried out according to AOAC (Citation1990). Dry matter (DM) was determined by drying 2 g of each sample (n = 30) to constant weight in an oven (E 115, WTB binder 7200, Tuttlingen, Germany) at 105ºC overnight (12 h). Crude protein (CP) content was quantified by the standard Kjeldahl nitrogen method (Pearson Citation1999), using a 2200 Kjeltec auto distillation unit (Foss, Tecator, Sweden). Lipid content (ether extract, EE) was quantitatively determined using petroleum ether (ST 243 SoxtecTM, Hilleroed, Denmark), crude fiber (CF) content was determined using an ANKOM 200 fiber analyzer (ANKOM, New York, USA). Ash content was determined as the residue remaining after incineration of 1 g of sample (n = 30) in a weighed porcelain crucible in a muffle furnace at 550ºC for 3 h. The following AOAC (Citation1990) methods were used: DM (930.04; 930.15); ash (930.05; 942.05), CP (954.01); EE (920.39); and CF (962.09). Nitrogen-free extract (NFE) content was calculated by subtracting the sum of crude protein, crude lipid, ash and crude fiber from the corresponding dry matter values.
Amino acid analysis
Selected feed samples (n = 17) with high CP content were packed and transported to Tanzania Veterinary Laboratory Agency in Dar es Salaam for amino acid analysis by near-infrared reflectance spectrophotometry (NIRS) (DA 7250 NIR analyzer, SE-126 53 Hägersten, Sweden) according to the manufacturer’s instructions. The samples were milled to a fine powder to pass through a sieve with 1 mm circular openings and mixed thoroughly (AOAC (Association of Official Analytical Chemists) Citation1990). Sample dishes were then filled to the brim with the milled sample, any excess sample was removed using the tool provided, and the dishes were placed on the magnetic plate of the NIRS machine. Prior to analysis, the machine was calibrated for individual amino acids according to the manufacturer’s instructions.
Data analysis
The observational data collected during the study were analyzed using the SAS statistics program (SAS (r) Proprietary Software 9.4). Descriptive statistics were run to obtain frequencies and percentages for multiple comparisons of variables. Differences between variables were based on Chi-square analysis and a significance level of 5%.
Results
Demographic characteristics of respondents
In total, 202 tilapia farmers, local fish feed producers and hatchery owners in mainland Tanzania and on Zanzibar Island were interviewed. The majority of respondents (96.0%) were located in mainland Tanzania (), with the largest number of respondents from the Ruvuma region (22.8%), followed by Arusha (18.8%), Mwanza (17.3%), and Mbeya (16.3%).
Table 1. Gender distribution of respondents in Tanzania
Overall, the majority of respondents involved in fish farming operations were males (82.7%). However, the proportion of males and females involved in the fish farming operations varied (p = .0041) from one region to another (). The mean proportion of female respondents involved in fish farming activities was 17.3%, but the figure ranged from 47.4% in Dar es Salaam to 4.3% in Ruvuma.
The majority of respondents (55.0%) were in the age group of 40–60 years old (), followed by the age group of 20–40 years (29.7%). Overall, more than 20% of respondents attained secondary (21.8%) and tertiary education (24.7%, ). However, the education level within age-group varied (p = .0171) with the highest proportion of participants with secondary education (27.0%) found in the age-group of 40–60 years and the highest proportion with tertiary education in the age-groups of 20–40 years (36.7%) and >60 years (33.3%).
Table 2. Age groups (years) and education level of respondents in Tanzania
Characteristics of the tilapia fish farming
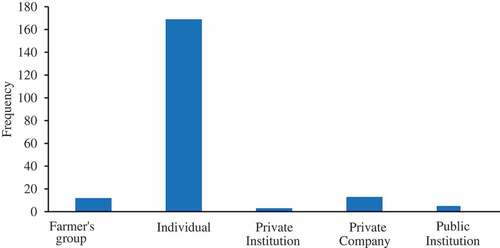
The majority of the fish farms (n = 786) were owned by individuals (76.8%) followed by private companies (19.8%) and government (3.4%), ; ). The fish farming systems were dominated by the earthen pond (67.3%), followed by concrete tanks (11.8%) and concrete ponds (10.7%) (). The average pond area was 690 m2 and the farm size ranged from 1800 to 28,600 m2 with a depth of 0.8 to 1.5 m for earthen and concrete ponds. The size of culture cages was 25 to 30 m3 with an average depth of 3 m. Earthen ponds were the dominating fish farming system in Mbeya (98.0%), Ruvuma (97.1%), Kilimanjaro (73.3%), Arusha (51.1%), and Mwanza (50.7%), while concrete ponds dominated in Dar es Salaam (42.6%) ().
Table 3. Fish farming systems and fish farm ownership in Tanzania
Table 4. Regional distribution of fish farming systems in seven different districts in Tanzania
Figure 2. Fish farm ownership in Tanzania
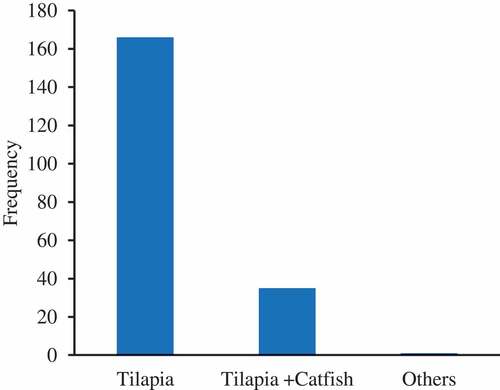
The most cultured fish species was tilapia (82.18%) in monoculture (), followed by polyculture of tilapia and catfish. The cultured fish were mostly (87.6%) raised semi-intensively under monoculture systems (). The stocking density varied significantly from one region to another (P < .0001), with most fish stocked at a rate of 2 fish/m2 (27.2%), followed by 3 fish/m2 (22.5%) and 5–9 fish/m2 (). There was great variation in the culture period to market size and the stocking density with no clear pattern linking stocking density to culture period and market size ().
Table 5. Culture practices and production systems in Tanzania
Table 6. Fish stocking density of tilapia (fish/m2) in Tanzania
Table 7. Stocking density and culture period of tilapia per production cycle in Tanzania
Figure 3. Dominant cultured fish species in Tanzania
Local feed ingredients used by fish farmers
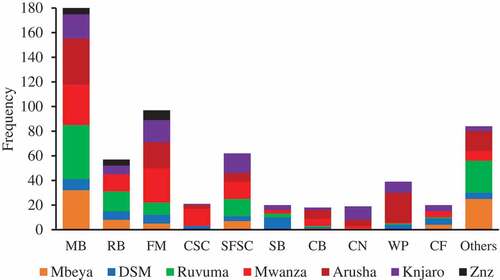
More than 80% of respondents relied on locally available feed ingredients as a major feed supplement for their cultured fish (). However, the local feed ingredients used at the study sites varied significantly (p < .0001) from one region to another depending on availability. Feed ingredient availability was determined by factors such as production season, climatic conditions, geographical zone, and accessibility. The most commonly used local feed ingredient was maize bran, followed by Lake Victoria sardines, sunflower seed cake, rice bran and wheat pollard (). In addition, a large range of other feed ingredients was used as a minor proportion of the diet such as soybean, cottonseed cake, freshwater shrimp, cattle blood, kitchen leftovers, and taro leaves. Moreover, only a minority (5–15%) of fish farmers located in urban areas, particularly Dar es Salaam, Arusha, and Mwanza, were relying on commercial fish feeds as supplement diet for their farmed fish ().
Figure 4. Local feed ingredients and commercial feeds used by tilapia fish farmers in Tanzania
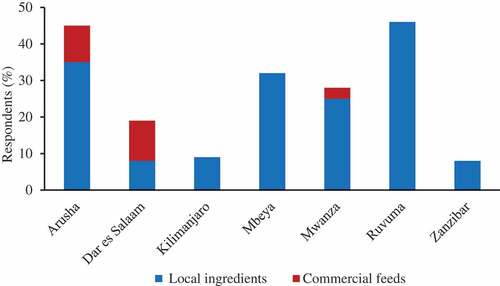
Figure 5. Local feed ingredients used by tilapia fish farmers in Tanzania. MB, maize bran; RB, rice bran; FM, fish meal (sardines); CSC, cottonseed cake; SFSC, sunflower seed cake; SB, soybean; CB, cattle blood; CN, Caridina nilotica (freshwater shrimp); WP, wheat pollard; CF, cassava flour
Proximate analysis of feed ingredients
The CP content was medium to high (300 – >500 g/kg−1 DM) in animal by-products, most agricultural by-products, plant leaves and weeds, aquatic plants and industrial by-products ().
Table 8. Chemical composition of local feed ingredient samples (g kg−1 DM)
The crude fat content was high (>100 g/kg−1 DM) in some animal by-products (e.g., Lake Victoria sardines, Nile perch fish frames, housefly maggots, earthworms), and some agricultural by-products (e.g., full fat soybean, soybean, palm seed cake, sunflower seed cake, and coconut waste), while the crude fat content in most other feed ingredients was medium to low (100 – <50 g/kg−1 DM) ().
The CF content was high in several agricultural by-products (e.g., rice bran, cottonseed cake, palm seed cake, sunflower seed cake), plant leaves and weeds (e.g., taro leaves, cassava leaves, sweet potato leaves, gallant soldier, and lettuce vegetable), aquatic plants and industrial by-products (i.e., brewery by-products). Animal by-products were low in CF (<35 g/kg−1 DM), except prawn head waste and earthworms (), which were high in CF content.
Medium-to-high content (90– 684 g/kg−1 DM) of nitrogen-free extracts (NFE) was found in agricultural by-products, aquatic plants, and industrial by-products (). The highest content of NFE was found in wheat pollard (684 g kg−1 DM), followed by spent brewer’s yeast (610 g kg−1 DM) and maize bran (576 g kg−1 DM).
There were large differences in ash contents between the feed ingredients analyzed (), with high values recorded from freshwater shrimp (588 g kg−1 DM) and Nile perch fish frames (470 g kg−1 DM). The ash content was also high (>200 g/kg−1 DM) in Lake Victoria sardines, prawn head waste, rice bran, sunflower cake, several plant leaves and weeds, and aquatic plants.
The chemical composition of commercial fish feeds sold in Tanzania showed a large variation in CP, CF and EE content (). The CP content ranged from 229 to 536 g kg−1, but was mostly in the range 229 to 334 g kg−1.
Table 9. Chemical composition (g kg−1) of commercial fish feed imports and local fish feeds available in Tanzania
Amino acid content in selected feed ingredients
Animal by-products, except for Nile perch fish frames, were high in lysine (36–64 g kg−1 DM), tryptophan (4–17 g kg−1 DM), and methionine plus cysteine (14–26 g kg−1 DM) (). Agricultural by-products (i.e., soybean and full-fat soybean), plant leaves and weeds (i.e., taro leaves, cassava leaves, sweet potato leaves, and gallant soldier weed), aquatic plants (i.e., azolla and lettuce vegetable) and spent brewer’s yeast were intermediate in lysine (21–37 g kg−1 DM) and methionine plus cysteine (4–19 g kg−1 DM), but high in tryptophan (2–15 g kg−1 DM).
Table 10. Amino acid analysis of feed ingredient samples (g kg−1 DM)
Discussion
An investigative field survey was performed from January 2017 to February 2018, to evaluate fish farming practices, and availability and chemical composition of local feed ingredients used by fish farmers in different regions of Tanzania.
Overall, the majority of respondents involved in fish farming were males (82.7%). The present finding was in agreement with findings by Mwaijande and Lugendo (Citation2015) on randomly selected respondents engaged in fish farming in Tanzania. According to FAO (Citation2014), 20% of fish farming operations in Africa are run by women, which compares well with the mean value of 17.3% found for Tanzania in the present study. However, participation by women in fish farming operations varies greatly between African countries (FAO Citation2014; Jahan et al. Citation2015; Veliu et al. Citation2009). In many tribal cultures in Tanzania, women are expected to perform reproductive roles and to take responsibility for household management, food provisioning and nursing tasks, which hinder them to participate in paid economic activities. Equal gender participation helps to increase fish farming productivity (Jahan, Ahmed, and Belton Citation2010) and fish consumption within the household (Heck, Béné, and Reyes-Gaskin Citation2007; Jahan, Ahmed, and Belton Citation2010).
In the present study, a large proportion of respondents in the age-groups of 20–40 years (50.0%), 40–60 years (55.0%) and >60 years (43.3%) had attained primary education. Similar findings were reported by Chenyambuga et al. (Citation2014) and Mwaijande and Lugendo (Citation2015). Moreover, the age distribution of the respondents, with the largest proportion aged 20–60 years, was comparable to that reported previously from the Morogoro (Chenyambuga et al. Citation2014) and for Dar es Salaam regions (Kyelu Citation2016). Overall, the majority of tilapia fish farmers surveyed owned their fish farms individually (76.8%), which was in good agreement with the findings by Chenyambuga et al. (Citation2014).
There was great variation in the size of fishponds, tanks, and cages between fish farming systems within regions, and also between regions, confirming earlier findings for Tanzania (FAO Citation2006b; Kaliba et al. Citation2006; Lamtane Citation2008; Mwaijande and Lugendo Citation2015). This can be explained by existing conditions on each farm including the nature of soils, climatic conditions, availability of labors, building materials, investment capital, and geographical location. Earthen ponds were the most common fish farming system in all regions except Dar es Salaam. Dominance of earthen pond in Tanzanian fish farming has also been reported by Kaliba et al. (Citation2006) and Rukanda and Sigurgeirsson (Citation2016).
Cultured fish were mostly (87.6%) raised semi-intensively, which was in line with other findings (Chenyambuga et al. Citation2014; Kaliba et al. Citation2006; Madalla, Agbo, and Jauncey Citation2013). In agreement with Mwaijande and Lugendo (Citation2015), we found that tilapia was the most commonly cultured fish species in Tanzania, while a limited number of fish farmers practice polyculture of tilapia and African catfish. Mixed-sex tilapia monoculture is reported to be the most economically vulnerable culture strategy, with net returns of only 2–4% (Kaliba et al. Citation2006). However, there appears to be only a marginal difference in production costs in switching from one tilapia culture strategy to another (Kaliba et al. Citation2006). Moreover, the net return increases significantly when catfish predation is introduced into mixed-sex tilapia monoculture, while switching from mixed-sex tilapia to hand-sexed all-male tilapia results in an even greater increase in net returns (Kaliba et al. Citation2006). Thus, a change in the culture system to either polyculture of mixed-sex tilapia and catfish or to hand-sexed all-male tilapia monoculture would markedly reduce the economic vulnerability, and thereby improve the robustness and sustainability, of tilapia culture in Tanzania.
There was a large variation in stocking density between fish farms within regions and also between regions, as reported previously for Tanzania (Mallya Citation2007). However, there was no clear pattern between stocking density and the culture period to market size for tilapia in the present study. The carrying capacity of a pond is determined by dissolved oxygen concentration and buildup of metabolites (e.g., ammonia) and other factors that result in poor water quality. Thus, the stocking density and feeding strategy have a major impact on fish growth rate and biomass yield. In addition, the use of mixed-sex or sex-reversed tilapia affects the culture time to market size, with a shorter culture time expected from sex-reversed tilapia due to higher growth rate (Mbiru et al. Citation2016). Moreover, in pond-cultured sex-reversed tilapia, there is a negative correlation between stocking density, growth rate and survival rate (Diana, Lin, and Yi Citation1996; Kapinga and Kasozi Citation2014). Diana, Lin, and Yi (Citation1996) observed the highest growth rate and survival rate in sex-reversed tilapia fed to 50% satiation in fertilized earthen pond and stocked with 3 fish/m2. Conversely, the highest economic return was obtained at a stocking density of 6 fish/m2 (Diana, Lin, and Yi Citation1996).
Traditionally, tilapia fish farmers in Tanzania feed their fish with locally available feed ingredients of both plant and animal origin (Chenyambuga et al. Citation2014; Kapinga and Kasozi Citation2014; Mwaijande and Lugendo Citation2015; Shoko et al. Citation2016). It was found in the present study that more than 80% of respondents relied on locally available feed ingredients as a major feed supplement for their cultured fish. This was comparable to the findings from eight regions of Tanzania reported by Mwaijande and Lugendo (Citation2015). However, the local feed ingredients used in the present study varied between regions, depending on availability. Other studies have found that the local feed ingredients most commonly used by tilapia fish farmers in Tanzania are maize bran, kitchen leftovers, garden by-products, rice bran, banana leaves, sweet potato leaves, fish meal and poultry by-products (Chenyambuga, Madalla, and Mnembuka Citation2012; Chenyambuga et al. Citation2014; Meiludie Citation2013; Mwaijande and Lugendo Citation2015). Moreover, local feed ingredients such as blood, sunflower meal, azolla meal, moringa leaf meal, cassava leaf meal, and soybean and cottonseed meal have been shown to be efficiently utilized by tilapia (John Citation2015; Madalla, Agbo, and Jauncey Citation2013). Kaliba et al. (Citation2006) reported that tilapia fish farmers in Tanzania mostly use maize bran as a supplement feed and as a manure to fertilize their fish farms. Similarly, Munguti et al. (Citation2012) reported that maize bran is a commonly used ingredient by fish farmers in Tanzania, Kenya, and Rwanda. The commonly used local feed ingredients found in our study were also similar to those reported previously for the fish farming sector across East Africa (Munguti et al. Citation2012). However, the minority of tilapia fish farmers located in urban areas like Dar es Salaam, Mwanza, and Arusha are relying on commercial fish feeds as supplement diets for their cultured fish. This situation is attributed by the availability of local feed ingredients, the high price of commercial feeds (1.08 to 1.51 $/kg of feed), and the availability of investment capital. The use of commercial feeds in fish farms leads to high production costs, accounting for more than 50% of the total production costs, which is un-economical and give a low return. Therefore, the production of fish diets by mixing up more than one local feed ingredients available close to fish farms will improve fish production and lower production costs.
The chemical composition of collected common feed ingredients was generally within the range reported by others (Chiba ; Madalla, Agbo, and Jauncey Citation2013; Mohanta, Subramanian, and Korikanthimath Citation2016; Mugo-Bundi et al. Citation2015; Munguti et al. Citation2012; Mutayoba et al. Citation2011; NRC (National Research Council) Citation2011). However, some values for individual feed ingredients varied from those reported previously for samples collected in East Africa. The high crude fat content of housefly maggots was in agreement with findings by Aniebo and Owen (Citation2010) and Pretorius (Citation2011). Munguti et al. (Citation2012) also report high crude fat content for Lake Victoria sardines and freshwater shrimps. As expected, animal by-products were low in CF content, except Nile perch fish frames, prawn head waste and housefly maggots, which had high CF content. This is an artifact related to the method used for CF analysis (McDonald et al. Citation2002). Gut material in animal by-products (except for the gastro-intestinal tract with contents) should by definition not contain plant fibers, and therefore the CF found can be explained by bones (fish) and chitin (insects) in these products, both resulting in false CF values. In general, a medium-high content of NFE was found in agricultural by-products, aquatic plants, and industrial by-products. The highest content of NFE was found in wheat pollard (684 g kg−1 DM), spent brewer’s yeast (610 g kg−1 DM) and maize bran (576 g kg−1 DM). Munguti et al. (Citation2012) reported comparable NFE values for wheat bran collected in Rwanda and Kenya, while Madalla (Citation2008) reported comparable NFE content in moringa leaves, soybean and wheat pollard from Tanzania. However, Munguti et al. (Citation2012) reported higher NFE content (591 g kg−1 DM) for maize bran in Rwanda, but considerably lower NFE content (349 g/kg−1 DM) for maize bran in Kenya. There were great differences in ash contents of feed ingredients analyzed in the present study, with very high values found in many fish by-products, but also in some agricultural by-products, plant leaves and aquatic plants. In contrast, unexpectedly low ash content was reported for Lake Victoria freshwater shrimps by Munguti et al. (Citation2012, 228 g kg−1 DM), Mugo-Bundi et al. (Citation2015, 9.8 g kg−1 DM), and Obwanga Citation2017 (19.1 g kg−1 DM). The variation in similar feed ingredients between studies can be due to many factors, such as animal species, contamination, processing, handling and storage, climate conditions, production season, geographical zone, soil type and stage of maturity at harvest (Church Citation1980).
The chemical composition of commercial fish feeds sold in Tanzania showed large variations in CP, CF, and crude fat content, as also reported for commercial fish feeds sold in Pakistan and Egypt (El-Sayed Citation2004, Citation2014; Khan et al. Citation2012). However, the CP content in the commercial feeds analyzed in the present study fell within the CP range required for proper growth of broodstock (40–45% CP), fry/fingerlings (40–50% CP), and grow-out (28–32% CP) of tilapia species (Abdel-Tawwab et al. Citation2010; Stickney Citation1997).
We found that animal by-products, except for Nile perch fish frames, were high in lysine, tryptophan, and methionine plus cysteine. Agricultural by-products (i.e., soybean and full-fat soybean), plant leaves and weeds (i.e., taro leaves, cassava leaves, sweet potato leaves, and gallant soldier weed), aquatic plants (i.e., azolla and lettuce vegetable), and spent brewer’s yeast were intermediate in lysine and methionine plus cysteine, but high in tryptophan (0.2–1.5%). This is consistent with findings reported from previous studies (Barroso et al. Citation2014; Kubiriza et al. Citation2018). According to El-Sayed (Citation2004), the essential amino acid (EAA) requirement for tilapia species is in the range 1.43–1.62% for lysine, 0.17–0.6% for tryptophan, 0.53–1.13% for methionine and 0.53–2.1% for cysteine. In other studies, the EAA requirement for cultured tilapia was estimated to be 1.0% for tryptophan, 5.1% for lysine and 2.7% for methionine (NRC Citation1993; Santiago and Lovell Citation1988; Wilson, Robinson, and Poe Citation1981). Thus, there are large discrepancies between the reported requirement for lysine, tryptophan, and methionine in tilapia. However, our findings indicate that several local feed ingredients have the potential to supply the EAA required for proper fish growth and health.
Conclusion
Novel data on nutritive value of locally available feed ingredients from different regions of Tanzania are reported. The data will provide guidance for the production of good quality feeds of low cost. Thus, a balanced essential amino acid profile can be obtained by mixing more than one local feed ingredient. This information is urgently needed to improve the production and productivity of fish farming in Tanzania. Moreover, the information can be used as a platform for the development of feeding strategies for cultured tilapia species based on locally available feed ingredients.
Acknowledgments
The authors would like to express their sincere thanks to the Tanzania’s government officials at regional, and district level in Ruvuma, Mbeya, Mwanza, Arusha, Dar es Salaam and Kilimanjaro region as well as Zanzibar Island for their support and permits for the performance of the present study. We would also express many thanks to the laboratory technicians (Mr. Alute and Michael) at Animal, Aquaculture and Range Sciences laboratory, SUA for their proximate analyses as well as Ms Doto at Tanzania veterinary laboratory agency (TVLA) for their partial amino acid analyses. Last, the authors would like to express their sincere thanks to the Swedish International Development Cooperation Agency (SIDA) for their financial support.
Disclosure statement
No potential conflict of interest was reported by the authors.
Additional information
Funding
References
- Abdel-Tawwab, M., M. H. Ahmad, Y. A. E. Khattab, and A. M. E. Shalaby. 2010. Effect of dietary protein level, initial body weight, and their interaction on the growth, feed utilization, and physiological alterations of Nile Tilapia, Oreochromis niloticus (L.). Aquaculture 298:267–74. doi:10.1016/j.aquaculture.2009.10.027.
- Alimentaruis, C. 2004. Code of practice on good animal feeding. CAC/RCP 54-2004, 1–12. Food and Agriculture Organization and World Health Organization, Rome.
- Aniebo, A. O., and O. J. Owen. 2010. Effects of age and method of drying on the proximate composition of housefly larvae (Musca domestica L.) meal (HFLM). Pakistan Journal of Nutrition 9 (5):485–87. doi:10.3923/pjn.2010.485.487.
- AOAC (Association of Official Analytical Chemists). 1990. Official methods of analysis: Association of official analytical chemists, 1230. Arlington, VA: Association of official analytical chemists-International.
- Barroso, F. G., C. de Haro, M. J. Sánchez-Muros, E. Venegas, A. Martínez-Sánchez, and C. Pérez-Bañón. 2014. The potential of various insect species for use as food for fish. Aquaculture 422:193–201. doi:10.1016/j.aquaculture.2013.12.024.
- Chenyambuga, S. W., A. Mwandya, H. A. Lamtane, and N. A. Madalla. 2014. Productivity and marketing of Nile tilapia (Oreochromis niloticus) cultured in ponds of small-scale farmers in Mvomero and Mbarali districts, Tanzania. Livestock Research for Rural Development 26:43.
- Chenyambuga, S. W., N. A. Madalla, and B. V. Mnembuka. 2012. Management and value chain of Nile Tilapia cultured in ponds of small-scale farmers in Morogoro Region, Tanzania in conjunction with 16th IIFET Conference. International Institute of Fisheries Economics and Trade.
- Church, D. C. 1980. Digestive physiology and nutrition of ruminants volume 3-practical nutrition. 2nd ed. Oregon: O & B Books, Inc.
- Diana, J. S., C. K. Lin, and Y. Yi. 1996. Stocking density and supplemental feeding. Pond Dynamics/Aquaculture CRSP. PD/A CRSP Fourteenth Annual Administrative Report, 133–38
- El-Sayed, A. F. M. 2004. Protein nutrition of farmed tilapia: Searching for unconventional sources. In New dimensions in farmed tilapia: proceedings of the Sixth International Symposium on Tilapia Aquaculture, 364–78. Manila, Philippines. World aquaculture society, Baton Rouge, Louisiana, USA.
- El-Sayed, A. F. M. 2006. Tilapia culture. Wallingford, UK: CAB International.
- El-Sayed, A. F. M. 2014. Value chain analysis of the Egyptian aquaculture feed industry. World Fish,Penang, Malaysia.Project reort: 2014-22.
- FAO. 2006b. Aquaculture production in Tanzania. FAO Fishery Statistics, Aquaculture production in 2006. Food and Agricultural organization, Roma, Italy.
- FAO. 2012. The State of World fisheries and aquaculture, 2012, 230. Rome, Italy: FAO-Food and Agriculture Organization of the United Nations
- FAO. 2014. The State of World fisheries and aquaculture: opportunities and challenges, 223. Rome: FAO-Food and Agriculture Organization of the United Nations
- FAO. 2018. The State of World fisheries and aquaculture 2018: Meeting the Sustainable Development Goals, UN, New York. doi:10.18356/8d6ea4b6-en.
- Heck, S., C. Béné, and R. Reyes-Gaskin. 2007. Investing in African fisheries: Building links to the millennium development goals. Fish Fish 8:211–26. doi:10.1111/j.1467-2679.2007.00251.x.
- Jahan, K. M., B. Belton, H. Ali, G. C. Dhar, and I. Ara. 2015. Aquaculture technologies in Bangladesh: An assessment of technical and economic performance and producer behavior, 2015–52. Penang, Malaysia: WorldFish. Program Report.
- Jahan, K. M., M. Ahmed, and B. Belton. 2010. The impacts of aquaculture development on food security: Lessons from Bangladesh. Aquaculture Research 41:481–95. doi:10.1111/j.1365-2109.2009.02337.x.
- John, M. 2015. Effect of different dietary protein sources on growth performance of Rufiji tilapia Oreochromis urolepis urolepis, Norman 1922. Master’s thesis, University of Dar es Salaam, Tanzania.
- Kaliba, A. R., K. O. Osewe, E. M. Senkondo, B. V. Mnembuka, and K. K. Quagrainie. 2006. Economic analysis of Nile tilapia (Oreochromis niloticus) production in Tanzania. Journal of the World Aquaculture Society 37 (4):464–73. doi:10.1111/j.1749-7345.2006.00059.x.
- Kapinga, E. M., and N. Kasozi. 2014. Effect of stocking density on the growth performance of sex reversed male Nile tilapia (Oreochromis niloticus) under pond conditions in Tanzania. World Journal of Fish and Marine Sciences 6 (2):156–61. doi:10.5829/idosi.wjfms.2014.06.02.82214.
- Khan, T. A., N. Khan, M. Ashraf, N. A. Qureshi, M. S. Mughal, and G. Abbas. 2012. Source, production and chemical composition of fishmeal in Pakistan. Journal of Veterinary and Animal Sciences 2:65–71.
- Kubiriza, G. K., A. M. Akol, J. Arnason, Ó. Sigurgeirsson, S. Snorrason, T. Tómasson, and H. Thorarensen. 2018. Practical feeds for juvenile Nile tilapia (Oreochromis niloticus) prepared by replacing Rastrineobola argentea fishmeal with freshwater shrimp (Caridina nilotica) and mung bean (Vigna radiata) meals. Aquaculture Nutrition 24 (1):94–101. doi:10.1111/anu.12537.
- Kyelu, A. 2016. Analysis of socio-economic and environmental effects of urban fish farming in Dar Es Salaam, Tanzania. Master’s thesis, Sokoine University of Agriculture, Tanzania.
- Lamtane, H. A. 2008. Fish ecology and yields from self-stocked finger ponds in East African wetlands. Doctoral dissertation, King’s College, University of London, London, England.
- Madalla, N. 2008. Novel feed ingredients for Nile tilapia Oreochromis niloticus L. Doctoral dissertation, University of Stirling, Scotland.
- Madalla, N., N. W. Agbo, and K. Jauncey. 2013. Evaluation of aqueous extracted moringa leaf meal as a protein Source for Nile tilapia Juveniles. Tanzania Journal of Agricultural Sciences 12:1.
- Mallya, Y. J. 2007. The effects of dissolved oxygen on fish growth in aquaculture. The United Nations University, fisheries training programme, Final project, 30.
- Mamum-Ur-Rashin, M., B. Belton, M. Phillips, and K. A. Rosentrater (2013). Improving aquaculture feed in Bangladesh: From feed ingredients to farmer profit to safe consumption. Agricultural and Biosystems Engineering Publications. Paper 388.
- Mbiru, M., S. M. Limbu, S. W. Chenyambuga, H. A. Lamtane, R. Tamatamah, N. A. Madalla, and A. W. Mwandya. 2016. Comparative performance of mixed-sex and hormonal-sex-reversed Nile tilapia Oreochromis niloticus and hybrids (Oreochromis niloticus× Oreochromis urolepis hornorum) cultured in concrete tanks. Aquaculture International 24 (2):557–66. doi:10.1007/s10499-015-9946-z.
- McDonald, P., R. A. Edwards, J. F. D. Greenhalgh, and C. A. Morgan. 2002. Animal nutrition, 583–89. 6th ed. Essex, UK: Pearson Education Limited.
- Meiludie, E. E. 2013. Comparative evaluation of growth performance and yield of four tilapia species under culture conditions. Master’s thesis, Sokoine University of Agriculture, Tanzania.
- Mohanta, K. N., S. Subramanian, and V. S. Korikanthimath. 2016. Potential of earthworm (Eisenia foetida) as dietary protein source for rohu (Labeo rohita) advanced fry. Cogent Food and Agriculture 2 (1):1138594. doi:10.1080/23311932.2016.1138594.
- Mugo-Bundi, J., E. Oyoo-Okoth, C. C. Ngugi, D. Manguya-Lusega, J. Rasowo, V. Chepkirui-Boit, M. Opiyo, and J. Njiru. 2015. Utilization of Caridina nilotica (Roux) meal as a protein ingredient in feeds for Nile tilapia (Oreochromis niloticus). Aquaculture Research 46 (2):346–57. doi:10.1111/are.12181.
- Munguti, J., H. Charo-Karisa, M. A. Opiyo, E. O. Ogello, E. Marijani, L. Nzayisenga, and D. Liti. 2012. Nutritive value and availability of commonly used feed ingredients for farmed Nile tilapia (Oreochromis niloticus L.) and African catfish (Clarias gariepinus, Burchell) in Kenya, Rwanda and Tanzania. African Journal of Food, Agriculture, Nutrition and Development 12 (3):6135–55.
- Munguti, J. M., D. M. Liti, H. Waidbacher, M. Straif, and W. Zollitsch. 2006. Proximate composition of selected potential feed ingredients for Nile tilapia (Oreochromis niloticus Linnaeus.) production in Kenya. Die Bodenkultur 57 (3):131–41.
- Munguti, J. M., E. O. Ogello, D. Liti, H. Waidbacher, M. Straif, and W. Zollitsch. 2014. Effects of pure and crude papain on the utilization and digestibility of diets containing hydrolysed feather meal by Nile tilapia (Oreochromis niloticus L.). International Journal of Advanced Research 2 (6):809–22.
- Mushi, V. E. 2006. National aquaculture sector overview. United Republic of Tanzania. National Aquaculture Sector Overview Fact Sheets. FAO Fisheries and Aquaculture Department [online], Rome. Updated, 23.
- Mutayoba, S. K., E. Dierenfeld, V. A. Mercedes, Y. Frances, and C. D. Knight. 2011. Determination of chemical composition and anti-nutritive components for Tanzanian locally available poultry feed ingredients. International Journal of Poultry Science 10 (5):350–57. doi:10.3923/ijps.2011.350.357.
- Mwaijande, F. A., and P. Lugendo. 2015. Fish-farming value chain analysis: Policy implications for transformations and robust growth in Tanzania. The Journal of Rural and Community Development 10 (12):47–62.
- Nalwanga, R., D. M. Liti, H. Waidbacher, J. Munguti, and W. J. Zollitsch. 2009. Monitoring the nutritional value of feed components for aquaculture along the supply chain–An East African case study. Livestock Research for Rural Development 21 (9). Available at: www.Irrd.org/Irrd21/9/nalw21148.htm
- Nasim Al Mahmud, M. D., M. B. Hossain, and M. H. Minar. 2012. Proximate composition of fish feed ingredients available in Lakshmipur Region, Bangladesh. American-eurasian Journal of Agricultural and Environmental Science 12 (5):556–60. 2012.
- Nguyen, T. N. 2008. The utilization of soybean products in Tilapia feed - A review. 8th International Symposium on Tilapia in Aquaculture, 53–65. The central laboratory for aquaculture research, Cairo.
- NRC (National Research Council). 1993. Nutrient requirements of fish, 114. Washington D.C.: National Research Council, Academy of Sciences, National Academy Press.
- NRC (National Research Council). 2011. Nutrient requirements of fish and shrimp. US states: National academies press.
- Obwanga, O. B. 2017. The efficacy of selected plant materials in formulated diets for Nile tilapia, Oreochromis niloticus. Master’s thesis, Egerton University, Kenya.
- Ogello, E. O., J. M. Munguti, Y. Sakakura, and A. Hagiwara. 2014. Complete replacement of fish meal in the diet of Nile tilapia (Oreochromis niloticus L.) grow-out with alternative protein sources. A review. International Journal of Advanced Research 2 (8):962–78.
- Pearson, D. 1999. Pearson’s composition and analysis of foods. Reading, UK: University of Reading.
- Pretorius, Q. 2011. The evaluation of larvae of Musca domestica (common housefly) as protein source for broiler production. Master’s thesis, Stellenbosch University, Stellenbosch, South Africa.
- Rukanda, J. J., and O. Sigurgeirsson. 2016. Evaluation of aquaculture development in Tanzania-ANU_FTP. The United Nations University, fisheries training programmer, Final project, 39.
- Santiago, C. B., and R. T. Lovell. 1988. Amino acid requirements for growth of Nile tilapia. The Journal of Nutrition 118 (12):1540–46. doi:10.1093/jn/118.12.1540.
- Shoko, A. P., S. M. Limbu, H. D. J. Mrosso, A. F. Mkenda, and Y. D. Mgaya. 2016. Effect of stocking density on growth, production and economic benefits of mixed sex Nile tilapia (Oreochromis niloticus) and African sharp tooth catfish (Clarias gariepinus) in polyculture and monoculture. Aquaculture Research 47 (1):36–50. doi:10.1111/are.12463.
- Sindirações. 2005. Compêndio Brasileiro de Alimentação Animal. Guia de Métodos Analíticos. 5–9 doi:10.1080/14756360400002023
- Stickney, R. R. 1997. Tilapias update 1996. World Aquaculture 28:20–25.
- Tacon, A. G., M. Metian, and M. R. Hasan. 2009. Feed ingredients and fertilizers for farmed aquatic animals: Sources and composition (No. 540). Rome, Italy: Food and Agriculture Organization of the United Nations (FAO)
- TNBS (Tanzania National Bureau of Statistics). 2012. National Bureau of Statistics in Tanzania, Population and housing census of 2012: Sub-division population projection by year 2016/2017. National bureau of statistics, Dar es Salaam, Tanzania.
- URT (United Republic of Tanzania). 2019. United republic of Tanzania: Budget speech 2019/2020. Ministry of Livestock and fisheries, Dodoma, Tanzania.
- Veliu, A., N. Gessese, C. Ragasa, and C. Okali. 2009. Gender analysis of aquaculture value chain in northeast Vietnam and Nigeria. Agriculture and Rural Development Discussion Paper 44. The World Bank, Washington.
- Wilson, R. P., E. H. Robinson, and W. E. Poe. 1981. Apparent and true availability of amino acids from common feed ingredients for channel catfish. Journal of Nutrition 111 (5):923. doi:10.1093/jn/111.5.923.