Abstract
Emissions factors are important for estimating and characterizing emissions from sources of air pollution. There is no quantitative indication of uncertainty for these emission factors, most factors do not have an adequate data set to compute uncertainty, and it is very difficult to locate the data for those that do. The objectives are to compare the current emission factors of Electric Generating Unit NOX sources with currently available continuous emission monitoring data, develop quantitative uncertainty indicators for the Environmental Protection Agency (EPA) data quality rated emission factors, and determine the possible ranges of uncertainty associated with EPA's data quality rating of emission factors. EPA's data letter rating represents a general indication of the robustness of the emission factor and is assigned based on the estimated reliability of the tests used to develop the factor and on the quantity and representativeness of the data. Different sources and pollutants that have the same robustness in the measured emission factor and in the representativeness of the measured values are assumed to have a similar quantifiable uncertainty. For the purposes of comparison, we assume that the emission factor estimates from source categories with the same letter rating have enough robustness and consistency that we can quantify the uncertainty of these common emission factors based on the qualitative indication of data quality which is known for almost all factors. The results showed that EPA's current emission factor values for NOX emissions from combustion sources were found to be reasonably representative for some sources; however, AP-42 values should be updated for over half of the sources to reflect current data. The quantified uncertainty ranges were found to be 25–62% for A rated emission factors, 45–75% for B rated emission factors, 60–82% for C rated emission factors, and 69–86% for D rated emission factors, and 82–92% for E rated emission factors.
Currently, a letter grade indicates the data quality uncertainty of emission factors in EPA's Compilation of Emission Factors (AP-42). However, a quantitative characterization would be much preferred. If the uncertainty of emission factors is quantified, scientists may be able to more accurately characterize the uncertainty associated with air quality modeling and emission data. A quantitative measure of uncertainty will also give decision makers the ability to determine the confidence that should be placed in the analysis of the data being used for policy decisions.
Introduction
Emission factors are important for estimating and characterizing emission sources of air pollution. Emissions are being released into the air every day from different sources and are monitored in various ways. Emission factors are generally estimated from an average of all available data (CitationU.S. Environmental Protection Agency, 1995). However, the majority of emission factors are based off estimates created by the U.S. Environmental Protection Agency (EPA) in years past, using data of various quality and quantities. The EPA has compiled emission factors in a document entitled, Compilation of Air Pollutant Emission Factors (CitationEPA, 1995) (AP-42). These factors are basically averages from available source tests. In many cases, the available source tests are from a very small sample set. Since we don't have numerous tests from a variety of sources to estimate an emission factor, the minimal numbers of available tests leads to uncertainty in the emission factors. A letter rating has been given for each emission factor estimated by the EPA to represent a general indication of the reliability or robustness of the emission factor and is assigned based on the estimated reliability of the tests used to develop the factor and on both the quantity and representativeness of the data. Different sources and pollutants that have the same robustness and reliability in the measured emission factor and in the representativeness of the measured values are given the same rating. The AP-42 emission factor rating is based on two factors. First, the quality of the test data used to create the emission factor is given a letter rating from A to D. These are defined in .Second, the ability of the factor to represent a national average emission factor for that category is assessed. These two pieces of information are then used to define the A to E letter rating of AP-42, which are defined in The AP-42 emission factor estimates represent an average estimate of the emission factors from all units of a given Source Classification Code (SCC) (CitationGluck et al., 2003). In many cases, the limited number of reliable data points leads to increased uncertainty in the emission estimates. The nature of the letter rating indicator does not provide a quantitative assessment of uncertainty of emission inventories used in air quality modeling applications. An EPA report from the office of the inspector general (CitationU.S. Environmental Protection Agency, 2006) specifically recommended that EPA establish a rating system that provides the quantitative range of uncertainty for emission factors for both inventory and noninventory purposes. The objective of this study was to explore potential options to statistically and objectively quantify the uncertainty of emission factors for inventory purposes. The focus of the first part of this study was on nitrogen oxide (NOx) emissions from electric generating units (EGUs), which is probably the best-tested and characterized of any pollutant and source category combinations. The EGUs of interest in this study that produce NOx use coal, oil, or natural gas as a fuel in an external combustion boiler to generate electricity.
Table 1. Definition of ratings used for test data quality rating
Table 2. Definition of AP-42 emission factor ratings
Key terms for this study
| • | Emission uncertainty—the uncertainty associated with the emissions calculated for a pollutant and source category. | ||||
| • | CEMS—Continuous Emission Monitoring Systems, a method for continuously monitoring emissions and collecting data averaged over intervals of a few minutes. | ||||
| • | Emission factor—a representative value that attempts to relate the quantity of a pollutant released to the atmosphere with an activity associated with the release of that pollutant. | ||||
| • | AP- 42—this publication series is the principal means by which the EPA documents and distributes its emission factors. | ||||
| • | SCC—Source Classification Code, an 8-digit number, or 10 digits for area sources, which the EPA uses to classify various source categories. It provides a way to categorize emission sources in a consistent way when creating an emission inventory. | ||||
| • | WebFIRE—the EPA's online database that attempts to catalog descriptions of SCCs and their emission factors. | ||||
| • | Standard z-score—the number of standard deviations an observation (or mean of observations) is away from the actual mean; often used in statistics for calculating probabilities of seeing extreme values. | ||||
Problem
Currently, statistical quantification of the uncertainty of emission factors provided in AP-42 is not available. Quantifying the uncertainty of emission factors would enable the scientific community to apply them more meaningfully. Using a quantitative characterization of emission factor uncertainty, scientists will be able to more accurately characterize the uncertainty associated with air quality modeling and emission inventories. A quantitative measure of uncertainty will also give decision makers the ability to determine the confidence that should be placed in the analysis of the data being used for policy decisions.
Objectives and assumptions
This study consisted of three main objectives and a separate phase of the study addressed each objective:
(1) Compare the NOx emission factors from combustion sources with currently available continuous emission monitoring data. CEMS data have been shown to be accurate to within 5% (CitationGluck et al., 2003). | |||||
(2) Develop quantitative uncertainty indicators for A- through E-rated data quality indicators for emission factors based on NOx emissions from combustion sources. | |||||
(3) Estimate a range of uncertainty associated with the A through E ratings by applying the methods from Phase II to additional sources and pollutants. | |||||
Although there are different emission factors for different pollutants and different source categories, there are some “common” characteristics of the emission factors that have been assigned the same “letter rating” for their data quality indicator. This letter rating represents a general indication of the reliability or robustness of the emission factor and is assigned based on the estimated reliability of the tests used to develop the factor and on both the quantity and representativeness of the data. Different sources and pollutants that have the same robustness and reliability in the measured emission factor and in the representativeness of the measured values are assumed to have a similar quantifiable uncertainty. For the purposes of comparison, we are assuming that the emission factor estimates from source categories with the same letter rating have enough robustness and consistency that we can quantify the uncertainty of these common emission factors based on the qualitative indication of data quality that is known for almost all factors. Thus, we will try to infer an uncertainty for all emission factors based on their qualitative data quality indicator by the quantitative analysis of a subset of the data. Although this assumption can be challenged, this paper still provides a framework for the comparison of emission factors from multiple sources and pollutants. These results could be refined if additional data become available.
Database
In order to analyze the variability of NOx emission factors from EGU point sources, several databases of information needed to be combined. First, the CEMS monitoring data from the EPA's Clean Air Markets Division contain hourly NOx emission rates in pounds of NOx per million British thermal units (lbs/106 BTU) (EPA, 2009). Second, the Department of Energy's Energy Information Administration has monthly fuel information for selected point source EGUs (CitationU.S. Department of Energy, 2009). This set of data includes the quantity for fuel consumed per month at a given plant and the heat content of the fuel (106 BTU/ton of fuel). The EPA's National Emission Inventory contains plant information, including stack parameters and the Source Classification Codes for these point sources (EPA, 2009). All three databases use the Department of Energy's Office of Regulatory Information Systems (ORIS) identification code, a unique robust primary key, to identify specific EGU plants by individual boiler. By using this common identifier to join the databases, a NOx emission factor (in tons of NOx per ton of fuel consumed) was calculated on an hourly basis for all plant/boilers that are common to the three databases. Hours in which the plant was operating for only a fraction of an hour (startup and shutdown) were discarded. In addition, only CEMS records marked “measured” were included. All estimated values in the CEMS database were discarded. Thus, a new database containing hourly computed NOx emission rates comparable to the AP-42 emission factors for all the facilities in the United States was created. The relevant sections of AP-42 are chapters 1.1 through 1.4. The actual emission factors from AP-42 were extracted from EPA's WebFIRE, rather than the actual text of AP-42. These emission factors are for “uncontrolled” sources. Uncertainties may exist in the measurements in the CEMS database. However, the CEMS data are considered to be reliable to within 5% (CitationGluck et al., 2003), so this analysis did not take any possible uncertainties associated with the CEMS database into concern. The years of data were 1997 to 2007. There were data for 52 different SCCs in the initial data set.
Phase I
Approach
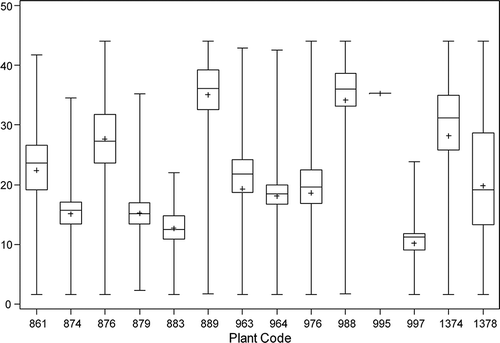
To create a database where emission factors from different SCCs could be compared, all AP-42 values were standardized to lbs of NOx per million BTU (lbs/106 BTU). This standardization was done in order to ensure that values of the same units were being compared during the analysis. Once the data were properly formatted, the data analysis for this article was performed using SAS software, version 9 of the SAS System for Unix. (SAS Institute Inc., Cary, NC, USA). summarizes the SCCs used in this study. The top 2% of NOx emission factor values from each SCC were removed. The decision to do this trim was based on a previous study of volatile organic compounds emissions from petrochemical plants, in which the researchers attributed extraneous ambient air quality values to equipment malfunctions or some abnormal operation (CitationCamalier et al., 2004). The top 2% of emission factor values from each SCC were removed rather than the top 2% of values from each plant, because only a few plants in each SCC appeared to have extraneous values. The bottom 2% of emission factor values were also removed from the database because of a large number of 0 values, which were attributed to errors or plant shutdowns. and show the box plots of all the plants for one SCC before and after trimming the data. Only one plant appeared to have any extraneous values for this SCC. This example shows why the top and bottom 2% were removed from the data sets.
Table 3. Summary statistics of the 21 different SCCs
Figure 1. SCC 10100203 (bituminous coal, cyclone furnace) boxplots by plants before 2% trim. The NOx emission factor is in units of lbs/ton.
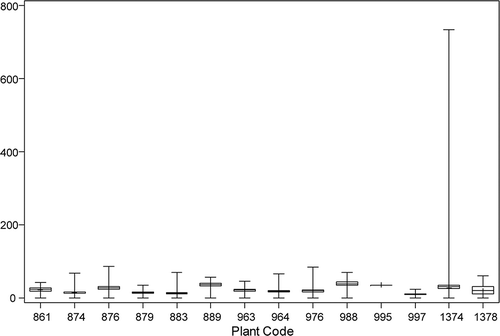
Figure 2. SCC 10100203 (bituminous coal, cyclone furnace) boxplots by plants after 2% trim. The NOx emission factor is in units of lbs/ton.
After careful inspection of the data, it appeared there were issues with the quality as a result of some EGUs having multiple SCCs (e.g., multiple fuels). When this was the case, the most dominant SCC was kept and the others were thrown out of the analysis. Deciding which SCC was dominant was based on whether it had the most hours of operation and if it had at least an order of magnitude (i.e., a factor of 10) greater in emissions than any other SCC for a particular boiler. In the process of cleaning up the data set, the influence of starter fuels and duplicate values were removed. As a result, a total of 13 SCCs were entirely removed from the database.
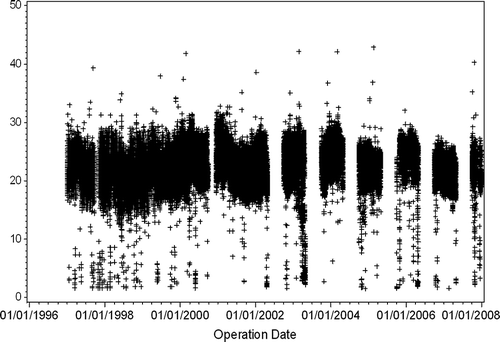
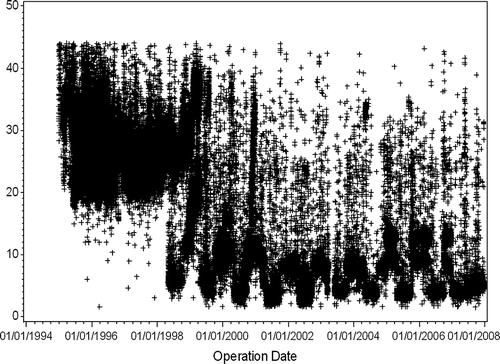
Between the years 2002 and 2007, some plants phased in controls between May 1 and September 30 through the various control strategies. For this reason, data from these plants were removed from the analysis, since only uncontrolled, or as combusted, emission factors were of interest because this is the basis for the AP-42 emission factors. To determine which plants were in fact phasing in controls, time plots of every plant of every SCC were produced using SAS programming and were carefully observed. is a time plot of NOx emission factors for plant 963 of SCC 10100203, where periods of controls clearly began in 2003. shows the results of removing the controlled data. and are likely examples of plants that employed either noncatalytic or selective catalytic reduction of NOx with ammonia to achieve the emission reductions. Since the facilities were required to reduce emissions only during specified periods, they reduced their overall cost by not operating the equipment at all times.
Figure 3. Time plot of NOx emission factors for SCC 10100203, plant 963 (bituminous coal, cyclone furnace), with control period included; in lbs/ton.
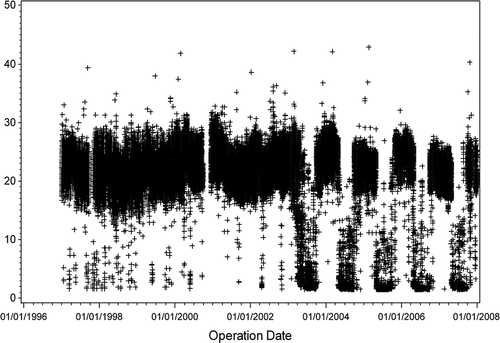
Figure 4. Time plot of NOx emission factors for SCC 10100203, plant 963 (bituminous coal, cyclone furnace), with control period not included; in lbs/ton.
Upon looking through each individual plant of each SCC, some plants appeared to have controls in during every month of the year starting at varying dates around the year 2000. Plants that exhibited this trend had data removed starting at the dates in which controls clearly looked present. is a time plot of one plant in which controls looked present throughout the year beginning in April 1998. These screening techniques eliminated data from facilities that may have changed their operating characteristics during the study period. A subsequent study of the efficiency of postcombustion control equipment may be desirable, but this study was limited to as combusted emission factors for comparison to AP-42 values
Figure 5. Time plot of NOx emission factors for SCC 10100203, plant 2364 (bituminous coal, cyclone furnace), with control period included; in lbs/ton. Data were removed from this plant beginning on April 1, 1998.
Although some SCCs had over 100 plants, others had as few as 1 or 2 plants. SCCs with only 1 or 2 plants were removed from the analysis due to insufficient amounts of data. With this removal of SCCs from the analysis as well as SCCs previously being removed due to starter fuels and other issues, the final analysis only consisted of 21 different SCCs. However, the number of observations for the 21 SCCs used in this analysis accounted for about 77% of the total number of observations in the original database. Of these 21 SCCs, 12 were coal, 3 were oil, and 6 were natural gas.
After the data were properly formatted and appropriate data were removed from each plant, SAS programming was used to compute the mean emission factor for each SCC. The percent difference between the mean emission factor and AP-42 value were then computed to determine how well the values in AP-42 compared to the continuous emission data. The fundamental approach here is to compare existing AP-42 emission factors with CEMS emission factors. AP-42 emission factors are “uncontrolled or as combusted” by definition. The efficiency of control devices is determined by other means and applied after the emission factor.
Results and discussion
After looking at the percent difference between the AP-42 emission factor and the mean NOx emission factor for each SCC, based on this analysis of CEMS data, it is clear that many of the AP-42 values were significantly different from the CEMS values. Although 13 of the 21 SCCs in this study received AP-42 letter grades of A, the majority of the percent differences between the AP-42 emission factor values and the means were substantially large (greater than 50%), as shown in The discrepancy between the two is likely due to the fact that some of the NOx emission factors from the AP-42 were last updated in September 1998 and other factors were last updated even earlier, and technology has improved and changed since then (CitationEPA, 1995).
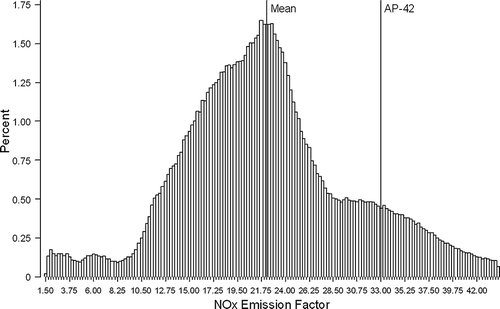
Many of the AP-42 emission factors need updating to reflect the CEMS emission measurements. There were 62% of SCCs that had a percent difference between EPA's AP-42 emission factor and mean of continuous emission data greater than ±25%. There were 29% of SCCs that had a percent difference between EPA's AP-42 emission factor and mean of continuous emission data greater than ±50%. There were 14% of SCCs had a percent difference between EPA's AP-42 emission factor and mean of continuous emission data greater ±100%. For example, SCC 10100203, as shown in , received an A data quality rating for the AP-42 letter grade. For this SCC, however, the AP-42 emission factor is 48% above the mean emission factor of the CEMS data. The continuous NOx emission factor data for this SCC being reasonably normally distributed with the AP-42 emission factor far above the mean suggests the AP-42 value needs to be updated for this particular SCC. Based on the analysis of Phase I, several of the AP-42 emission factor values for the 21 SCCs in this study need to be updated to reflect the currently available continuous NOx emission data.
Figure 6. Distribution of NOx emission factors for SCC 10100203 (bituminous coal, cyclone furnace), with the mean emission factor and AP-42 emission factor labeled. Units are in lbs/ton.
Phase II
Approach
Calculating uncertainty values
The goal of Phase II of this research was to develop a quantitative measure of uncertainty for each of the EPA's qualitative letter grades currently being used as data quality indicators. In order to do this, a few assumptions had to be made about what characterized an AP-42 emission factor as either an A, B, C, D, or E data quality rating. shows the assumed sample sizes associated with each of the data quality ratings (CitationEPA, 1997). We included the sample size assumptions that were made because they were not explicitly stated in the AP-42 documentation. Different assumed sample sizes associated with each letter grade would result in a different analysis. For this analysis, as noted earlier, there are two key factors associated with the data quality rating (CitationEPA, 1995):quality of the testing method, and (CitationGluck et al., 2003) representativeness of the factor for a national emission inventory. Since these data are from multiple facilities, we feel that our large data sample is representative for a national emission inventory, satisfying factor 2. All the data used were from CEMS, implying that the quality of the data were consistent for the entire data set. We used a varying sample size as indicated in to simulate the AP-42 emission factor rating of A through E. The level of uncertainty for each of the 5 sample sizes, n, for each SCC was calculated to be the probability that a sample mean of a sample of size n will not be within 10% of the population mean:
Table 4. Letter grades and assumed associated sample sizes
where refers to the sample mean; μ is the population mean; σ is the population standard deviation; and Z is the standard z-score. We use this definition of uncertainty rather than one based only on the standard deviation because this definition is dimensionless and thus easier to interpret. The population mean and standard deviation for each SCC was assumed to be the calculated emission factor mean and standard deviation of the entire SCC, since the CEMS data consisted of such an enormous number of observations. SAS programming was used to compute the probabilities from eq 4 for each SCC.
This approach, however, does depend on normality. Calculating probabilities about sample means from the standard normal distribution assumes the sampling distribution is normal. A sampling distribution will be normal if the population distribution is normal, or if the sample size is large, no matter what the population distribution. An A data quality rating is assumed to have a sample size of 25, which can be considered large enough for a representative characterization of the source category. However, D and E ratings are assumed to have sample sizes of 3 and 1, respectively. These small sample sizes pose some problems, since not all of the SCCs were normally distributed. To check the theoretical calculations, bootstrap methods through SAS programming were used for some of the very non-normal SCCs. Ten thousand samples for each of the 5 sample sizes were simulated for the selected SCCs and the means were calculated. For each sample size for these SCCs, the level of uncertainty was calculated to be the percentage of sample means out of 10,000 that did not fall within 10% of the population mean (the mean of the entire SCC). These uncertainty values matched up extremely well with the theoretically calculated uncertainty values, even for very small sample sizes. It was concluded that using the theoretically calculated uncertainties as opposed to using bootstrap methods for every SCC would make no difference in this study, particularly since rounding was to be done. The letter grade uncertainties for each SCC were then averaged to create overall uncertainties for the five letter grades and then rounded.
Results and discussion
Uncertainty was defined as the probability that a sample mean of a sample of size n, where n is 25, 10, 5, 3, or 1, will not be within 10% of the true mean. shows the uncertainties for the five letter grades for all 21 SCCs. These provide quantitative metrics for the letter grades. The rounded average uncertainty for an A rating is 25%. This means that if an SCC received an A rating (assuming an A rating means a sample of size 25 was taken to compute the AP-42 emission factor), there is about a 25% chance the sample mean will not be within 10% of the true emission factor mean. On the other hand, if an SCC receives an E rating (assuming an E rating means a sample size of only 1 was taken), there is about an 80% chance the sample mean will not be within 10% of the true emission factor mean.
Table 5. SCCs and their corresponding uncertainties for A through E letter grades
Phase III
Approach
To determine the possibility of applying the uncertainties associated with the different letter grades for NOx emissions to other pollutants, another data set consisting of various pollutants and source categories was analyzed. This new data set is from the study by Research Triangle Institute (RTI) International for EPA and included emission factor data for 44 different pollutant and source category combinations (CitationRTI International, 2007). The uncertainty values for the five letter grades were calculated for each of these pollutant and source category combinations as described under Phase II. The uncertainties for each of the letter grades were averaged across pollutant and source category combination. These letter grade uncertainty averages were then combined with the uncertainties calculated in Phase II to construct overall uncertainty ranges for each of the five letter grades that could possibly be applied to any pollutant.
Results and discussion
shows the 44 different pollutant and source category combinations used in the previous study along with the calculated uncertainties for each letter grade. These sets of data yielded higher uncertainty values than the previous data set, which is due to most of the pollutant and source category combination distributions being log-normal. A log-normal distribution, as shown in , is skewed right with the bulk of the data, as well as the mean, to the left. As described earlier, this leads to larger uncertainties. The uncertainties for each pollutant and source category from Phases II and III were combined into a single table (the data in and ). The interquartile range of the uncertainty for each letter grade from this table was used to estimate the overall range of uncertainty associated with that letter grade. These overall ranges of uncertainty are shown in According to these calculated uncertainty ranges, an A-rated sample of emission factors, assuming the sample size was 25, would have between 25% and 62% uncertainty associated with it. In other words, if a sample of size 25 emission test data sets for any pollutant is taken, the probability that the sample mean is not within 10% of the true mean is between 25% and 62%.
Table 6. Emission factor data quality rating uncertainties for the different pollutant and source category combinations
Table 7. Uncertainty ranges (the interquartile range) for emission factor data quality indicators
Figure 7. Hot mix batch filterable PM—example of a log-normal distribution. The emission factor units are lbs/ton.
Summary and Conclusions
NOx emission factors from EGUs were computed from CEMS data as well as EPA and Department of Energy (DOE) data sets and compared to AP-42 emission factors. The inconsistency between the emission factors from CEMS data and the AP-42 emission factors for several SCCs suggests that AP-42 needs to be updated to reflect the NOx continuous emission data now available for EGUs. This also indicates that substantial targeted and prioritized parametric source testing needs to be done on many source categories and pollutants to provide a reliable database to develop new and better quality emission factors. Uncertainty values were calculated for each letter grade for each SCC, under the assumption that certain sample sizes were associated with the letter grades.
Uncertainty was calculated as the probability that a sample mean from a sample of size n will not be within 10% of the true emission factor mean. To determine the possibility of applying the letter grade uncertainties computed for NOx emissions from EGUs to other pollutants and source categories, another data set with various combinations of pollutants and source categories was analyzed. Uncertainties for each letter grade were calculated for the new data set and compared to those calculated from the continuous NOx emission data from EGUs. Uncertainty ranges were then computed based on analysis of the two data sets.
For the AP-42 data quality ratings, the quantified uncertainty ranges were 25–62% for A-rated emission factors, 46–75% for B-rated emission factors, 60–82% for C-rated emission factors, 69–86% for D-rated emission factors, and 82–92% for E-rated emission factors. These uncertainty ranges represent a typical range of that could be used for other sources and categories when only a letter rating is available. Using these uncertainty estimates for emissions will enable quantification of uncertainty estimates for air quality modeling and emission inventories. This quantitative measure of uncertainty will also give decision makers the ability to determine the confidence that should be placed in the analysis of the data being used for policy decisions. Chapter 2 of the 2006 EPA report from the Office of the Inspector General (CitationEPA, 2006) explains why use of unreliable emission factors adversely impacts key environmental decisions.
Acknowledgments
The authors acknowledge Alissa Anderson, Colin Geisenhoffer, Brody Heffner, and Michael Shaw from North Carolina State University for their previous work on this project in ST 495 and ST 498 Environmental Data Analysis Class in Fall 2009 and Spring 2010. They also acknowledge Jenise Swall and Kristen Foley of EPA for their statistical advice and input. Further, CSC is acknowledged for their support for preparation of the initial NOx combustion database. In addition, Barrett Parker of EPA is acknowledged for his support of the project and for use of the data from RTI for other pollutants and source categories. The EPA through its Office of Research and Development funded and managed the research here. It has been subjected to the Agency's administrative review and approved for publication.
References
- Camalier, L., B. Yoshimoto, and B. Stines. 2004. A statistical method to corroborate VOC emission inventories using air quality data—applied to Houston and Atlanta. In Undergraduate Research Journal of North Carolina State University, 1st ed. Raleigh: North Carolina State University; pp 44–50 http://www.ncsu.edu/undergrad-research/urj/ (http://www.ncsu.edu/undergrad-research/urj/) (Accessed: 1 November 2009 ).
- Gluck , S. , Glenn , C. , Logan , T. , Vu , B. , Walsh , M. and Williams , P. 2003 . Evaluation of NOx Flue Gas Analyzers for Accuracy and Their Applicability for Low-concentration Measurements . Journal of the Air & Waste Management Association , 53 : 749 – 758 .
- RTI International. 2007. Emissions Factor Uncertainty Assessment. RTI International: Research Park Triangle, NC; 4-5-4-6) http://www.epa.gov/ttn/chief/efpac/uncertainty.html (http://www.epa.gov/ttn/chief/efpac/uncertainty.html) (Accessed: 2 April 2010 ).
- U.S. Department of Energy. 2009. Form FERC-423 Database. Monthly Cost and Quality for Fuels and Electric Generating Units http://www.eia.doe.gov/cneaf/electricity/page/ferc423.html (http://www.eia.doe.gov/cneaf/electricity/page/ferc423.html) (Accessed: 1 November 2009 ).
- U.S. Environmental Protection Agency. 1995. Compilation of Air Pollutant Emission Factors. Research Triangle Park, NC: U.S. Environmental Protection Agency http://www.epa.gov/ttn/chief/ap42 (http://www.epa.gov/ttn/chief/ap42) (Accessed: 1 November 2009 ).
- U.S. Environmental Protection Agency. 1997. Procedures for Preparing Emission Factor Documents. Triangle Park, NC: Office of Air Quality Planning and Standards Research, 4–24 http://www.epa.gov/ttn/chief/efdocs/procedur.pdf (http://www.epa.gov/ttn/chief/efdocs/procedur.pdf) (Accessed: 2 April 2010 ).
- U.S. Environmental Protection Agency, March 22. 2006. Evaluation Report: EPA Can Improve Emissions Factors Development and Management. 2006-P-00017. Office of Inspector General. U.S. Environmental Protection Agency: Washington, DC http://www.epa.gov/oig/reports/2006/20060322-2006-P-00017.pdf (http://www.epa.gov/oig/reports/2006/20060322-2006-P-00017.pdf) (Accessed: 9 November 2011 ).
- U.S. Environmental Protection Agency. 2009. Continuous Emissions Monitoring Systems Data http://camddataandmaps.epa.gov (http://camddataandmaps.epa.gov) (Accessed: 1 November 2009 ).
- U.S. Environmental Protection Agency. 2009. Emissions Inventories. Technology Transfer Network: Clearinghouse for Inventories & Emissions Factors http://www.epa.gov/ttn/chief/eiinformation.html (http://www.epa.gov/ttn/chief/eiinformation.html) (Accessed: 1 November 2009 ).