
ABSTRACT
Teacher dashboards provide real-time information about students’ performance and progress, which help K-12 teachers to adjust feedback to student’ specific needs during learning. Prior research indicated two problems with respect to how teachers provide feedback: (i) teachers do not always select the most effective feedback to support student’ learning and (ii) feedback is not allocated equally to students with different abilities. Specifically, process feedback is considered most effective yet is relatively scarce. In order to understand how dashboards influence the type and allocation of feedback, we compared characteristics of feedback given after dashboard consultation (dashboard-prompted feedback) to feedback triggered by teachers themselves or in response to students’ questions (human-prompted feedback) in thirty-five K-12 classrooms. Results showed that dashboards led to equal amounts of task and process feedback, while human-prompts led to much more task than process feedback and this difference was especially large for low-ability students. Hence the different types of dashboard-prompted feedback were more equally distributed among students of different ability levels. These results indicate that dashboards can have an important equalizing effect on teacher feedback practices.
Introduction
Feedback is considered one of the most powerful ways to support students’ learning (Hattie, Citation2012). Yet, teachers do not always provide the most appropriate feedback (Hattie, Citation2012; Keuvelaar-van den Bergh, Citation2013). Especially in diverse classrooms, observing students’ needs and immediately providing appropriate feedback to students is a challenging task (Van de Pol & Elbers, Citation2013). Allocation of feedback to students is another challenge. Teachers generally aim to divide their attention evenly over all students independent of their abilities (Corno, Citation2008; Tomlinson et al., Citation2003), but in practice, they often tend to spend more time helping low-ability students (Deunk et al., Citation2015). In many classrooms today we see an increased use of adaptive learning technologies (Clark & Luckin, Citation2013; Dalby & Swan, Citation2019; Haßler et al., Citation2016), which support teachers with real-time data of students’ performance and progress in teacher dashboards (Molenaar & Knoop-van Campen, Citation2018; Van Leeuwen et al., Citation2014; Van Leeuwen et al., Citationin press). Dashboards have the potential to support teachers to select feedback that fits with the needs of individual students and to make more informed decisions about the allocation of their time (Molenaar & Knoop-van Campen, Citation2018; Holstein et al., Citation2017; Sedrakyan et al., Citation2020; Tan et al., Citation2018; Van Leeuwen et al., Citation2014; Verbert et al., Citation2014, Citation2020). In these classrooms, feedback after dashboard consultations co-occurs with feedback triggered by teachers themselves or given in response to students’ questions. Despite the potential of dashboards on teachers’ feedback practices, few studies have assessed how teacher use dashboards in classrooms (c.f. Holstein et al. 2018). In the present study, we therefore examined how the feedback and allocation thereof is different when given after dashboard consultation (dashboard-prompted feedback) compared to human-prompted feedback.
Teachers’ feedback practices: type and allocation
Adaptivity in teaching is long recognized as an important element (Corno, Citation2008; Snow & Yalow, Citation1982). Already in the 1970s, Wood and colleagues (Citation1976) emphasized the importance of diagnosing students’ current level of performance and knowledge in order to provide appropriate feedback. Feedback can be defined as information given in response to performance that helps a student make progress during learning (Narciss, Citation2013). Generally, teachers provide feedback to students on aspects of students’ performance on problems or understanding of domain knowledge (Hattie & Timperley, Citation2007).
Feedback can address different elements of the learning process and generally five feedback types are distinguished: process, metacognitive, task, personal, and social (Hattie & Timperley, Citation2007; Keuvelaar-van den Bergh, Citation2013). Process feedback comments in which the teacher provides feedback on the way children handle their assignments. For example, “Tim, please read the explanation before you start working on your problems” (Hattie & Timperley, Citation2007). Metacognitive feedback informs students about how they can improve the control and monitoring of their learning (De Jager et al., Citation2005). For example, “How can you check whether you solved this problem correctly?”. Both process and metacognitive feedback are found to be the most effective types of feedback to enhance students’ learning as they help students to improve regulation of learning (Hattie, Citation2012). Task feedback is also functional for learning as it informs students about their performance and helps them to reflect on the development of their knowledge and skills (Butler & Winne, Citation1995; Hattie & Timperley, Citation2007; Thurlings et al., Citation2013). For example, “You made a mistake because you forgot to add numbers that you had to keep in mind.” However, comparing process and task feedback, process feedback had a larger positive effect on students’ achievements than task feedback (Harks et al., Citation2014). A similar point is made by Sedrakyan et al. (Citation2020) indicating that while most feedback is directed at performance indicators (task feedback), research shows that effective feedback tends to be addressing the regulatory mechanisms of the learning hence process and metacognitive feedback. Indeed, personalized visualizations support student’s regulation of practice behavior, transfer of learning and monitoring accuracy (Molenaar et al., Citation2019, Citation2020). Social feedback refers to how students interact and collaborate with other students, and is important in collaborative settings (Keuvelaar-van den Bergh, Citation2013; Van Leeuwen & Janssen, Citation2019). For example, “Helen, try to help Susan with this problem”. Personal feedback comments on a student as a person, for example, “You are doing great!”, and is considered to be less effective as it does not help students reach their learning goals (Shute, Citation2008).
Empirical evidence of which feedback types are most commonly provided in K-12 classrooms is scare (Bennett, Citation2011; Voerman et al., Citation2012). Two observation studies indicate that primary teachers give mostly task and, relatively often, process feedback (Van den Bergh et al., Citation2013) and secondary school teachers often provide, as they call it, nonspecific feedback which mostly corresponds with our classification of personal feedback (Voerman et al., Citation2012). Metacognitive feedback was rarely observed in both studies. These results indicate that while teachers provide different types of feedback during lessons, they do not always provide the most effective types of feedback to students (Hattie, Citation2012; Keuvelaar-van den Bergh, Citation2013).
In addition to giving effective feedback types, teachers also need to figure out which students need help. When teachers adjust their feedback to students’ individual abilities, learning improves compared to instructional approaches directed at the average student (Lou et al., Citation2000; Prast et al., Citation2015). Yet, teachers face challenges in identifying students’ needs, performance, and progress (Van der Pol & Elbers, Citation2013) and tend to determine which students need feedback based on their perceptions and beliefs (Südkamp et al., Citation2012). Teachers’ perceptions and beliefs are often grounded in students’ long-term performance on summative assessments, rather than current information from formative assessments providing detailed information about students’ current performance (Shute, Citation2008). Hence, in traditional classrooms, teachers’ perceptions and beliefs drive allocation of feedback, and different feedback patterns may be used for students perceived to have different abilities (regardless of current performance). The capacity of teachers to provide adaptive feedback is also limited in large and diverse classes (Corno, Citation2008).
Differences between students are becoming larger and teachers feel increased pressure to adapt feedback to the needs of students (Tomlinson et al., Citation2003). Often teachers distribute their attention unevenly and tend to act in favor of either high or low-ability students at the expense of the average students (Rosenthal, Citation1994). In the Netherlands specifically, teachers tend to spend more time on low-ability students to ensure that they too meet the minimum requirements (Deunk et al., Citation2015). Hence, the average child receives less attention and high-performing children with specific educational needs also receive less support (Civitillo et al., Citation2016). Whether teachers also act differentially with respect to the type of feedback given to specific groups of students is relatively unexplored. Research has suggested that low-ability students benefit from immediate feedback, whereas high-ability students perform better with delayed feedback (Mason & Bruning, Citation2001). Moreover, it has been proposed that low-ability students may benefit more from specific, corrective, and elaborative task feedback compared to process feedback (Brookhart, Citation2017; Clariana, Citation1990; Hanna, Citation1976). At the same time, it has been argued that with only task and not process feedback low-ability students are not challenged to the same extend as their high-ability students which reduces their opportunities to succeed (Denessen, Citation2017).
To summarize the above, although little empirical work investigated feedback practices of teachers in K-12, there is evidence that teachers do not always provide the most effective types of feedback (process and metacognitive), face challenges in dividing their attention and are not always objective in trying to identify the most appropriate support for different students.
Teachers dashboards
Increasingly, technology like iPads and tablets find its way into schools (Clark & Luckin, Citation2013; Dalby & Swan, Citation2018; Faber & Visscher, Citation2018; Haßler et al., Citation2016; Molenaar & Knoop-van Campen, Citation2018). This offers the opportunity to work with adaptive learning technologies that provide real-time data in the form of teacher dashboards (Molenaar & Knoop-van Campen, Citation2018; Van Leeuwen et al., Citation2014; Van Leeuwen et al., Citationin press). Objective dashboard information about students’ progress and task performance supports teachers’ feedback practices. In traditional classrooms, feedback is based on teachers’ initiatives to help students or triggered by students’ questions, all forms of human-prompted feedback. In technology-rich classrooms, dashboards also inform teachers’ feedback actions. Dashboard information helps teachers to diagnose students’ needs more accurately and select appropriate feedback actions (Van Leeuwen, Citation2019; Molenaar & Knoop-van Campen, Citation2017a). Hence in these contexts, human-prompted feedback co-occurs with dashboard-prompted feedback.
Dashboards come in many different forms and with different purposes (Bodily et al., Citation2018; Verbert et al., Citation2020). Within adaptive learning technologies in K-12 classrooms, dashboards often provide teachers information about students’ progress on different topics, students’ correct and incorrect answers on problems, and the development of student’ skills and knowledge (Jivet et al., Citation2018; Schwendimann et al., Citation2017; Verbert et al., Citation2014). For example, teachers can easily see which students make mistakes and do not make sufficient progress. This information supports teachers to better understand the needs of individual students during lessons (Holstein et al., Citation2017; Van Leeuwen & Rummel, Citation2020; Molenaar & Knoop-van Campen, Citation2018; Verbert et al., Citation2020).
However, merely providing dashboards will not automatically affect teachers’ feedback practices (Kasepalu et al., Citation2021). Verbert’s Learning Analytics Process model describes four stages teachers go through before data actually affects teaching (Verbert et al., Citation2014). In the awareness stage, teachers become aware of the data in the dashboards. In the reflection, teachers start asking themselves questions about the data (e.g. “How can I support this student” or “Which student needs support?”) and in the sense-making stage they answer these questions. Finally, in the impact stage, teachers make this information actionable and translate it into action by providing specific feedback to a student. In this stage, the translation of data into feedback actions takes place. Hence for dashboards to affect feedback practices, teachers are required to enact all four stages of the Learning Analytics Process model.
Empirical evidence concerning the impact of dashboards on teacher feedback practices, shows that dashboards influence how teachers provide feedback to students (Molenaar & Knoop-van Campen, Citation2018). For example, when teachers were given dashboards in a lab setting, they provide more feedback than without digital support (Van Leeuwen & Rummel, 2020). With respect to which students receive feedback, research has shown that teachers who used dashboards directed their attention more to low-performing students, which consequently resulted in local performance improvements (Martinez-Maldonado et al., Citation2015). Additionally, teacher dashboards affected teachers’ allocation of feedback towards students showing unproductive behavior in an Intelligent Tutor system which in turn improved students’ learning outcomes (Holstein et al., Citation2017). In both studies, dashboards supported teachers to identify low-performing students more accurately than they were able to do without the dashboard. This indicates that the timely objective information in dashboards improved teacher judgments about which students need support over their general perceptions and beliefs about student ability. However, these studies did not address the type of feedback given to low-preforming students. To conclude, dashboards indeed have the potential to affect the quantity and quality of teachers’ feedback as well its allocation to different students, but the interaction of these effects has not yet been studied.
Present study
When teacher dashboards are available, teachers have the opportunity to use the additional information to more accurately determine who needs feedback and adjust feedback to students’ individual needs. However, how dashboards exactly affect the type of feedback given and the allocation of feedback to students with different abilities in primary education classrooms is still unknown. Therefore, we asked the following three-part research question: To what extent do human- and dashboard-prompted feedback given in the same lessons differ on (i) the type of feedback given?; (ii) the allocation of feedback to students with different ability levels?; and (iii) the type of feedback given to students with different ability levels? This was examined in real learning situations in which students and teachers used an adaptive learning technology.
Method
Participants
In total, 35 teachers working in eight primary schools participated in this study. Schools were recruited to take part in this research via their school management. The participating teachers (8 male, 27 female) taught classes ranging from Grade 2 (8-year-old students) to Grade 6 (12-year-old students). The class size ranged between 18 and 30 students. All teachers were certified and on average had nineteen years teaching experience. Each teacher was observed during a 50-min arithmetic lesson, dealing with the topics of the schools’ arithmetic curriculum. In these classes, adaptive learning technology with incorporated teacher dashboards was used. Teachers used these dashboards on a daily basis in their classes and had between seven to eighteen months experience with this technology.
Materials
The adaptive learning technology
Students and teachers worked with the adaptive learning technology (Snappet) which runs on tablet computers. This technology is widely used across primary schools in the Netherlands (Molenaar & Knoop-van Campen, Citation2016). The learning technology offers exactly the same arithmetic exercises as in regular classes but with an additional adaptive mode: so, students can work on adaptive and non-adaptive problems. Non-adaptive problems are problems set out for the whole classroom according to the standardized planning of instruction (regarding particular learning goals). The adaptive problems are adjusted to the needs of individual students and thus differ between students.
A derivative of the Elo algorithm adapted problems to the current knowledge level of the student (Elo, Citation1978; Klinkenberg et al., Citation2011). The algorithm worked with a student’s knowledge score, which is the estimation of a student’s current level of knowledge on a particular topic (Klinkenberg et al., Citation2011). Based on the estimate of student’s knowledge level, the learning technology selected the next problem. The problem was selected such that the student has a probability of 75% of answering it correctly.
Dashboards
The technology captured real-time data of learners’ performance, which were concurrently displayed to the teachers during the lesson. This student’ data was visualized on the dashboard. The system included three different dashboards for teachers to use. The lesson overview dashboard showed the performance of students on the non-adaptive problems (). Teachers could monitor this dashboard to see whether students’ answers were correct or incorrect. Green blocks indicated correct answers at the first attempt, orange blocks indicated correct improved answers, and red blocks indicated incorrect responses. As this dashboard was updated concurrently during student’s practice, it provided information on students’ progress and task performance. The progress dashboard was used when students worked on adaptive problems. This dashboard indicated students’ overall progress and whether students’ knowledge was growing, stable, or reducing. When students worked on different topics, this dashboard supported teachers in keeping an overview of their progress of their individual learning. The class overview dashboard provided an overview of the performance of the students compared to all other students using the system, indicating to which norm group each student belongs (10% best students, 20% best students, etc.). Teachers could choose the period for the overview (that day, a week, etc.).
Figure 1. Illustration of a teacher dashboard showing all the students, and their progress on the specific assignments.
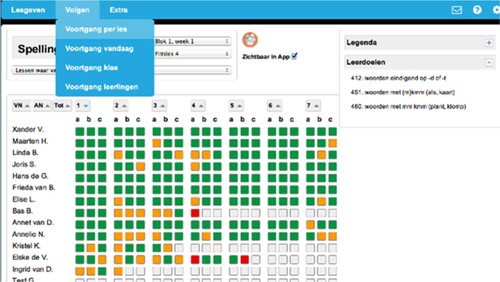
All dashboards were shown on teachers’ computer screen, laptop or tablet, which were easily accessible for the teacher during lessons. Hence the dashboards provide information about the task performance on each specific task, about progress over tasks, and ability level of the student based on performance in the adaptive learning technology. Additionally, additional information about students’ answers to tasks can be extracted from a deep dive screen. This can be used to specifically assess the problems students have. Finally, the dashboards also contain indirect information about students’ metacognitive control and monitoring which can be extracted from students’ errors.
Teachers’ feedback
We classified feedback as human-prompted feedback when teachers elicited feedback themselves or when they gave feedback in response to students’ questions. Feedback was classified as dashboard-prompted feedback when teachers provide students with feedback directly after they examined the dashboard. Five types of feedback were distinguished: task, personal, process, social, and metacognitive feedback, see (Hattie & Timperley, Citation2007; Keuvelaar-van den Bergh, Citation2013).
Table 1. Types of feedback.
In order to capture teachers feedback practices, classroom observations were performed. These observations were done by trained student-assistants using the classroom observation app (Molenaar & Knoop-van Campen, Citation2017b) and who were seated in the classroom during the lessons. The observers were trained thoroughly with example feedback events recorded in similar lessons (Molenaar & Knoop-van Campen, Citation2018). They were trained until they reached good interrater agreement scores on these practice events. They were trained to code all feedback actions of the teacher and were situated in such a way that they could observe the teachers’ tablet or computer screen. Every time the teacher gave feedback during the lesson, the observer indicated the initiation of the feedback (human-prompted or dashboard-prompted) and classified the type of feedback (task, personal, process, social, or metacognitive feedback). In addition, the observer recorded which student was receiving the feedback (by means of floor maps of the classroom).
Students’ ability level
The Dutch national standardized arithmetic assessment, CITO Rekenen-Wiskunde [Arithmetic-Mathematics] was used to measure students’ level of arithmetic skills. This assessment is used by 85% of the Dutch primary schools and norms are updated regularly (Inspectorate of Education, Citation2010). Students’ raw scores on these assessments were converted into national standardized normed ability scores that showed the degree to which the student had mastered arithmetic skills compared to their peers in the Netherlands. Students were labeled as one of three ability levels. The high ability group represents the top 25% students according to the national Dutch standardized norms on the standardized assessment test. The average ability group contains the students that score in the average 50% range and the low-ability group represents the students that score within the lowest 25% norm.
Procedure
Teachers taught their own classes following their usual curriculum and teaching method during observation. All teachers used the direct instruction model to guide their lessons (Becker & Gersten, Citation1982; Gersten et al., Citation1986). A lesson started with the teacher giving instruction to the whole class. During instruction, teachers explained a new learning goal, activated prior knowledge and modeled how to apply the new knowledge. After the instruction phase, students started to practice on problems on their tablets. First students worked on non-adaptive problems, which allowed the teacher to determine whether the instruction was understood by all students. After finishing the non-adaptive problems, approximately 25 problems, students continued with adaptive problems that were adjusted to their current estimated knowledge level. During this time, teachers provided individual feedback to those students who needed extra support. All feedback given during the lesson (whether human-prompted or dashboard-prompted) was observed in the classroom observations performed by the trained student assistants.
Data analyses
All feedback actions that were directed to specific students (e.g. “Susan, you should start now”) were included in the data analysis. In case two students were addressed by one feedback action at the same time (e.g. “Tom and Anne, good work”), the feedback action was transformed into two feedback actions: one assigned to Tom and one to Anne.
To examine how the type of feedback and the allocation of feedback differed between dashboard-prompted and human-prompted feedback, Chi-squares tests with Bonferonni column proportion comparisons were run. We only included task, personal, and process feedback in these analyses, because there were too few cases of metacognition and social feedback.
To investigate differences in the type of feedback given to students of different ability levels, the data was spilt into dashboard-prompted and human-prompted feedback. In this analysis, we only included task and process feedback, because there were too few cases of personal feedback. We ran Kendell tau-c analyses (due to the ordinal nature of the data on ability level) for both groups.
Results
Descriptive statistics
In total, there were 372 feedback actions: 210 dashboard-prompted feedback actions and 162 human-prompted feedback actions. On average, teachers gave 10.63 feedback actions per lesson (SD = 7.52): 4.63 human-prompted feedback actions (SD = 5.61) and 6.00 feedback actions after dashboard consultation (SD = 4.64). Three teachers gave only human-prompted feedback and ten teachers gave only dashboard-prompted feedback.
With regards to the types of feedback given, the predominant feedback given was task feedback (N = 230, 62%). Next, also process feedback was given often (N = 120, 32%). Teachers rarely gave personal (N = 20, 5%), metacognition (N = 0, 0%), or social feedback (N = 2, 1%) (see Total columns in ).
Table 2. Means and standard deviations per teacher for feedback type and ability groups.
Type of feedback
First, we examined whether dashboard-prompted and human-prompted feedback differed with respect to the type of feedback given (task, process, and personal feedback). We found a significant difference between the type of feedback given after dashboard consultation, compared to human-prompted feedback, χ2(2, 370) = 66.10, p < .001 (see ).
Figure 2. Type of feedback.
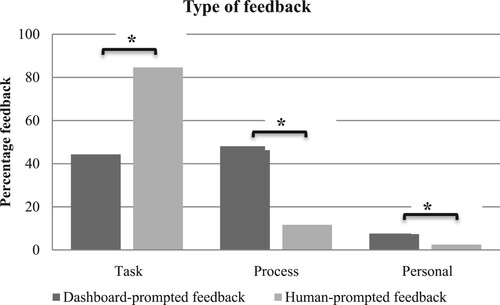
Bonferonni column proportion comparisons showed a significant difference on task, process, and personal feedback (p < .05). Dashboard-prompted feedback was proportionally less task feedback (N = 93, 44%) than human-prompted feedback (N = 137, 85%). Dashboard-prompted feedback was more process feedback (N = 101, 49%), than human-prompted feedback (N = 19, 12%) and more personal feedback (N = 16, 8%) compared to human-prompted feedback (N = 4, 3%). This indicates that dashboard consultations seem to generated different types of feedback; specifically, a similar amount of task and process feedback (in contrast to human-prompted feedback which was predominately task focused) and a greater amount of personal feedback than human-prompting (thought this was still a relatively small proportion overall).
Allocation of feedback to different ability students
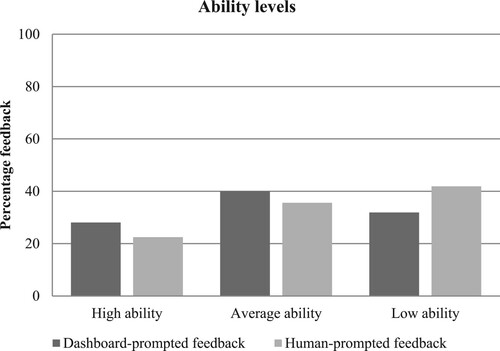
Next, we examined whether dashboard-prompted and human-prompted feedback differed with respect to the allocation to students’ ability level (high, average, and low-ability students). We found no significant difference in the quantity of feedback given to students with different abilities between dashboard-prompted and human-prompted feedback, χ2(2, 370) = 4.06, p = .132 (see ). Consequentially, no follow-up Bonferroni column proportion comparisons were reported.
Figure 3. The feedback directed at different ability groups.
Relation type and allocation of feedback
We also examined whether dashboard-prompted and human-prompted feedback differed with respect to the types of feedback given to students with different ability levels. For dashboard-prompted feedback no significant interaction was found between the type of feedback given and the ability levels of students receiving feedback, rτ = −.08, p = .283, while for human-prompted feedback a significant interaction was observed, rτ = −.15, p = .016 (see ).
Figure 4. Different types of feedback directed at different ability groups.
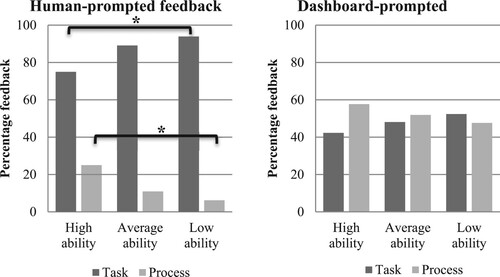
Human-prompted feedback overall consisted of more task feedback and less process feedback for all students, but for low-ability students, this difference was even larger (task, N = 61, 94%; process N = 4, 6%) compared to high ability students (task, N = 27, 75%; process N = 9, 25%). These differences were not found for dashboard-prompted feedback in which the amounts of task and process feedback were similar across all ability levels. This indicates that dashboard consultations led to a more equal division of task and process feedback towards all students and specifically for students with different ability levels: after dashboard consultation teachers were more prone to provide similar types of feedback to all three ability groups compared to human-prompted feedback.
Discussion
Teacher dashboards provide teachers with real-time continuous information about students’ learning progress and performance. In turn, K-12 teachers can use this information to adjust feedback to the needs of individual students. Empirical understanding of how dashboards impact teachers’ feedback practices is only recently emerging (Holstein et al., Citation2017; Van Leeuwen et al., Citation2017; Van Leeuwen et al., Citation2019; Wise & Jung, Citation2019). The present study explored how dashboard-prompted feedback differed from human-prompted feedback during thirty-five arithmetic lessons in primary education. Results showed that dashboard-prompted feedback was different from human-prompted feedback with respect to the type of feedback given overall, and to students with different abilities. After dashboard consultation, teachers gave equal amounts of task and process feedback, while human-prompting led to much more task than process feedback and this difference was especially strong for low-ability students. Moreover, after dashboard consultation teachers also gave more personal feedback.
Regarding the type of feedback given, results indicated that teachers provided different types of feedback after dashboard consultation compared to human-prompted feedback. Teachers provided less task feedback and more process feedback after dashboard consultation. Dashboards make variation in the time students take to solve problems visible and they give a direct overview of correct, corrected and incorrect answers. This helps teachers to assess how well students progress. The increase in process feedback suggests that dashboard data helped teachers to diagnose students’ progress and translate this information into process feedback. Indeed, dashboards showed which tasks students were working on and how they were progressing on their math topics. Teachers could use this information in feedback directed at process of students’ learning. On the other hand, teachers need to go into a dive deep screen to further investigate students’ errors to select appropriate task feedback. Hence although there is task information in dashboards, progress information is easier to extract, which provides the basis for process feedback. Process feedback is considered especially important to enhance students’ learning (Harks et al., Citation2014; Hattie & Timperley, Citation2007; Molenaar et al., Citation2020), and this type of feedback is usually underrepresented in classrooms (Van den Bergh et al., Citation2013; Voerman et al., Citation2012). Furthermore, dashboards stimulating this kind of feedback are still rare (Dourado et al., Citation2021; Matcha et al., Citation2019; Sedrakyan et al., Citation2020). Hence this study shows that appropriately designed dashboards have proven to be an intervention to stimulate teachers to provide more effective feedback during learning. Personal feedback also increased after dashboard consultation, though it was still a small proportion of the overall feedback given. This type of feedback is considered less effective for learning as it does not contain specific direction that can used by the student to improve learning (Hattie & Timperley, Citation2007); however, teachers tend to believe it stimulates student’s motivation (Van den Bergh et al., Citation2013). Metacognition and social feedback were rarely found in this study. Metacognition feedback is also not frequently observed in other studies (Van den Bergh et al., Citation2013; Voerman et al., Citation2012) and the lack of social feedback could be attributed to the fact that the arithmetic lessons generally did not have a cooperation element. In other studies dashboards have been used to elicit social feedback and were successfully (Han et al., Citation2021)
With respect to the type of feedback given to students with different ability levels, results evidenced that the type of feedback given to students with different abilities differed depending on the source of feedback. When teachers initiate feedback themselves, they provided relatively more task feedback and less process feedback to low-ability students compared to high ability. Feedback given after dashboard consultation did not show these differences in the type of feedback given to students with different ability levels. Feedback elicited by dashboards, led to a more equal division of task and process feedback towards students with different abilities. Hence human-prompted was found to be profoundly different from dashboard-prompted feedback. This is supported by a recent study by Li and colleagues (Citation2021) which showed that teachers make an effort to capitalize on the learning analytics to improve their pedagogical actions and inform their feedback practices. As indicated above, dashboards made progress information more easily accessible, yet this does not explain why teachers used this information more for low-ability students. A possible explanation is that teachers use the data in dashboards to augment their existing diagnosis of students’ needs. We can speculate that especially in the case of low-ability students this may have provided unexpected insights, which caused teachers to assess that process feedback would be more appropriate for the current needs of students (van de Pol & Elbers, Citation2013). This seems to indicate that teachers’ perceptions of students have more influence in human-prompted feedback than for dashboard-prompted feedback (Rosenthal, Citation1994). The reduced impact of teachers’ perceptions may explain why dashboard-prompted feedback tends to be more equally distributed over students. These results suggest that dashboard data – to a certain extent – overcomes teachers’ natural bias towards supporting low-ability students almost exclusively with task feedback. Although limited prior research indicates that corrective elaborative (task) feedback may be appropriate for low-ability students (Brooks et al., Citation2019; Shute, Citation2008), dashboards may help teachers to determine when process feedback is also appropriate for them. This suggests that dashboards support teachers to attend to the needs of all students, which may reduce biases towards less challenging feedback for low-ability students. High ability students are also in need of feedback to excel (Scager et al., Citation2014), especially in the Netherlands where only 4% of the students reached the highest skill level (Meelissen et al., Citation2012). Dashboards seem to be able to support a more equal division of different types of feedback over high, average, and low-preforming students. The primary effect was equalizing process and task feedback for all students, with an extra strong effect for low-ability students.
A few limitations apply to the present study. The first concerns the diversity in the data: the sample of teachers taught different grade levels and there were large differences in the way teachers provided feedback and how they used dashboards (similar to for example Herodotou et al., Citation2019). Although diversity may provide more generalizable results applicable to a larger population of primary school teachers, it also leaves possible causes of the diversity unexplained.
Secondly, teachers were relatively new to working with the adaptive learning technology and dashboards. As the interaction between a tool and the incorporation of it in daily routines is of great importance for the successful usage of new tools (Norman, Citation1991; Rienties et al., Citation2018), teachers who have more experience with dashboards could use the information differently. In a similar vein, Wise and Jung (Citation2019) state “integrating the use of learning analytics into teaching practices to inform instructional decisions takes time” (p. 53) and teachers need to both understand the additional value of such dashboards and integrate them into their daily routines to achieve their full benefit (Li et al., Citation2021). Further research should therefore investigate how differences in teachers’ experience influences their feedback practices. In a recently published study, Van Leeuwen et al. (Citation2021) showed that there is large variation among teachers in how they use dashboards. This diversity was not explained by teacher characteristics such as experience, age, gender and self-efficacy and the authors propose a new framework to attribute diversity in dashboard usage studying complex teacher characteristics such as pedagogical knowledge, professional routines and data literacy skills.
Also, research into how the design of dashboards affect students’ learning achievements is needed, specifically the differential effects of task and process feedback for students at different ability levels. Differences in the data represented may elicit different types of feedback (and see also Van Leeuwen & Rummel, Citation2020, for the analysis of different dashboards on teachers’ responses). In the light of this study, task feedback is more likely when dashboards show mistakes on problems, while dashboards providing progress information may prompt process feedback. In addition, future research could develop guidance for teachers as to what type of feedback can be given in response to analytics (Sergis & Sampson, Citation2017; Van Leeuwen, Citation2019). To create suggestive dashboards that will be valued and used, Van Leeuwen and colleagues (Citationin press) stress that involving teachers in the design process is essential.
Finally, future research could also address differences in human-prompted feedback. Teachers rely on their previous knowledge to provide teacher-prompted feedback, but when students ask questions (student-prompted feedback) different types of feedback are elicited (Knoop-van Campen & Molenaar, Citation2020). Research studies with an experimental design comparing lessons with and without dashboards support can further develop to our understanding of how teachers’ feedback practices are affected by dashboards.
The present research has several implications for education. First, it is important to note large differences in the way teachers provide feedback and how they used dashboards. Professional training to understand, analyze and translate data into actions are important to support teachers in using dashboard information optimally in classrooms. Second, the present study showed that dashboards in adaptive learning technologies support teachers to provide different types of feedback and alter feedback allocation: objective information can potentially help to overcome (unconscious) biases in teachers’ feedback practices.
Conclusion
We conclude that dashboards, although relatively new to the teachers in this study, already in this early stage impacted teachers’ feedback practices. Feedback is an important element in adaptive teaching and powerful intervention for teachers to adapt to students’ individual needs. Dashboards affected the way teachers provide feedback with respect to the type of feedback given and the allocation of different types of feedback to students. This indicated that dashboards do not only help teachers to generate feedback actions but also that feedback based on dashboard data is profoundly different from human-prompted feedback. Moreover, this study provides first indications that teachers’ bias in providing different types of feedback to different ability students can be reduced by objective dashboard data. To sum, dashboards can have an equalizing effect on teacher feedback practices by prompting the use of effective process feedback distributed across students of all ability levels.
Disclosure statement
No potential conflict of interest was reported by the author(s).
Additional information
Funding
Notes on contributors
Carolien A. N. Knoop-van Campen
Carolien A. N. Knoop-van Campen is doing her doctoral research on multimedia learning and dyslexia at the Behavioural Science Institute (BSI), Radboud University, the Netherlands. Her area of research includes dyslexia, twice-exceptional learners, multimedia learning, and adaptive educational technologies. In her research, she combines outcomes measures with process data like eye-tracking and log files.
Alyssa Wise
Alyssa Wise is Associate Professor of Learning Sciences and Educational Technology in the Steinhardt School of Culture, Education, and Human Development and the Director of LEARN, NYU's university-wide Learning Analytics Research Network She holds a Ph.D. in the Learning Sciences from Indiana University. Dr. Wise's research is situated at the intersection of the learning sciences and educational data science, focusing on the design of learning analytics systems that are theoretically grounded, computationally robust, and pedagogically useful for informing teaching and learning.
Inge Molenaar
Inge Molenaar is Associate Professor and leader of the Adaptive Learning Lab, Behavioural Science Institute, Radboud University, the Netherlands. She holds a PhD in Educational Sciences from the University of Amsterdam. Her main interests are technology-empowered innovation in education that facilitates students’ talent development. Her research focuses on the application of data from adaptive learning technologies to understand how student’ regulate their learning over time. In the Adaptive Learning Lab (ALL) she closely collaborates with schools and educational technology companies, publishers, the Dutch ministry of Education, OECD and UNESCO.
References
- Becker, W. C., & Gersten, R. (1982). A follow-up of follow through: The later effects of the direct instruction model on children in fifth and sixth grades. American Educational Research Journal, 19(1), 75–92. https://doi.org/10.3102/00028312019001075
- Bennett, R. E. (2011). Formative assessment: A critical review. Assessment in Education: Principles, Policy & Practice, 18(1), 5–25. https://doi.org/10.1080/0969594X.2010.513678
- Brookhart, S. M. (2017). How to give effective feedback to your students. ASCD.
- Brooks, C., Carroll, A., Gillies, R. M., & Hattie, J. (2019). A matrix of feedback for learning. Australian Journal of Teacher Education, 44(4), 2. https://doi.org/10.14221/ajte.2018v44n4.2
- Bodily, R., Kay, J., Aleven, V., Jivet, I., Davis, D., Xhakaj, F., & Verbert, K. (2018, March). Open learner models and learning analytics dashboards: a systematic review. In Proceedings of the 8th international conference on learning analytics and knowledge (pp. 41-50).
- Butler, D. L., & Winne, P. H. (1995). Feedback and self-regulated learning: A theoretical synthesis. Review of Educational Research, 65(3), 245–281. https://doi.org/10.3102/00346543065003245
- Civitillo, S., Denessen, E., & Molenaar, I. (2016). How to see the classroom through the eyes of a teacher: Consistency between perceptions on diversity and differentiation practices. Journal of Research in Special Educational Needs, 16, 587–591. https://doi.org/10.1111/1471-3802.12190
- Clark, W., & Luckin, R. (2013). iPads in the classroom What The Research Says (Series). London: London Knowledge Lab/Institute of Education.
- Clariana, R. B. (1990). A comparison of answer-until-correct feedback and knowledgeof-correct-response feedback under two conditions of contextualization. Journal of Computer-Based Instruction, 17(4), 125–129.
- Corno, L. Y. N. (2008). On teaching adaptively. Educational Psychologist, 43(3), 161–173. https://doi.org/10.1080/00461520802178466
- Dalby, D., & Swan, M. (2019). Using digital technology to enhance formative assessment in mathematics classrooms. British Journal of Educational Technology, 50(2), 832–845.
- De Jager, B., Jansen, M., & Reezigt, G. (2005). The development of metacognition in primary school learning environments. School Effectiveness and School Improvement, 16(2), 179–196. https://doi.org/10.1080/09243450500114181
- Denessen, E. J. P. G. (2017). Dealing responsibly with differences: socio-cultural backgrounds and differentiation in education. Paper presented at the Inaugural lecture. University Leiden, Netherlands.
- Deunk, M. I., Doolaard, S., Smale-Jacobse, A., & Bosker, R. J. (2015). Differentiation within and across classrooms: A systematic review of studies into the cognitive effects of differentiation practices. GION onderwijs/onderzoek, Rijksuniversiteit Groningen.
- Dourado, R. A., Rodrigues, R. L., Ferreira, N., Mello, R. F., Gomes, A. S., & Verbert, K. (2021, April). A Teacher-facing Learning Analytics Dashboard for Process-oriented Feedback in Online Learning. In LAK21: 11th International Learning Analytics and Knowledge Conference (pp. 482–489).
- Elo, A. (1978). The rating of chess players, past and present. Arco.
- Faber, J. M., & Visscher, A. J. (2018). The effects of a digital formative assessment tool on spelling achievement: Results of a randomized experiment. Computers & Education, 122, 1–8. https://doi.org/10.1016/j.compedu.2018.03.008
- Haßler, B., Major, L., & Hennessy, S. (2016). Tablet use in schools: A critical review of the evidence for learning outcomes. Journal of Computer Assisted Learning, 32(2), 139–156.
- Gersten, R., Woodward, J., & Darch, C. (1986). Direct instruction: A research-based approach to curriculum design and teaching. Exceptional Children, 53(1), 17–31. https://doi.org/10.1177/001440298605300102
- Han, J., Kim, K. H., Rhee, W., & Cho, Y. H. (2021). Learning analytics dashboards for adaptive support in face-to-face collaborative argumentation. Computers & Education, 163, 104041. https://doi.org/10.1016/j.compedu.2020.104041
- Hanna, G. S. (1976). Effects of total and partial feedback in multiple-choice testing upon learning. The Journal of Educational Research, 69(5), 202–205. https://doi.org/10.1080/00220671.1976.10884873
- Harks, B., Rakoczy, K., Hattie, J., Besser, M., & Klieme, E. (2014). The effects of feedback on achievement, interest and self-evaluation: The role of feedback’s perceived usefulness. Educational Psychology, 34(3), 269–290. https://doi.org/10.1080/01443410.2013.785384
- Hattie, J. (2012). Visible learning for teachers: Maximizing impact on learning. Routledge.
- Hattie, J., & Timperley, H. (2007). The power of feedback. Review of Educational Research, 77(1), 81–112. https://doi.org/10.3102/003465430298487
- Herodotou, C., Rienties, B., Boroowa, A., Zdrahal, Z., & Hlosta, M. (2019). A large-scale implementation of predictive learning analytics in higher education: The teachers’ role and perspective. Educational Technology Research and Development, 67(5), 1273–1306. https://doi.org/10.1007/s11423-019-09685-0
- Holstein, K., Hong, G., Tegene, M., McLaren, B. M., & Aleven, V. (2018, March). The classroom as a dashboard: co-designing wearable cognitive augmentation for K-12 teachers. In Proceedings of the 8th international conference on learning Analytics and knowledge (pp. 79-88).
- Holstein, K., McLaren, B. M., & Aleven, V. (2017, March). Intelligent tutors as teachers’ aides: exploring teacher needs for real-time analytics in blended classrooms. In Proceedings of the Seventh International Learning Analytics & Knowledge Conference (pp. 257–266). ACM.
- Inspectie van het Onderwijs. (2010). Opbrengstgericht werken in het basisonderwijs: Een onderzoek naar opbrengstgericht werken bij rekenen-wiskunde in het basisonderwijs. Utrecht: Inspectie van het onderwijs.
- Jivet, I., Scheffel, M., Specht, M., & Drachsler, H. (2018, March). License to evaluate: Preparing learning analytics dashboards for educational practice. In Proceedings of the 8th International Conference on Learning Analytics and Knowledge (pp. 31–40).
- Kasepalu, R., Chejara, P., Prieto, L. P., & Ley, T. (2021). Do Teachers Find Dashboards Trustworthy, Actionable and Useful? A Vignette Study Using a Logs and Audio Dashboard. Technology, Knowledge and Learning, 1–19.
- Keuvelaar-van den Bergh, L. L. (2013). Teacher feedback during active learning: the development and evaluation of a professional development program. Eindhoven: Technische Universiteit Eindhoven.
- Knoop-van Campen, C. A. N. & Molenaar, I. (2020). How Teachers Integrate Dashboards into Their Feedback Practices. Frontline Learning Research, 8(4), 37–51.
- Klinkenberg, S., Straatemeier, M., & van der Maas, H. L. (2011). Computer adaptive practice of maths ability using a new item response model for on the fly ability and difficulty estimation. Computers & Education, 57(2), 1813–1824. https://doi.org/10.1016/j.compedu.2011.02.003
- Li, Q., Jung, Y., & Friend Wise, A. (2021). Beyond first encounters with analytics: Questions, techniques and challenges in instructors’ sensemaking. Proceedings of the 11th International Learning Analytics and Knowledge Conference (pp. 344–353). ACM.
- Lou, Y., Abrami, P. C., & Spence, J. C. (2000). Effect of within-class grouping on student achievement: An explanatory model. The Journal of Educational Research, 94(2), 101–112. https://doi.org/10.1080/00220670009598748
- Martinez-Maldonado, R., Clayphan, A., Yacef, K., & Kay, J. (2015). MTFeedback: Providing notifications to enhance teacher awareness of small group work in the classroom. IEEE Transactions on Learning Technologies, 8(2), 187–200. https://doi.org/10.1109/TLT.2014.2365027
- Mason, B. J., & Bruning, R. (2001). Providing feedback in computer-based instruction: What the research tells us. Retrieved February, 15, 2007.
- Matcha, W., Gašević, D., & Pardo, A. (2019). A systematic review of empirical studies on learning analytics dashboards: A self-regulated learning perspective. IEEE Transactions on Learning Technologies, 13(2), 226–245. https://doi.org/10.1109/TLT.2019.2916802
- Meelissen, M. R. M., Netten, A., Drent, M., Punter, R. A., Droop, M., & Verhoeven, L. (2012). PIRLS- en TIMSS-2011: Trends in leerprestaties in Lezen, Rekenen en Natuuronderwijs. Nijmegen/Enschede: Radboud Universiteit / Universiteit Twente. DOI: 10.3990/1.9789036534758.
- Molenaar, I., Horvers, A., & Baker, R. S. (2019). What can moment-by-moment learning curves tell about students’ self-regulated learning?. Learning and Instruction, 101206.
- Molenaar, I., Horvers, A., Dijkstra, R., & Baker, R. S. (2020, March). Personalized visualizations to promote young learners’ SRL: the learning path app. In Proceedings of the Tenth International Conference on Learning Analytics & Knowledge (pp. 330–339).
- Molenaar, I., & Knoop-van Campen, C. A. N. (2016, April). Learning analytics in practice: the effects of adaptive educational technology Snappet on students' arithmetic skills. In Proceedings of the sixth international conference on learning analytics & knowledge (pp. 538–539). https://doi.org/10.1145/2883851.2883892
- Molenaar, I., & Knoop-van Campen, C. A. N. (2017a, September). Teacher dashboards in practice: Usage and impact. In European conference on technology enhanced learning (pp. 125-138). Cham: Springer. https://doi.org/10.1007/978-3-319-66610-5_10
- Molenaar, I., & Knoop-van Campen, C. A. N. (2017b, September). How teachers differ in using dashboards: the classroom observation app. Presented at the workshop “multimodal learning analytics across (physical and digital) spaces” at European conference on technology enhanced learning. Cham: Springer.
- Molenaar, I., & Knoop-van Campen, C. A. N. (2018). How teachers make dashboard information actionable. IEEE Transactions on Learning Technologies, 12(3), 347–355.
- Narciss, S. (2013). Designing and evaluating tutoring feedback strategies for digital learning. Digital Education Review, 23, 7–26.
- Norman, D. A. (1991). Cognitive artifacts. in J. M. Carroll (Ed.), Designing interaction: Psychology at the human-computer interface (pp. 17–38). Cambridge University Press.
- Prast, E. M., Van de Weijer-Bergsma, E., Kroesbergen, E. H., & Van Luit, J. E. H. (2015). Readiness-based differentiation in primary school mathematics: Expert recommendations and teacher self-assessment. Frontline Learning Research, 3(2), 90–116. https://doi.org/10.14786/flr.v3i2.163
- Rienties, B., Herodotou, C., Olney, T., Schencks, M., & Boroowa, A. (2018). Making sense of learning analytics dashboards: A technology acceptance perspective of 95 teachers. International Review of Research in Open and Distributed Learning, 19(5), 5. https://doi.org/10.19173/irrodl.v19i5.3493
- Rosenthal, R. (1994). Interpersonal expectancy effects: A 30-year perspective. Current Directions in Psychological Science, 3(6), 176–179. https://doi.org/10.1111/1467-8721.ep10770698
- Scager, K., Akkerman, S. F., Pilot, A., & Wubbels, T. (2014). Challenging high-abilty students. Studies in Higher Education, 39(4), 659–679. https://doi.org/10.1080/03075079.2012.743117
- Schwendimann, B. A., Rodriguez-Triana, M. J., Vozniuk, A., Prieto, L. P., Boroujeni, M. S., Holzer, A., Gillet, D., & Dillenbourg, P. (2017). Perceiving learning at a glance: A systematic literature review of learning dashboard research. IEEE Transactions on Learning Technologies, 10(1), 30–41. https://doi.org/10.1109/TLT.2016.2599522
- Sedrakyan, G., Malmberg, J., Verbert, K., Järvelä, S., & Kirschner, P. A. (2020). Linking learning behavior analytics and learning science concepts: Designing a learning analytics dashboard for feedback to support learning regulation. Computers in Human Behavior, 107, 105512. https://doi.org/10.1016/j.chb.2018.05.004
- Sergis, S., & Sampson, D. G. (2017). Teaching and learning analytics to support teacher inquiry: A systematic literature review. In A. Peña-Ayala (Ed.), Learning analytics: Fundaments, applications, and trends. Decision and control book series (SSDC) (Vol. 94, pp. 25–63). Cham: Springer. https://doi.org/10.1007/978-3-319-52977-6_2
- Shute, V. J. (2008). Focus on formative feedback. Review of Educational Research, 78(1), 153–189. https://doi.org/10.3102/0034654307313795
- Snow, R. E., & Yalow, E. (1982). Education and intelligence. Handbook of Human Intelligence, 2, 493–585.
- Südkamp, A., Kaiser, J., & Möller, J. (2012). Accuracy of teachers’ judgments of students’ academic achievement: A meta-analysis. Journal of Educational Psychology, 104(3), 743–762. https://doi.org/10.1037/a0027627
- Tan, J. P.-L., Koh, E., & Jonathan, C. R. (2018, April). Visible teaching in action: Using the WiREAD learning analytics dashboard for pedagogical adaptivity. Paper Presented at the 2018 Annual Meeting of the American Educational Research Association. Retrieved October 31, from the AERA Online Paper Repository. http://doi.org/10.302/1321813
- Thurlings, M., Vermeulen, M., Bastiaens, T., & Stijnen, S. (2013). Understanding feedback: A learning theory perspective. Educational Research Review, 9, 1–15. https://doi.org/10.1016/j.edurev.2012.11.004
- Tomlinson, C. A., Brighton, C., Hertberg, H., Callahan, C. M., Moon, T. R., Brimijoin, K., Conover, L. A., & Reynolds, T. (2003). Differentiating instruction in response to student readiness, interest, and learning profile in academically diverse classrooms: A review of literature. Journal for Education, 27(2), 119–145. https://doi.org/10.1177/016235320302700203
- Van den Bergh, L., Ros, A., & Beijaard, D. (2013). Teacher feedback during active learning: Current practices in primary schools. British Journal of Educational Psychology, 83(2), 341–362. https://doi.org/10.1111/j.2044-8279.2012.02073.x
- Van de Pol, J., & Elbers, E. (2013). Scaffolding student learning: A micro-analysis of teacher-student interaction. Learning, Culture and Social Interaction, 2(1), 32–41. https://doi.org/10.1016/j.lcsi.2012.12.001
- Van Leeuwen, A. (2019). Teachers’ perceptions of the usability of learning analytics reports in a flipped university course: When and how does information become actionable knowledge? Educational Technology Research and Development, 67(5), 1043–1064. https://doi.org/10.1007/s11423-018-09639-y
- Van Leeuwen, A., & Janssen, J. (2019). A systematic review of teacher guidance during collaborative learning in primary and secondary education. Educational Research Review, 27, 71–89. https://doi.org/10.1016/j.edurev.2019.02.001
- Van Leeuwen, A., Janssen, J., Erkens, G., & Brekelmans, M. (2014). Supporting teachers in guiding collaborating students: Effects of learning analytics in CSCL. Computers & Education, 79, 28–39. https://doi.org/10.1016/j.compedu.2014.07.007
- Van Leeuwen, A., Knoop-van Campen, C. A. N., Molenaar, I., & Rummel, N. (2021). How teacher characteristics relate to how teachers use dashboards: Results from two case studies in K-12. Journal of Learning Analytics.
- Van Leeuwen, A., Rummel, N., & van Gog, T. (2019). What information should CSCL teacher dashboards provide to help teachers interpret CSCL situations? International Journal of Computer-Supported Collaborative Learning, https://doi.org/10.1007/s11412-019-09299-x
- Van Leeuwen, A., & Rummel, N. (2020, March). Comparing teachers' use of mirroring and advising dashboards. In Proceedings of the Tenth International Conference on Learning Analytics & Knowledge (pp. 26–34).
- Van Leeuwen, A., Teasley, S., & Wise, D., & F, A. (in press). Teacher and student facing learning analytics. In C. Lang, G. Siemens, A. F. Wise, D. Gasevic, & A. Mercernon (Eds.), Handbook of learning analytics. 2nd ed. SoLAR.
- Van Leeuwen, A., Van Wermeskerken, M., Erkens, G., & Rummel, N. (2017). Measuring teacher sense making strategies of learning analytics: A case study. Learning: Research and Practice, 3(1), 42–58.
- Verbert, K., Govaerts, S., Duval, E., Santos, J. L., Van Assche, F., Parra, G., & Klerkx, J. (2014). Learning dashboards: An overview and future research opportunities. Personal and Ubiquitous Computing, 18(6), 1499–1514. doi: 10.1007/s00779-013-0751-2
- Verbert, K., Ochoa, X., De Croon, R., Dourado, R. A., & De Laet, T. (2020, March). Learning analytics dashboards: the past, the present and the future. In Proceedings of the Tenth International Conference on Learning Analytics & Knowledge (pp. 35–40).
- Voerman, L., Meijer, P. C., Korthagen, F. A. J., & Simons, R. J. (2012). Types and frequencies of feedback interventions in classroom interaction in secondary education. Teaching and Teacher Education, 28(8), 1107–1115. https://doi.org/10.1016/j.tate.2012.06.006
- Wise, A. F., & Jung, Y. (2019). Teaching with analytics: Towards a situated model of instructional decision-making. Journal of Learning Analytics, 6(2), 53-69. DOI: https://doi.org/10.18608/jla.2019.62.4
- Wood, D., Bruner, J. S., & Ross, G. (1976). The role of tutoring in problem solving. Journal of Child Psychology and Psychiatry, 17(2), 89-100. 10.1111/j.1469-7610.1976.tb00381.x