
Abstract
As one of the most important livestock breeds on the Qinghai-Tibet Plateau, Tibetan sheep are of great importance to the local economy, agriculture and culture. Its adaptive mechanism in low temperature and low oxygen at highland altitudes has not been reported. In this study, transcriptome sequencing was used to analyze the heart, liver, spleen, lung, kidney, and muscle tissue of sheep at low and highland altitudes. LOC101112291, SELENOW, COL3A1, GPX1, TMSB4X and HSF4 were selected as candidate genes for adapting to plateau characteristics in Tibet Sheep. Besides, glutathione metabolism, arachidonic acid metabolism, nucleotide excision repair, regulation of actin cytoskeleton, protein digestion and absorption, thyroid hormone synthesis, relaxation signaling pathways may play important roles in the adaptation to plateau hypoxia, and cold tolerance. Structural analysis also showed that sequencing genes related to the adaptation mechanism of Tibet sheep to highland altitude. This study will lay a certain foundation for Tibet sheep research.
SIMPLE SUMMARY
Tibet sheep are an ancient species in the Qinghai Tibet Plateau. After a long period of domestication. Tibet sheep adapt to the hypoxic environment of the plateau in terms of physiology and morphology. At the same time, Tibet sheep is also one of the major sources of material for herdsmen in tibetan. In this study, six different tissue samples (heart, liver, spleen, lung, kidney, and muscle) of Tibet sheep were analyzed to reveal the underlying mechanisms of different tissues respond to hypothermia condition. The results showed that six key genes and eight important signaling pathways involved in regulating the adaptation of Tibet sheep to the plateau. In addition, there were more alternative splicing (AS) events and single nucleotide polymorphism (SNP) sites in highland altitude Tibet sheep than in lowland altitude sheep, which was also a concern in the highland altitude adaptability of Tibet sheep.
Introduction
The Qinghai Tibet Plateau is known for its harsh environment, such as high altitude, low oxygen, alpine cold and strong ultraviolet rays. These conditions limit the survival of many animals.Citation1 The low-oxygen environment of the plateau mainly affects the heart and lung function of the human body, and people who can easily cause acute altitude sickness rush to the plateau, even in severe cases. Qinghai-Tibet Plateau is the highest cold region on earth.Citation2 Long-term exposure to a cold plateau environment can lead to disorders of local nutrition, function, and cell metabolism, and even cause tissue death and shedding. Therefore, thermogenesis is key to survival during long-time exposure to cold environment.Citation3–5 Qinghai Tibet Plateau has strong solar ultraviolet radiation and can cause some damage to the body, such as the skin.Citation6 In the long-term evolution of organisms, native animals living on the plateau were able to adapt well to the extreme environment of hypoxia at altitude and developed unique adaptability,Citation7 such as yaks,Citation8,Citation9 Tibet pigsCitation10–13 and Tibet sheep.Citation14
Tibet sheep is one of three major coarse wool sheep breeds on the Qinghai-Tibet Plateau. Through long-term domestication, Tibet sheep has evolved to adapt to the hypoxic environment of the cold plateau. At present, more than 30 million Tibet sheep live on the 2.5 million km2 of the Qinghai Tibet Plateau.Citation15 Tibet sheep are one of the main sources of production and life for farmers and herdsmen on the Qinghai-Tibet Plateau. Through Tang et al. performed whole genome sequencing of Tibet sheep in the early stages, he did not contrast with sheep at lowland altitudes.Citation16 Therefore, the molecular mechanism of Tibet sheep adapting to the local alpine and low-oxygen environment is not clear. Studies have shown that the heart,Citation17 liver,Citation18 spleen,Citation19 lungs,Citation20 kidneys,Citation21 and musclesCitation22 are the most sensitive tissues under highland altitude hypoxia conditions. Different from other studies, we study the adaptation mechanism of Tibetan sheep to the plateau environment from themselves,Citation23 sequence the internal organs of Tibetan sheep at different altitudes,Citation24 and our research has studied the adaptation mechanism of Tibetan sheep to high altitude more thoroughly.Citation25 Therefore, in this study, transcriptome sequencing was used to explore how different tissues (heart, liver, spleen, lung, kidney, muscle) respond to highland altitude conditions. Our findings can be used to better understand the adaptive characteristics of Tibetan sheep to highland altitude environments. The key pathways and genes identified in this study can improve sheep’s ability to adapt to extreme environments.
Materials
Ethics statement
All experiments were conducted in the Key Laboratory of Conservation and Utilization of Animal Genetic Resources on the Qinghai-Tibet Plateau of the Ministry of Education. And the animal experiments were approved by the Animal Experiment Ethics Committee of Mian yang Normal University (2020-1-20).
RNA extraction
In this study, one-year-old male Tibetan sheep at highland altitude (from Ruoergai County, Sichuan Province, 3400 m above sea level), yearling Tibetan sheep (n = 3) and lowland altitude Tibetan (from Hu-Zhu County, Qinghai Province, 2550 m above sea level) sheep (n = 3) were collected as experimental animals. Total RNA was extracted from the tissues (lungs F, liver G, muscle J, spleen P, kidneys S, and heart X) using TRIzol® Reagent (Invitrogen, California, USA) according the instructions and genomic DNA was removed using DNase I (TaKara, Japan). RNA degradation and contamination was monitored on 1% agarose gels. Then RNA quality was determined by 2100 Bio-analyser (Agilent Technologies, Majorbio, China) and quantified using the ND-2000 (Nano Drop Technologies). Only high-quality RNA sample (OD260/280 = 1.8–2.2, OD260/230 ≥ 2.0, RIN ≥ 8.0, 28S:18S ≥ 1.0) was used to construct the sequencing library.
Library preparation, and Illumina Hiseq-Xten/nova Seq 6000 sequencing
RNA purification, reverse transcription, library construction and sequencing were performed at Shanghai Major Bio-pharm Biotechnology Co., Ltd. (Shanghai, China) according to the manufacturer’s instructions (Illumina, San Diego, CA). The transcriptome library was prepared following TruSeqTM RNA sample preparation Kit from Illumina (San Diego, CA) using 1 μg of total RNA. Shortly, messenger RNA was isolated according to the poly-A selection method by oligo(dT) beads and then fragmented by fragmentation buffer firstly. Secondly double-stranded cDNA was synthesized using a Super Script double-stranded cDNA synthesis kit (Invitrogen, CA) with random hexamer primers (Illumina). Then the synthesized cDNA was subjected to end-repair, phosphorylation and ‘A’ base addition according to Illumina’s library construction protocol. Libraries were size selected for cDNA target fragments of 300 bp on 2% Low Range Ultra Agarose followed by PCR amplified using Phusion DNA polymerase (NEB) for 15 PCR cycles. After quantified by TBS380, paired-end RNA-seq sequencing library was sequenced with the Illumina Nova-Seq 6000 sequencer (2 × 150 bp read length). Raw data from this study have been deposited into CNGB Sequence ArchiveCitation26 of China national GeneBank Data BaseCitation27 with accession number CNP0003239 (https://db.cngb.org/mycngbdb/submissions/project).
Read mapping
The raw paired end reads were trimmed and quality controlled by Seq-Prep (https://github.com/jstjohn/SeqPrep) and Sickle (https://github.com/najoshi/sickle) with default parameters. Clean reads were aligned to reference genome (Ovis_aries https://www.ncbi.nlm.nih.gov/genome/83?genome_assembly_id=351950) with orientation model through HISAT2 (daehwankimlab.github.io)) software.Citation28 Mapped reads of each sample were assembled by String Tie (https://ccb.jhu.edu/software/stringtie/index.shtml) t = 6 follow the method inference.Citation29 Finally, we verified the reliability of the sequencing data by RT-qPCR and homogenized the data by the 2−ΔΔCt method.
Differential expression analysis and functional enrichment
To identify DEGs (differential expression genes) between two different samples/altitude, the expression level of each gene was calculated according to the transcripts per million reads (TPM) method. RSEM (http://deweylab.biostat.wisc.edu/rsem/)Citation30 was used to quantify gene abundances. Essentially, differential expression analysis was performed using the DESeq2/DEG-seq/edgeR/Limma/NOIseq,Citation31–33 DEGs with |log2(foldchange)|≥1 and P-adjust ≤ 0.05 (DESeq2/edgeR/Limma)/P-adjust ≤ 0.001 (DEG-seq)/Prob > 0.8 (NOI-seq) were considered to be significantly differential expressed genes. In addition, functional-enrichment analysis including GO (Gene Ontology, http://www.geneontology.org) and KEGG (Kyoto Encyclopedia of Genes and Genomes, http://www.genome.jp/kegg/) were performed to identify which DEGs were significantly enriched in GO terms and metabolic pathways at P-adjust ≤ 0.05 compared with the whole-transcriptome background. GO functional enrichment and KEGG pathway analysis were carried out by Goatools (https://github.com/tanghaibao/Goatools) and KOBAS (http://kobas.cbi.pku.edu.cn/home.do).Citation34
Alternative splice events Identification
All the alternative splice events that occurred in our samples were identified by using the recently releases program RMATS (http://rnaseq-mats.sourceforge.net/index.html).Citation35 Only the isoforms that were similar to the reference or comprised novel splice junctions were considered, and the splicing differences were detected as exon inclusion, exclusion, alternative 5′, 3′, and intron retention events.
Results
Transcriptome assembly and analysis
Transcriptome sequencing was performed to analysis the expression model of the lung (F1, F2), liver (G1, G2), muscle (J1, J2), spleen (P1, P2), kidneys (S1, S2) and heart (X1, X2) in sheep from highland and lowland altitudes. After quality filtering, for example, each group in reads Q20 > 97%, Q30 > 93.75%, and the error rate is less than 0.1%. (1) Raw data: the total data amount of raw sequencing (the number of raw reads multiplied by the read length). (2) Clean reading: total number of entries for the sequencing data after quality control. (3) Clean base: the total amount of data after quality control sequencing. (4) Error rate (%): The basic average error rate corresponding to the quality data is generally below 0.1%. (5) Based on quality control (QC) sequencing data. Q20 and Q30 refer to the percentage of total bases with a sequencing mass of 99% and 99.9% or higher, respectively. (6) GC content (%): The sum of G and C bases, corresponding to quality control data, as a percentage of the total base. The total number of transcripts was 87,761, and the maximum length of transcripts over 1800 was 54,761(). The exact match obtained with the constant transcript ‘=’ complete match of intron chains has the highest number of transcripts 57,169, but ‘C’ assembled transcripts contains a minimum of 3 ().
Figure 1. Transcriptome assembly and analysis. (a) Histogram of transcript length distribution. Distribution of different transcript lengths, abscissa represents the transcript length range, the ordinate is the number of transcripts within the transcript length range. (b) Pie chart of the new transcripts. c: complete match of intron chain. i: transfrag falling entirely within a reference intron. j: potentially novel isoform(fragment), at least one splice junction is share d with a reference transcript. o: generic exon overlap with a reference transcript. u: unknown, intergenic transcript. x: exon overlap with reference on the opposite strand. =: complete match of intron chain.
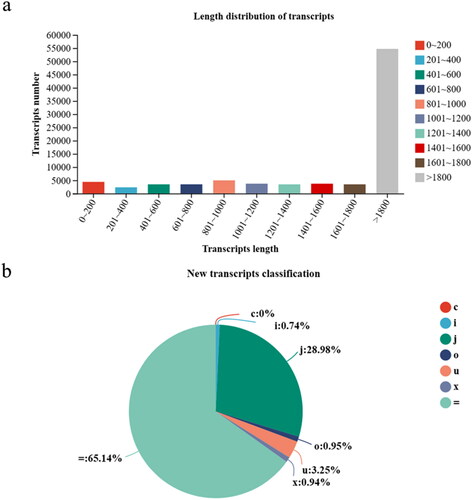
Table 1. Raw data and quality control data of each sample group.
Gene annotation and classification
As shown in , six databases (NR, Swiss-Prot, PFAM, COG, GO, and KEGG) were used to explore the biological functions. All genes and transcripts were annotated and classified according to biological function, of which 23,581 (92.77%), 22,231 (87.4%), 18,206 (71.6%), 22,147 (87.13%), 19,409 (76.36%) and 16,914 (66.54%). The similarities are highest in the NR database.
Table 2. Gene annotation and classification.
Subsequently, the genes were mapped to the GO and COG databases, respectively. In the GO database, genes were divided into three broad categories: biological processes, cell composition, and molecular function. Biological processes have the most genes. Interestingly, muscle (J) tissue expresses the largest number of genes in each function ().
Figure 2. Gene annotation and classification. (a) COG classification chart A-RNA processing and modification. B – Chromatin structure and dynamics. C – Energy production and conversion. D – Cell cycle control, cell division, chromosome partitioning. E – Amino acid transport and metabolism. F – Nucleotide transport and metabolism. G – Carbohydrate transport and metabolism. H – Coenzyme transport and metabolism. I – Lipid transport and metabolism. J – Translation, ribosomal structure and biogenesis. K – Transcription. L – Replication, recombination and repair. M – Cell wall/membrane/envelope biogenesis. N – Cell motility. O – Posttranslational modification, protein turnover, chaperones. P – Inorganic ion transport and metabolism. Q – Secondary metabolites biosynthesis, transport and catabolism. S – Function unknown. T – Signal transduction mechanisms. U – Intracellular trafficking, secretion, and vesicular transport. V – Defense mechanisms. Y – Nuclear structure. Z – Cytoskeleton. (b). GO classification map.
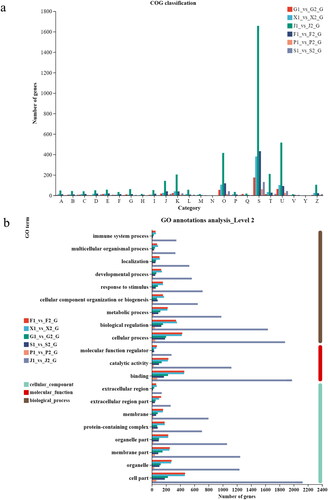
Genes were clustered into 21 functional classes in the COG databases (). Genes are also classified through the KEGG database according to the pathways or functions involved, namely metabolism, genetic information processing, environmental information processing, cellular processes, organism systems and human disease (Supplementary Fig. S1–S3). In all control groups (2 represent lowland altitude, 1 represent highland altitude), most of the genes belonged to lipid metabolism, immune system, and signal transduction.
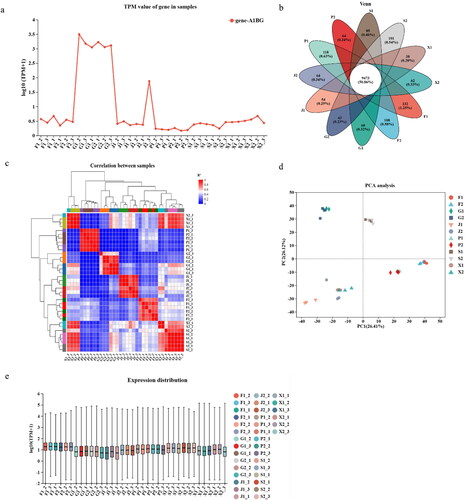
Figure 3. Gene expression analysis. (a) Correlation analysis of samples of different altitudes. (b) The abscissa represents the sample name/group name of the project, and the vertical coordinate represents the expression value of the target gene/transcript in each sample/group. (c) Circles of different colors indicate the number of genes/transcripts expressed in the sample/group, values indicate the number of common and unique genes/transcripts between different samples/groups, and intersecting regions of the circles represent the total number of genes/transcripts in each sample/group. (d) The lower right corner of the figure is the sample name, the upper left corner is the sample cluster, and the different colors indicate the correlation between the two samples. After the sample passes the dimensional analysis, there are relative coordinate points on the main assembly. The closer each sample point is, the greater the similarity between samples. The horizontal axis represents the contribution of principal component 1 (PC1) to the differential sample in the 3D plot, and the vertical axis represents the contribution of principal component 2 (PC2) to the differential sample in the 2D plot. (e) Number of gene expressions in the same tissue at different altitudes.
Gene expression analysis
Quantify gene/transcript expression levels of genes/transcripts, then convert them to Transcripts Per Million (TPM) to obtain normalized gene/transcript expression levels, and finally perform statistical scoring analysis on each set of transcripts. The results showed that these genes are most in the muscle compared to other tissues (). Subsequent intersections of genes co-expressed in each tissue indicated that a total of 9473 genes were expressed in six tissues (). Gene expression are similar in different altitudes different altitudes and in the same tissue (). Different samples show the same tissue with equal correlated values in different groups by Principal Component Analysis (PCA) (). More importantly, there were more gene expressions in the highland altitude treatment group than lowland altitude (). The above shows that the expression amount is similar in the same tissue of sheep at different altitudes, and the number of genes expressed is different.
Differential expressed genes in Tibet Sheep at different elevation
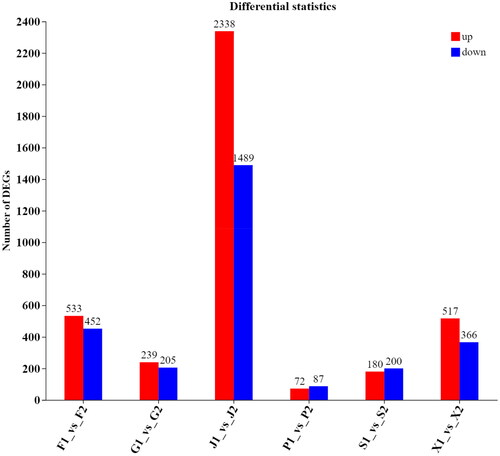
When p < .05 and |log2FC| > = 1, the gene considered to be differentially expressed. Differentially expressed genes are selected in various sheep tissues. 533 up-regulated genes and 452 down-regulated genes were found in the lungs (F1 vs F2), 239 up-regulated genes and 205 down-regulated genes in liver (G1 vs G2), 2338 up regulated genes and 1489 down regulated genes in muscle (J1 vs J2), 72 up-regulated genes and 87 down regulated genes in the spleen (P1 vs P2), 180 up-regulated genes and 200 down-regulated genes in the kidney (S1 vs S2), 517 up-regulated genes and 366 down-regulated genes in the heart (X1 vs X2) were screened, respectively (). Most DEGs are expressed at high land altitude, and interestingly, differential genes in the liver are very abundant at both high and low land.
Figure 4. Histogram of differential expressed genes in different tissues. The abscissa represents a different groups of difference comparison. The ordinate represents the corresponding number of up and down-regulated genes/transcripts. Red represents up and green represents down.
Key genes and pathways for resistance to plateau conditions
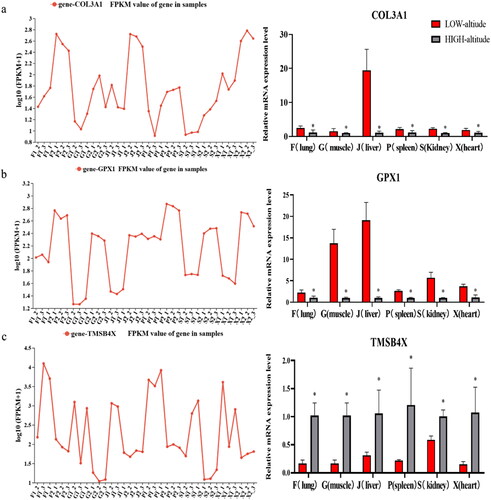
Six genes (LOC101112291, SELENOW, COL3A1, TMSB4X, HSF4) were identified by gene set analysis of the same tissues (heart, liver, spleen, lung, kidney, and muscle) of sheep at different altitudes (). Our goal is to identify signaling pathways and candidate genes associated with hypoxic adaptation, cold resistance, and anti-ultraviolet. Functional annotation of differentially expressed genes by KEGG. The top 20 enrichment KEGG pathways were shown in . KEGG subpopulation analysis showed that differentially expressed genes were enriched in 8 signaling pathways (relaxation signaling pathway, protein digestion and absorption, platelet activation, thyroid hormone synthesis, Regulation of actin cytoskeleton, arachidonic acid metabolism, glutathione metabolism, nucleotide excision repair), and human disease-related pathways were excluded from the analysis. The relaxing signaling pathway is a pathway of significant enrichment, while COL3A1 is a gene involved in most cellular pathways. All 8 pathways are enriched, 2 genes are involved in 3 pathways, and 4 genes are involved in 8 pathways, which are shown in . In this study single gene involving two or more pathways were considered key genes. The main reasons for the adaptation of Tibet sheep to plateau hypoxia, alpine, and UV strength may be the genes GPX1, TMSB4X and COL3A1 (Type III collagen A chain) expression, which plays an important role in the adaptation mechanism of the Qinghai-Tibet Sheep Plateau.
Figure 5. Key genes and pathways for resistance to plateau conditions. (a) Screening of key genes in response to sheep at different altitudes. The different colored circles represent a set of genes from a gene set. These values represent the number of genes is common or unique between two gene sets or three gene sets, the sum of all numbers in the circle indicates the total number of genes in that gene set, and crossed region of the circle represents the common number of genes between each gene set. (b,c) Annotation of KEGG function of key genes.
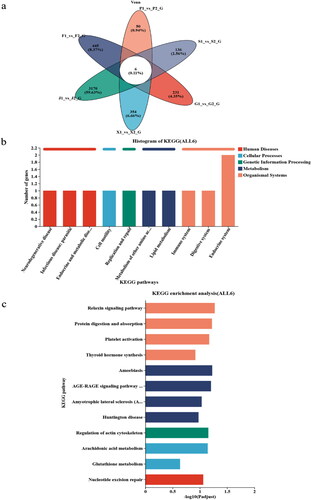
Table 3. Key genes and their associated pathways and functions.
RT-qPCR analysis
Three genes were selected from 6 DEGs, which had the most obvious effect on the adaptability of Plateau. Although the results showed differences in RT-qPCR results for individual genes compared to transcriptome sequencing results, the trend in results was consistent. Thus, the RNA-Seq results are reliable, and the comparisons of RT-qPCR with RNA-Seq is shown in .
Figure 6. RT-qPCR Validation. (a–c) On the left showed differences in the expression of the same gene in the same tissue in sheep at different high land. The results of the RT-qPCR analysis on the right showed that there were differences in the expression of the same gene in the same sheep tissue at different altitudes (three replicates per group). ‘*’ represents p < .05, the difference is significant.
Identification of alternative splicing genes
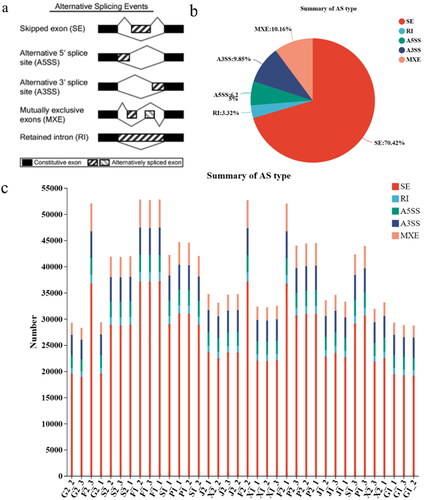
In most eukaryotic cells, alternative splicing (AS) is ubiquitous in gene expression. They perform different functions in different cell types and tissues, and have their own specific expressions and variations. We suspect that this may also be related to the mechanism of adaptation at highland altitudes in Tibet sheep. In this study, we analyzed the results of high-quality sequencing and found many AS events. RMATs (http://Rnaseq-mats.sourceforge.net/index.html) are alternative analysis for RNA-seq data applications that not only classify alternative splicing events but also analyze alternating splicing events to discover differences between different samples. In this regard, the alternative splicing events analyzed by RMATS can be divided into the following five categories (). These include exon jumps (Skipped exon, SE), first exon alternative splicing (Alternative 5’splice site A5SS), last exon alternative splicing (Alternative 3’splice site A3SS), exon selective jumps (Mutually exclusion exon MXE), intron were stranded (Retained intron RI). The specific pattern as shown in (). SE (70.42%) was the most frequent event, MXE (10.16%) was the second most frequent event, and the third was the A3SS event with the lowest frequency RI (3.36%). These results shows that the frequency of each group alternating stitching events in each group is significantly different, and the frequency of SE events is the highest ().
Figure 7. Identification of alternative splicing genes. (a) the Mode and mechanism of alternative splicing. (b) Proportion of each alternate splicing event. (c) Frequency of alternating splicing events in sheep tissue at different altitudes.
Transcriptome analysis of SNP features
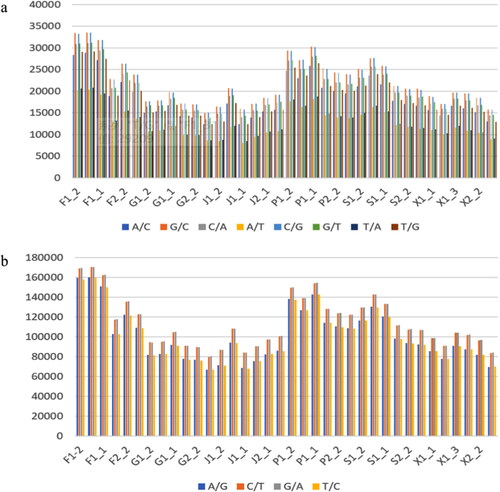
Transcriptome sequencing obtained 128274 SNPs (single nucleotide polymorphism) sites, where the number of transversion types (including C/T, T/C A/G, G/A) in is higher than the conversion type (), and the conversion types include A/T, A/C, T/G, C/G, T/A, G/T, G/C (). In addition to this, G/C type events are the most of conversion types in each group, and G/A events are the most of the conversion types. In addition, highland altitude tissues (group1) received more SNP events than lowland altitude tissues (group 2).
Figure 8. Single nucleotide polymorphism occurrence events and their distribution. (a) the distribution of conversion type SNP events in each group. (b) the distribution of transversion type SNP events in each group.
Discussion
The aim of our study was to identify key genes and important pathways for Tibet sheep to adapt to cold plateau by comparing transcriptome information of sheep living at different altitude. The analysis of the adaptation mechanism of the Tibet sheep lays the foundation for the development and utilization of Tibet sheep genetic resource. Animal tissues changes during the development stage to adapt to the environment, such as the plateau pika changing the thickness of the middle membrane to adapt low oxygen. Thus, adaptation to highland altitude tends to form a unique genetic mechanism.Citation36
Transcriptome sequencing is an excellent tool for exploring the potential mechanisms by which Tibet sheep adapt to hypoxia, cold resistance, and UV resistance in Tibet sheep. Differentially expressed genes were identified by GO functional enrichment analysis, and it was found that the changes in gene expression were closely related to biological functions. In addition, RNA-seq has been used in many fields, such as gene expression profiling, alternative splicing variants.Citation37 Transcriptome sequencing analysis can be used to study the altered expression of known genes and to speculate on the function of genes that have not yet been studied. It can therefore reveal the molecular mechanisms and mechanisms of action of certain regulatory genes, or can be used to analyze differences in gene expression levels in different tissues or different physiological states in the same tissue.
In this study, transcriptome sequencing was performed on sheep liver, kidney, lung, spleen, muscle, and heart. Screening of key genes of tibet sheep adapted to hypoxia, UV resistance and low-temperature resistance. Xist (Loc101112291) may influence the molecular mechanism of sheep litter size yields through methylation progresses.Citation38 Glutathione peroxidase 1 (GPX1) plays an important role in antioxidant stress, inflammatory signaling, sugar and lipid metabolism, follicle, and metabolic diseases. It is an important enzyme in the body’s antioxidant system. It can not only remove reactive oxygen species from the body and repair damaged cells, but also block further damage from reactive oxygen species to antibodies to oxidative stress in the organism. In addition, GPX1 is widely present in antioxidant enzymes and metalloproteases in organisms. Superoxide dismutase (SOD), GPX1 and catalase (CAT) form the first-line resistance in radiation tissues. SOD converts super oxygen cations into hydrogen peroxide, which is then detoxified into water by GPX and CAT.Citation39–43 As can be seen from , the expression level of GPX1 in Tibet sheep lower than that at lowland altitude areas, so we infer that GPX1 may play an important role in the UV resistance of Tibet sheep on the plateau. SELENOW (Selenium protein W) plays a role in antioxidants and supports brain function.Citation44,Citation45 COL3A1, as a type III collagen, is mainly found in the extracellular matrix, which is the most abundant protein in animals, providing support, connection, nutrition, and protection for parenchymal cells, and is involved in maintaining the integrity of smooth muscle. COL3A1 is widely involved in life activities, and studies have shown that COL3A1 gene expression is affected by body weight and genotype and has an important effect on intramuscular collagen content.Citation46–49 TMSB4X (Thymosin) is a small-molecule protein that is spherical and modulator of actin. In addition to being a component of the cytoskeleton, TMSB4X is expressed in most cells and is involved in many biological activities such as cell migration and adhesion, wound healing, intracellular signal transduction, anti-inflammatory, cardiac development, retinal neonatal tubules, cytoskeletal network, protein catabolism, apoptosis, cell survival and stem cell formation. Actin polymerization and depolymerization are essential for a wide variety of cells, including cell migration, chemotaxis, maintenance of cellular traits and cell division.Citation50–53 The results showed that TMSB4X was expressed most in Tibet sheep lung tissue, suggesting that TMSB4X may play an important role in the adaptation of Tibet sheep to plateau hypoxia. HSF4 (heat shock transcription factor4) regulates the expression of non-heat shock protein and participates in cell development.Citation54 Our experiment was conducted through transcriptome sequencing of different tissues (heart, liver, spleen, lung, kidney, and muscle). Muscle (J) tissue has the largest number of genes, and a reference transcription database has been established to facilitate the application of RNA SEQ in Tibet or other sheep. As an important regulator in response to hypoxia, hypoxia inducible factors(HIFs) are key regulators of gene expression during hypoxia. HIF1α is also a transcription factor for numerous target genes which mediate multiple biological functions, such as angiogenesis, hematopoiesis and the maintenance of vascular tone to provide or replenish tissues with blood and oxygen. HIF1α further mediates cellular response to hypoxia by regulating glucose uptake and anaerobic respiration in oxygen-depleted environments.Citation55 HIF3α was considered as negative mediator of HIF-regulated genes, which negatively affects gene expression by competing with HIF-1α. In this study the expression of HIF1α and HIF3α is differ in different land sheep, but was no significant.Citation56
The GO databaseCitation57 is suitable for various of species, it can describe genes and proteins. In the DEGs (differentially expressed genes), the results of GO enrichment analysis in this study show that cellular components are enriched in both molecular function and biological process. Many categories are related to biological regulation, cell modalities and binding, which indicates the differences in these aspects of sheep at different altitude sheep.
KEGG pathway analysis can be used to obtain some of the signaling pathways involved in DEGs, as the biological function of these genes can be further understood through the analysis of gene metabolic pathways.Citation58 This study shows that the relaxation signaling pathway, protein digestion and absorption, platelet activation, thyroid hormone synthesis, actin cytoskeletal regulation, arachidonic acid metabolism, glutathione metabolism, nucleotide excision repair may become the key pathways for Tibet sheep to adapt to the plateaus, hypoxia, and UV resistant. The relaxation signaling pathway relaxes the smooth muscles of the womb and softens the cervical and pelvic ligaments. Relaxation signaling pathway may also lower acute heart failure and blood pressure to reduce pimples.Citation59 The digestion and absorption of proteins can produce many functional peptides, which play an important role in health.Citation60 Platelet activation mediates intracellular signaling pathways that regulate a wide range of biological functions in the body. Platelet activation promotes arachidonic acid metabolism, and its receptor PAFR (platelet activation factor receptor) regulates the body’s broad biological function by coupling to G-protein to participate in multiple signaling pathways within cells.Citation61,Citation62 Thyroid hormone synthesis is responsible for the metabolism of thermogenic substance and the promotion of growth, in addition to being an important mechanism for regulating the levels of active hormone in cells.Citation63,Citation64 Regulation of actin cytoskeleton plays an important role in many biological procession, cell division, cell enlargement and cell signal transduction.Citation65,Citation66 Arachidonic acid metabolism plays an important role in blood pressure regulation and inhibition of multiplexes and promotes the occurrence of inflammatory factors.Citation67 Glutathione metabolism depletes free radicals produced by oxidative stress in the body, protects cell membranes and ensures health.Citation68 Nucleotide excision repair (NER): repairs pyrimidine dimer due to ultraviolet bonding (pyrimidine dimer) DNA crosslinking and bulky adducts.Citation69 These pathways maybe pathways for Tibet sheep to adapt to hypoxia, alpine, and UV resistance.
Sites of SNP/Indel are widely distributed in transcriptomes, SNPs and indel sites and their characteristics were analyzed by sheep transcriptome at different altitudes. the number of conversions is much higher than the inverted type, this phenomenon was called conversion bias.Citation70 It may be related to evolution selection, rather than random selection.Citation71 In addition, the distribution characteristics of AS events are also noteworthy, studies have shown that different RNA splice variants of genes increase in response to hypoxia, such as VEGF clippers are expressed in response to hypoxia.Citation72 In addition, when dealing with strong ultraviolet light, the RNA splice variants expression of CYPI7B1 increases, and it leads to reduced enzyme activity and (OH)2D3 synthesis.Citation73 For environmental adaptation, the RNA of some genetic viruses will adapt to the environment through mutations in order to adapt to new hosts.Citation74 These results of this study will provide data and a theoretical basis for subsequent studies of Tibet sheep.
Conlusion
In this study, transcriptome sequencing was used to analyze the heart, liver, spleen, lung, kidney, and muscle tissue in sheep at different altitudes. LOC101112291, SELENOW, COL3A1, TMSB4X and HSF4 were selected as candidate genes for plateau adaptation in Tibet sheep, as well as pathways such as glutathione metabolism, arachidonic acid metabolism, nucleotide excision repair, regulation of actin cytoskeleton, protein digestion and absorption, thyroid hormone synthesis, relaxation signaling may play an important role in adapting to plateau environment. Structural analysis of genes showed that the highland altitude tissue received more SNP events than the lowland altitude tissue, which may also be related to the adaptation mechanism of Tibetan sheep to highland altitude. This study will lay a certain foundation for Tibet sheep research.
Author contributions
Jingling Wang and An Li designed the study and wrote the manuscript; Yanyan Li, Yaq Lin, Yong Wang, Qilin Dai, Shizhang Du and Ru Yi preformed research; Zhoucuo Qi and An Li analyzed data. All authors read and approved this manuscript.
Supplemental Material
Download MS Word (2.6 MB)Acknowledgements
The authors acknowledge assistance from the goat lipid metabolism research lab.
Disclosure statement
No potential conflict of interest was reported by the authors.
Data availability statement
The data support this fundings of this study are openly available in CNGB Sequence Archive(CNSA) of China National GeneBank DataBase with accession number CNP0003239.
Additional information
Funding
References
- Ramirez JM, Folkow LP, Blix AS. Hypoxia tolerance in mammals and birds: from the wilderness to the clinic. Annu Rev Physiol. 2007;69(1):113–143.
- Thompson LG, Mosley-Thompson E, Davis ME, et al. Holocene–late pleistocene climatic ice core records from Qinghai-Tibetan plateau. Science. 1989;246(4929):474–477.
- Janský L. Non-shivering thermogenesis and its thermoregulatory significance. Biol Rev Camb Philos Soc. 1973;48(1):85–132.
- Khedoe PP, Hoeke G, Kooijman S, et al. Brown adipose tissue takes up plasma triglycerides mostly after lipolysis. J Lipid Res. 2015;56(1):51–59.
- Hoeke G, Kooijman S, Boon MR, Rensen PC, Berbée JF. Role of brown fat in lipoprotein metabolism and atherosclerosis. Circ Res. 2016;118(1):173–182.
- Cockell CS, Horneck G. The history of the UV radiation climate of the earth–theoretical and space-based observations. Photochem Photobiol. 2001;73(4):447–451.
- Beall CM. Two routes to functional adaptation: Tibetan and Andean high-altitude natives. Proc Natl Acad Sci U S A. 2007;104(Suppl 1):8655–8660.
- Silove ED, Grover RF. Effects of alpha adrenergic blockade and tissue catecholamine depletion on pulmonary vascular response to hypoxia. J Clin Invest. 1968;47(2):274–285.
- Heath D, Williams D, Dickinson J. The pulmonary arteries of the yak. Cardiovasc Res. 1984;18(3):133–139.
- van den Berg R, Kooijman S, Noordam R, et al. A diurnal rhythm in brown adipose tissue causes rapid clearance and combustion of plasma lipids at wakening. Cell Rep. 2018;22(13):3521–3533.
- Bouillaud F, Couplan E, Pecqueur C, Ricquier D. Homologues of the uncoupling protein from brown adipose tissue (UCP1): UCP2, UCP3, BMCP1 and UCP4. Biochim Biophys Acta. 2001;1504(1):107–119.
- Setlow RB, Swenson PA, Carrier WL. Thymine dimers and inhibition of DNA synthesis by ultraviolet irradiation of cells. Science. 1963;142(3598):1464–1466.
- Li M, Tian S, Jin L, et al. Genomic analyses identify distinct patterns of selection in domesticated pigs and Tibetan wild boars. Nat Genet. 2013;45(12):1431–1438.
- Wang G, Luo Y, Hu J, Wang J, Liu X, Li S. Effects of aging on expression of Mic60 and OPA1 and mitochondrial morphology in myocardium of Tibetan sheep. Animals. 2020;10(11):2160.
- Niu L, Chen X, Xiao P, et al. Detecting signatures of selection within the Tibetan sheep mitochondrial genome. Mitochondrial DNA A DNA Mapp Seq Anal. 2017;28(6):801–809.
- Tang Q, Gu Y, Zhou X, et al. Comparative transcriptomics of 5 high-altitude vertebrates and their low-altitude relatives. Gigascience. 2017;6(12):1–9.
- Jarmakani JM, Nagatomo T, Nakazawa M, Langer GA. Effect of hypoxia on myocardial high-energy phosphates in the neonatal mammalian heart. Am J Physiol. 1978;235(5):H475–H481.
- Komolova GS, Egorov IA. Osobennosti transkriptsionnoĭ aktivnosti iadernoĭ DNK pecheni pri dlitel’noĭ adaptatsii k vysotnoĭ gipoksii [Characteristics of the transcription activity of liver nuclear DNA in long-term adaptation to altitude hypoxia]. Izv Akad Nauk SSSR Biol. 1985;(1):25–30.
- Ou LC, Kim D, Layton WM Jr, Smith RP. Splenic erythropoiesis in polycythemic response of the rat to high-altitude exposure. J Appl Physiol Respir Environ Exerc Physiol. 1980;48(5):857–861.
- Moromisato DY, Moromisato MY, Zanconato S, Roberts CT. Jr Effect of hypoxia on lung, heart, and liver insulin-like growth factor-I gene and receptor expression in the newborn rat. Crit Care Med. 1996;24(6):919–924.
- Luks AM, Johnson RJ, Swenson ER. Chronic kidney disease at high altitude. J Am Soc Nephrol. 2008;19(12):2262–2271.
- Bao G, Li S, Zhao F, et al. Comprehensive transcriptome analysis reveals the role of lncRNA in fatty acid metabolism in the longissimus thoracis muscle of Tibetan sheep at different ages. Front Nutr. 2022;9:847077.
- Liu J, Yuan C, Guo T, et al. Genetic signatures of high-altitude adaptation and geographic distribution in Tibetan sheep. Sci Rep. 2020;10(1):18332.
- Ganjurjav H, Zhang Y, Gornish ES, et al. Differential resistance and resilience of functional groups to livestock grazing maintain ecosystem stability in an alpine steppe on the Qinghai-Tibetan Plateau. J Environ Manage. 2019;251:109579.
- Tong X, Yang Y, Wang W, et al. Expression profiling of abundant genes in pulmonary and cardiac muscle tissues of Tibetan Antelope (Pantholops hodgsonii). Gene. 2013;523(2):187–191.
- Guo X, Chen F, Gao F, et al. CNSA: a data repository for archiving omics data. Database. 2020;2020:baaa055.
- Chen FZ, You LJ, Yang F, et al. CNGBdb: China National GeneBank DataBase. Yi Chuan. 2020;42(8):799–809.
- Kim D, Langmead B, Salzberg SL. HISAT: a fast spliced aligner with low memory requirements. Nat Methods. 2015;12(4):357–360.
- Pertea M, Pertea GM, Antonescu CM, Chang TC, Mendell JT, Salzberg SL. StringTie enables improved reconstruction of a transcriptome from RNA-seq reads. Nat Biotechnol. 2015;33(3):290–295.
- Li B, Dewey CN. RSEM: accurate transcript quantification from RNA-seq data with or without a reference genome. BMC Bioinformatics. 2011;12(1):323.
- Love MI, Huber W, Anders S. Moderated estimation of fold change and dispersion for RNA-seq data with DESeq2. Genome Biol. 2014;15(12):550.
- Wang L, Feng Z, Wang X, Wang X, Zhang X. DEGseq: an R package for identifying differentially expressed genes from RNA-seq data. Bioinformatics. 2010;26(1):136–138.
- Robinson MD, McCarthy DJ, Smyth GK. edgeR: a bioconductor package for differential expression analysis of digital gene expression data. Bioinformatics. 2010;26(1):139–140.
- Wu J, Mao X, Cai T, Luo J, Wei L. KOBAS server: a web-based platform for automated annotation and pathway identification. Nucleic Acids Res. 2006;34:W720–W724.
- Shen S, Park JW, Lu ZX, et al. rMATS: robust and flexible detection of differential alternative splicing from replicate RNA-Seq data. Proc Natl Acad Sci U S A. 2014;111(51):E5593–E5601.
- Wang D, Sun R, Wang Z, Liu J. Effects of temperature and photoperiod on thermogenesis in plateau pikas (Ochotona curzoniae) and root voles (Microtus oeconomus). J Comp Physiol B. 1999;169(1):77–83.
- Qi XZ, Wang XJ, Zhu SH, Rao XF, Wei L, Wei DB. Hypoxic adaptation of the hearts of plateau zokor (Myospalax baileyi) and plateau pika (Ochotona curzoniae). Sheng li Xue Bao. 2008;60(3):348–354.
- Liu A, Liu M, Li Y, Chen X, Zhang L, Tian S. Differential expression and prediction of function of lncRNAs in the ovaries of low and high fecundity Hanper sheep. Reprod Domest Anim. 2021;56(4):604–620.
- Ceko MJ, Hummitzsch K, Hatzirodos N, et al. X-Ray fluorescence imaging and other analyses identify selenium and GPX1 as important in female reproductive function. Metallomics. 2015;7(1):71–82.
- Lubos E, Loscalzo J, Handy DE. Glutathione peroxidase-1 in health and disease: from molecular mechanisms to therapeutic opportunities. Antioxid Redox Signal. 2011;15(7):1957–1997.
- Huang JQ, Zhou JC, Wu YY, Ren FZ, Lei XG. Role of glutathione peroxidase 1 in glucose and lipid metabolism-related diseases. Free Radic Biol Med. 2018;127:108–115.
- Bozinovski S, Seow HJ, Crack PJ, Anderson GP, Vlahos R. Glutathione peroxidase-1 primes pro-inflammatory cytokine production after LPS challenge in vivo. PLOS One. 2012;7(3):e33172.
- Park EM, Ramnath N, Yang GY, et al. High superoxide dismutase and low glutathione peroxidase activities in red blood cells predict susceptibility of lung cancer patients to radiation pneumonitis. Free Radic Biol Med. 2007;42(2):280–287.
- Beilstein MA, Vendeland SC, Barofsky E, Jensen ON, Whanger PD. Selenoprotein W of rat muscle binds glutathione and an unknown small molecular weight moiety. J Inorg Biochem. 1996;61(2):117–124.
- Zhang L, Zhu JH, Zhang X, Cheng WH. The thioredoxin-like family of selenoproteins: implications in aging and age-related degeneration. Biol Trace Elem Res. 2019;188(1):189–195.
- Bergqvist D. Ehlers-Danlos type IV syndrome. A review from a vascular surgical point of view. Eur J Surg. 1996;162(3):163–170.
- McCormick RJ. Extracellular modifications to muscle collagen: implications for meat quality. Poult Sci. 1999;78(5):785–791.
- Stevenson K, Kucich U, Whitbeck C, Levin RM, Howard PS. Functional changes in bladder tissue from type III collagen-deficient mice. Mol Cell Biochem. 2006;283(1–2):107–114.
- Bao X, Zeng Y, Wei S, et al. Developmental changes of Col3a1 mRNA expression in muscle and their association with intramuscular collagen in pigs. J Genet Genomics. 2007;34(3):223–228.
- Shomali N, Baradaran B, Deljavanghodrati M, et al. A new insight into thymosin β4, a promising therapeutic approach for neurodegenerative disorders. J Cell Physiol. 2020;235(4):3270–3279.
- Sanders MC, Goldstein AL, Wang YL. Thymosin beta 4 (Fx peptide) is a potent regulator of actin polymerization in living cells. Proc Natl Acad Sci U S A. 1992;89(10):4678–4682.
- Zhang J, Zhang ZG, Li Y, et al. Thymosin beta4 promotes oligodendrogenesis in the demyelinating central nervous system. Neurobiol Dis. 2016;88:85–95.
- Smart N, Risebro CA, Melville AA, et al. Thymosin beta4 induces adult epicardial progenitor mobilization and neovascularization. Nature. 2007;445(7124):177–182.
- Cui X, Zhang J, Du R, et al. HSF4 is involved in DNA damage repair through regulation of Rad51. Biochim Biophys Acta. 2012;1822(8):1308–1315.
- Ebersole JL, Novak MJ, Orraca L, et al. Hypoxia-inducible transcription factors, HIF1A and HIF2A, increase in aging mucosal tissues. Immunology. 2018;154(3):452–464.
- Zhang P, Yao Q, Lu L, Li Y, Chen PJ, Duan C. Hypoxia-inducible factor 3 is an oxygen-dependent transcription activator and regulates a distinct transcriptional response to hypoxia. Cell Rep. 2014;6(6):1110–1121.
- Klopfenstein DV, Zhang L, Pedersen BS, et al. GOATOOLS: a python library for gene ontology analyses. Sci Rep. 2018;8(1):10872.
- McKenna A, Hanna M, Banks E, et al. The genome analysis toolkit: a MapReduce framework for analyzing next-generation DNA sequencing data. Genome Res. 2010;20(9):1297–1303.
- Kania A, Lewandowski MH, Błasiak A. Relaksyna-3 i receptory rodziny peptydów relaksynowych–od struktury po funkcje nowo odkrytego układu mózgowia ssaków [Relaxin-3 and relaxin family peptide receptors–from structure to functions of a newly discovered mammalian brain system]. Postepy Hig Med Dosw. 2014;68:851–864.
- Gilbert ER, Wong EA, Webb KE. Board-invited review: peptide absorption and utilization: Implications for animal nutrition and health. J Anim Sci. 2008;86(9):2135–2155.
- Ishii S, Shimizu T. Platelet-activating factor (PAF) receptor and genetically engineered PAF receptor mutant mice. Prog Lipid Res. 2000;39(1):41–82.
- Honda Z, Nakamura M, Miki I, et al. Cloning by functional expression of platelet-activating factor receptor from guinea-pig lung. Nature. 1991;349(6307):342–346.
- Rivolta CM, Targovnik HM. Molecular advances in thyroglobulin disorders. Clin Chim Acta. 2006;374(1–2):8–24.
- Song Y, Yao X, Ying H. Thyroid hormone action in metabolic regulation. Protein Cell. 2011;2(5):358–368.
- dos Remedios CG, Chhabra D, Kekic M, et al. Actin binding proteins: regulation of cytoskeletal microfilaments. Physiol Rev. 2003;83(2):433–473.
- Lee KT, Nam JW. Post-transcriptional and translational regulation of mRNA-like long non-coding RNAs by microRNAs in early developmental stages of zebrafish embryos. BMB Rep. 2017;50(4):226–231.
- Lasker JM, Chen WB, Wolf I, Bloswick BP, Wilson PD, Powell PK. Formation of 20-hydroxyeicosatetraenoic acid, a vasoactive and natriuretic eicosanoid, in human kidney. Role of Cyp4F2 and Cyp4A11. J Biol Chem. 2000;275(6):4118–4126.
- Moore WR, Anderson ME, Meister A, Murata K, Kimura A. Increased capacity for glutathione synthesis enhances resistance to radiation in Escherichia coli: a possible model for mammalian cell protection. Proc Natl Acad Sci U S A. 1989;86(5):1461–1464.
- Petruseva IO, Evdokimov AN, Lavrik OI. Molecular mechanism of global genome nucleotide excision repair. Acta Naturae. 2014;6(1):23–34.
- Morton BR. Neighboring base composition and transversion/transition bias in a comparison of rice and maize chloroplast noncoding regions. Proc Natl Acad Sci U S A. 1995;92(21):9717–9721.
- Wakeley J. The excess of transitions among nucleotide substitutions: new methods of estimating transition bias underscore its significance. Trends Ecol Evol. 1996;11(4):158–162.
- Watkins WM, McCollum GW, Savage SR, Capozzi ME, Penn JS, Morrison DG. Hypoxia-induced expression of VEGF splice variants and protein in four retinal cell types. Exp Eye Res. 2013;116:240–246.
- Seifert M, Tilgen W, Reichrath J. Expression of 25-hydroxyvitamin D-1alpha-hydroxylase (1alphaOHase, CYP27B1) splice variants in HaCaT keratinocytes and other skin cells: modulation by culture conditions and UV-B treatment in vitro. Anticancer Res. 2009;29(9):3659–3667.
- Sanjuán R, Domingo-Calap P. Mechanisms of viral mutation. Cell Mol Life Sci. 2016;73(23):4433–4448.