
Abstract
The Meiren yak is an important genetic resource in Gansu Province, China. In this study, we aimed to explore the evolutionary history and population structure of the genetic resource of Meiren yak and to mine the characteristic genes of Meiren yak. We analysed a total of 93 yaks of eight yak breeds based on whole genome resequencing combined with population genomics and used θπ ratio and Fst method to screen the selected sites in the genome region. The results proved that Meiren yak can be used as a potential genetic resource in Gansu Province. The genes in Meiren yak with positive selection in selection signal analysis were subjected to the Gene ontology (GO) and Kyoto Encyclopedia of Genes and Genomes (KEGG) functional enrichment analyses, which indicated that the genes were related to the adaptability to high altitude and hypoxic environment. By analysing the genetic variation of Meiren yak at the genome-wide level, this study provided a theoretical basis for genetic improvement of Meiren yak and for the development of high-quality yak resources.
Introduction
Yak (Bos grunniens) belonging to class Mammalia and family Bovidae, is a large mammal living in the plateau.Citation1 As they live in harsh environment for a long time, yaks have strong stress-resistance and high disease-resistance.Citation2 Yak is called as ‘the boat of plateau’ and ‘versatile livestock’. It is a very important gene bank of animals living on the plateau.Citation3 The population of yaks in China is more than 16 million,Citation4 accounting for more than 95% of all yaks globally.Citation5 Moreover, China has the most number of yak breeds,Citation6 with different regions having own representative breeds. Currently, wild yak and domestic yak are considered two subspecies of yak.Citation7,Citation8 The distribution of yaks in China is mainly concentrated on the Qinghai–Tibet Plateau and extends around Pamirs to Tibet, Qinghai and Gansu.Citation9 Yak is the dominant local livestock breed and source of meat and fur in the plateau area; therefore, it has high applied economic value.Citation10 However, currently, population of yaks is decreasing.Citation11 Therefore, this should be urgently prevented by improving yak breeds and cultivating new breeds. In the long-term evolution process, yaks have developed relatively stable genetic characteristics and physiological and biochemical mechanisms.Citation12
Meiren yak is an excellent local type of yak in Gannan, which is mainly distributed in the cooperative city of Gannan Tibetan Autonomous Prefecture at an altitude of approximately 3600 m with a typical plateau continental climate. The average slaughter rate of Meiren yak is 50.8%, and the average dressing percentage is 39.3%. Its meat is tender, low in fat, and high in protein. A local saying states that ‘Meiren yak is a wall’, indicating that Meiren yak has a strong physique and well-developed muscles. Indeed, Meiren yak has obvious advantages among other types of yaks in Gannan. Meiren yaks have lived long-term nomadic life; inbreeding of Meiren yak leads to serious degradation in the variety, and no improvement in meat or fur production is observed. This is causing slow growth and development, low reproduction rate, reduced production performance and weight loss in these yaks year by year.Citation13 The breeding history of Meiren yak consists of a cycle of domestication–wild yak gene infiltration–domestication. Under the long-term natural selection and artificial breeding, it has developed strong disease resistance, adaptability, and unique physiological mechanisms. As an excellent subtype of Gannan yak, Meiren yak is an extremely important livestock genetic resource in China and there has a lot of development value.
Whole genome resequencing can be used to sequence the genomes of multiple samples or animal groups and compare with the published reference genomes for analysing the differences. With this, a large number of genetic variations can be identified, which has great application prospects in current research on breeding.Citation14,Citation15 Whole genome resequencing is a category of population genomics and population genetics.Citation16 Through whole genome sequencing, we can infer not only the population history of species but also the differences within and between groups of the same species..Citation17 With the gradual development of sequencing technology and data processing, we can calculate and analyse the degree of segregationCitation18 and speculate the population evolution (such as linkage disequilibrium (LD) analysis, inbreeding coefficient, identification of genetic relationship, domestication and migration and verification of functional genes) using population genomics.Citation19 Liu et al.Citation20 sequenced and analysed certain locations in the genomes of 32 tigers and revealed that they had retained 1.8 million high-quality single-nucleotide polymorphisms (SNPs). This indicated that tigers had experienced at least one population bottleneck effect, and at the same time, the existing tiger population was divided into six subspecies. This provided a scientific basis for the protection of tigers. Kim et al.Citation21 studied 48 native African cattle, compared their genomes with those of 4 strains of cattle from different sources, and revealed the mechanism of strong adaptability of African cattle to harsh environment. Wu et al.Citation22 studied 98 samples of 5 species of bovine genus and reported that gene infiltration existed in different individuals and this infiltration was an important basis for adaptive variation. Guo et al.Citation23 sequenced the whole genome of six goat breeds, annotated the genomes, and identified several genes related to their important economic traits, such as high altitude adaptability (EPAS2) and goat coat colour (IRF2, EXOC2, etc.), enhancing the understanding of adaptation mechanisms in goats. Chen et al.Citation24 studied 49 modern breeds and eight East Asian breeds of cattle and reported for the first time that the domesticated cattle in the world can be divided into 5 continental groups;, this provided a new insight for their origin and historical migration. Fan et al.Citation25 sequenced the genomes of more than 500 sika deer, red deer, and hybrid deer and selected 1,000 specific SNPs loci from more than 13 million screened loci to synthesize a chip. This chip can accurately distinguish sika deer from hybrid deer, thus providing a basis for the protection of related germplasm resources. Li et al.Citation26 studied 70 goats from Inner Mongolia and Liaoning. They identified a large number of genetic variations, enhanced understanding of genetic diversity of different phenotypes, and provided molecular basis for livestock breeding.
As a valuable resource bank of yak genes, the genetic differentiation and classification of Chinese yak has always been a difficult problem in genetics.Citation27 Whole genome sequencing technology has been fully applied in species research, and provided theoretical data for the protection and breeding of species.Citation28 At present, there is no analysis on the genetic structure of Meiren Yak population within the whole genome resequencing.In our experiment, 93 samples from eight breeds, including Meiren Yak、 Changtai Yak、 Muli Yak、 Pamier Yak、 Sibu Yak、 Tianzhu Yak and Zhongdian Yak, were sequenced, and the population genomics was compared, so as to provide theoretical basis for genetic improvement of Meiren Yak and a good research foundation for the development and utilization of high-quality resources.
Materials and methods
Ethics statement
All animal studies conducted in this study were approved by the Animal Administration and Ethics Committee of Lanzhou Institute of Husbandry and Pharmaceutical Sciences, Chinese Academy of Agricultural Sciences (SYXK-2014–0002).
Sample collection, blood DNA extraction and whole genome resequencing
We performed genome-wide resequencing using 93 blood samples from eight yak breeds (Meiren、 Changtai、 Jiulong、 Muli、 Pamier、 Sibu、 Tianzhu and Zhongdian yaks; n = 19、 6、 16、 15、 10、 11、 8 and 8, respectively). In total, 10 mL blood was collected from the jugular vein, placed in EDTA anticoagulation tube, and stored at −20 °C till further analysis. DNA was extracted using EasyPure Blood Genome DNA Kit (Quanjin, Beijing) and specifically adsorbed using enzymatic hydrolysis and silica gel membrane centrifugal column. The DNA integrity, concentration, and quality were determined using agarose gel electrophoresis and ultraviolet spectrophotometer NanoDrope2000. Genomic DNA was sequenced on illumina PE150 platform. Instructions for use of animals: All yaks used in this study were personally owned by local herdsmen and obtained the informed consent of the animal owner.
Whole genome sequence alignment and detection of genetic variation
Certain errors in the data generated after DNA extraction, library construction, and sequencing (e.g., sequencing errors and no detection of bases) will have corresponding effects on subsequent analysis. Therefore, to ensure the accuracy of bioinformatic analysis, we first evaluated the quality of the sequenced data and screened high-quality reads. This quality control was performed using Trimmomatic,Citation29 and high-quality reads were compared with the latest reference yak genome (GCA_005887515.1). SNP identification was performed using GATK software, and the SelectVariant and VariantFiltration parameters included in GATK software were used to set QUAL、 QD、 FS、 MQ、 HaplotypeScore and other conditions for SNP filtering.Citation30 The conditions were as follows: QUAL < 30.0、 QD < 2.0、 FS > 60.0、 MQ < 40.0 and HaplotypeScore > 13.0. To prevent the influence of sex and low allele frequency on subsequent analysis, PLINKCitation31 was used to remove the following: minimum allele frequency < 0.05, the individual detection rate < 0.95, the SNP detection rate < 0.99, no chromosomal assignment, and SNP on the sex chromosome. The conditions were as follows: –mAF 0.05 –mind 0.05 –geno 0.01 –chr 1-29.
Population genomic analysis
Construction of phylogenetic tree, principal components, group structure and kinship analysis
The most important and common aspect of phylogenetic analysis is the construction of phylogenetic trees. Phylogenetic trees are also called clustering trees or evolutionary trees. Phylogenetic trees can reflect the evolutionary relationship and evolution of species, kinship of samples within the group and the classification and evolutionary relationship of gene family members. We used PLINKCitation31 software to calculate the genetic distance matrix between individuals based on the genotypic information of SNP data and further used the adjacency method to construct a phylogenetic tree.
Principal component analysis (PCA) is a cluster analysis method. It is a commonly used analytical method in population genetics and widely used in many disciplines. In genetics, PCA can classify individuals according to principal components as per the differences in SNPs on the individual genome; it uses fewer variables to explain most of the variation in the original data, transforms many highly correlated variables into independent or uncorrelated variables, and helps in understanding the clustering and differences of the study population. We used PLINKCitation31 for PCA of autosomal SNP data. bcftools was used to extract a subset of VCF files. First, the VCF file was converted to plink format, resulting in three files ending in ‘.map’, ‘.nosex’ and ‘.ped’. A binary bed file was generated based on the ‘.ped’ file, and two files ending in ‘.bim’ and ‘.bed’ were obtained. Further, PCA analysis was performed to obtain two files ending in ‘.eigenval’ and ‘.eigenvec’. The ‘.eigenval’ file represents the proportion of each PCA, and the ‘.eigenvec’ file records the feature vectors used for plotting the coordinates. Finally, the PCA plot was visualized using the ggplot2 package in R language.
Population structure analysis was first produced by the “STRUCTURE” software; therefore, it is also known as STRUCTURE analysis. It is an important genetic structure analysis tool, which can divide a population into several subgroups according to molecular genetics, infer the optimal number of groups of a population, and determines any gene communication among different subpopulations and the degree of hybridization of individuals within the subgroup. In this study, ADMIXTURECitation32 software was used to estimate the mixing ratio of each component in the population according to the expectation maximization (EM) algorithm, and finally, the ggplot2 and pophelper packages in R were used to draw the population structure stacking map.
To identify individual samples with close genetic relationship and remove the influence of these samples on subsequent analysis, in this study, we used the KING-kinshipCitation33 software to calculate the kinship coefficient between two individuals for all SNP sites. Finally, the R-packet corrplot was used to visualize the affinity matrix.
Heterozygosity, linkage disequilibrium and continuous homozygous region analysis
Heterozygosity, also known as population mean heterozygosity, refers to the presence of one or more different alleles at a certain site. As the basis of the adaptation and evolution of a population or species, genetic diversity is an important reference index for the assessment of the status of germplasm resources. We used the mlRhoCitation34 software to calculate the heterozygosity of individuals as one of the indicators to assess genetic diversity.
LD refers to the chance that alleles from two or more gene loci appear on a chromosome at the same time with frequency higher than the random frequency. Currently, it is under focus in studies related to population genetics and plays an important role in the study of population evolution. LD can be influenced by factors such as genetic drift, changes in mutation rate, and gene conversion. Therefore, studying the decay in LD can reveal the history of genetic recombination in the population. In this experiment, the PopLDdecayCitation35 software was used to calculate the degree of LD in the population, and the decay of LD was plotted using the software’s own Plot_MultiPop.pl script.
Runs of homozygosity (ROH) are continuous homozygosity fragments and refer to a class of continuous homozygosity phenomena that occur in a class of genomes, manifested by the lack of heterozygosity in a chromosomal region. Many factors affect the production of ROH, such as natural selection, gene inflection and inbreeding and gradually make it a group characteristic of different populations. At present, inbreeding is considered the most important influencing factor for ROH. In the process of biological evolution, ROH will exhibit various distribution patterns on the animal genome; therefore, the number, length, and distribution of ROH on the animal genome can reveal the rich genetic background such as the evolutionary history and inbreeding degree of animal populations. In this study, we used PLINK to detect ROH, and after calculation, files such as ‘.hom’ and ‘.hom.indiv’ were obtained. The ‘.hom’ file contains the specific information of each ROH, and the ‘.hom.indiv’ file contains a summary of ROH information for each individual, including the total length and total number. The resulting NSEG is NROH and KB is SROH. Finally, the SROH-NROH diagram is prepared according to the above two files.
Population differentiation index and genetic polymorphism analysis
The population differentiation index is a statistical test used in population genetics to measure the degree of differentiation among populations. The larger the differentiation index, the greater the difference. This index is suitable for the comparison of diversity between subgroups. The index value ranges from 0 to 1; 0 indicates that the two populations are randomly mated, and the genotypes are completely similar; 1 indicates that the populations are completely isolated and completely dissimilar. In this study, VCFtoolsCitation36 software was used for the sliding window analysis, and the results were visualized. We calculated the nucleotide diversity π (window-size 50 KB, window-step 25 KB) of all sample populations and other 8 populations using Vcftools software.
Selection signal analysis and functional enrichment analysis
Selection signal analysis is a common analytical method in the field of population evolution research. It is mostly used in the analysis of artificial domestication, natural selection, and other mechanisms, which are closely related to the breeding direction of species and domestication adaptation mechanism.Citation37 Calculate log2θπ ratio and Fst values using VCFtools.Citation36 (Window size 50 KB, window step 25 KB). First, the nucleotide polymorphism analysis was conducted using sliding window method. The nucleotide polymorphism ratio of Meiren yak and other yaks was calculated, and the area with significant outlier value (p < 0.01) was considered as the first condition for selecting the region. Further, the group differentiation index of Meiren yak and other yak groups was calculated using sliding window method, and the area with significant outlier value (p < 0.01) was considered as the second condition. The θπ ratio and Fst method were used for selection signal analysis to screen genomic regions.Citation38 This is a very effective method for detecting selective elimination regions, often resulting in strong selection signals.Citation39 The genome-wide variation of Meiren and Pamir yaks was analysed and the results were used for functional enrichment analysis of identified genes. The DAVID library was used to perform the Gene Ontology (GO) and Kyoto Encyclopedia of Genes and Genomes (KEGG) enrichment analyses of candidate genes, and finally, the enrichment analysis map was constructed.Citation40
Results
Sample collection and sequencing results
In this study, 93 blood DNA samples from eight yak breeds were sequenced (the sequencing depth was 10×). Through filtering by mass value, depth, deletion rate, and minimum allele frequency, 7,666,824 high-quality SNP-labelled data were finally obtained. The data were relatively high, indicating that the sequencing data were of good quality, could reflect the genomic information of the corresponding individual, and could be used for further bioinformatic analysis. In addition, the SNP annotation results of eight yak breeds revealed that the distribution of SNP sites in each yak population was similar. They were mainly located in the intergenic region, followed by the intron region, upstream region of the gene, downstream region of the gene and exon region ().
Table 1. Annotation information of all SNPs in 8 yak populations.
Population genomic analysis
Analysis of cluster differentiation, group structure and kinship
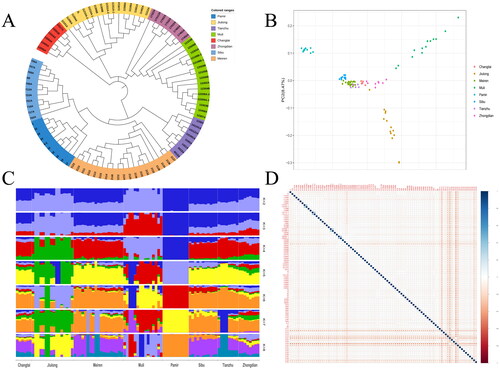
Phylogenetic trees can be used to describe the evolutionary relationships and evolutionary order among populations. To study the relationship and differentiation degree of the whole genome of various breeds of yaks, the phylogenetic tree was constructed. The results revealed that all yak breeds were clustered together individually, and no mixing was observed. Among them, Changtai yaks were clustered into a separate category; Kowloon, Zhongdian, and Muli yaks were grouped together; Sibu yak, Pamir yak and Meiren yak were grouped together, and these three yak groups were grouped together with Tianzhu yak (, Schedule 1). Each locus in the PCA plot represents one sample, and the farther apart the two samples in the figure, the greater the difference in the genetic background of the two samples. The results indicated that a certain degree of differentiation existed among the eight yak breeds. Among them, the Muli, Kowloon and Pamir yaks exhibited a higher degree of differentiation, which was consistent with the characteristic phylogenetic tree map (, Schedule 2). Further, the accurate and appropriate number of subgroups (k-value) was determined. The k-value was assumed to be between 1 and 10, and the cross-validation error for each breed belonging to the kth subgroup was calculated. In the population structure analysis, k = 2 indicated that all yaks were divided into two groups, and Pamir yaks were isolated first. k = 3 indicated that the Kowloon and the Muli yaks are separated. k ≥ 4 indicated that the analysis results of some yak populations are similar (). The results of kinship analysis indicated that individuals without three generations of kinship in the Meiren yak and Pamir yak groups met the requirements of subsequent analysis (, Schedule 3). It suggests that the individual yaks used in this study can be used for subsequent selection signalling analyses in Meiren yaks and Pamir yaks.
Figure 1. Cluster differentiation and affinities of yak populations. (A) Phylogenetic tree. (B) Principal component analysis of yak populations. (C) Ancestral component analysis. (D) Analysis of genetic relationships in yak populations.
Heterozygosity, LD, continuous homozygous regions, genetic polymorphisms and population differentiation index analysis
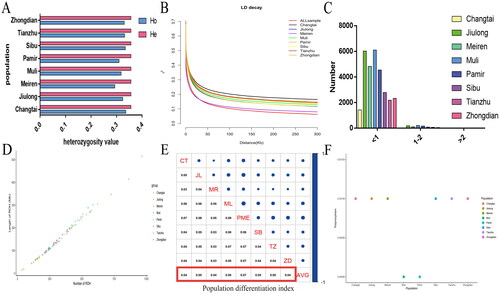
Genetic diversity is fundamental to a population’s adaptation to its environment and evolution. The expected heterozygosity of the eight yak breeds was approximately 0.357; the observed heterozygosity of Meiren yaks was the lowest, and that of Changtai yaks was the highest. The observed heterozygosity value of eight yak groups was less than the theoretical value (, Schedule 4). To evaluate the LD of yak groups, PopLDdecay was used to calculate the pairwise r2 values of each group. LD analysis indicated that Meiren and Changtai yaks had the fastest and slowest LD decay velocity, respectively (). Continuous homozygous regional analysis revealed that the quantity and length of ROH in various yak populations were highly correlated (, Schedule 5). Further, the ROH length was classified into <1 Mb, 1–2 Mb and >2 Mb. Most ROH were of size <1 Mb, followed by 1–2 Mb. The number of ROH with size >2 Mb was 0, 3, 0, 6, 3, 1, 2 and 2, respectively, in Changtai, Jiulong, Meiren, Muli, Pamier, Sibu, Tianzhu and Zhongdian yaks (, Schedule 6). The results of genetic polymorphisms indicated that the nucleotide diversity of Muli and Pamir yaks was low (0.0009), and that of the rest of the yak breeds was 0.001(). Therefore, to quantitatively analyse the genetic differentiation of yak populations, the genetic differentiation index of eight yak breeds was accurately calculated, which was > 0.04. It met the currently recognized genetic differentiation index standard in yak breeds, which considers that groups with a population differentiation index > 0.04 have a higher degree of population genetic differentiation ().
Figure 2. Population genomics analysis. (A) analysis of heterozygosity in yak populations. (B) Linkage disequilibrium analysis. (C,D) ROH analysis of yak populations. (E) Population differentiation index analysis. (F) Genetic polymorphism analysis.
Selection signal analysis and functional enrichment analysis
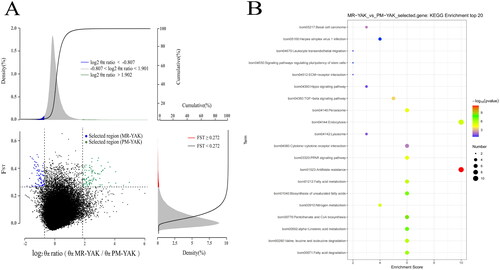
The θπ ratio and Fst method were used for selection signal analysis using defined thresholds (log2 θπ ratio > 1.901, Fst ≥ 0.272) to screen genomic regions. Values above the threshold were considered positive selections and can be used to divide groups with unique characteristics (, Schedule 9). In GO enrichment analysis, these genes were mainly enriched in molecular functions (UDP-N-acetylglucosamine-lysosomal enzyme and N-acetylglucosamine phosphotransferase activity, etc.), followed by biological processes (positive regulation of amacrine cell differentiation, odontogenesis of dentin-containing tooth, regulation of amacrine cell differentiation, etc.)(Schedule 7). Simultaneously two genes (MBP2 and ACVR2B) were screened that were related to multiple physiological processes of animals adapting to hypoxia at high altitude. KEGG enrichment analysis revealed that the genes were associated with biological pathways such as folate resistance, pantothenic acid and CoA biosynthesis, α-linolenic acid metabolism, biosynthesis of unsaturated fatty acids, fatty acid degradation, fatty acid metabolism, and nitrogen metabolism (, Schedule 8).
Figure 3. Enrichment analysis results. (A) Select signal analysis. Based on θπ ratio and Fst analysis to take the intersection for selection signal analysis. The horizontal coordinate is the ratio of θπ (MR/PM) and the vertical coordinate is the Fst value, which corresponds to the frequency distribution plots on the top and on the right, respectively, and the dot plots in the centre represent the corresponding Fst and θπ ratios within different windows. The top blue and green regions are the regions selected by θπ, the red regions are the regions selected by Fst, and the Middle blue and green regions are the intersection of Fst and θπ, i.e., the candidate regions. The blue dots are candidate areas for MR and the green dots are candidate areas for PM yaks. (B) KEGG enrichment analysis of genes in selected regions(the area of green dots in ).
Discussion
Yak is a very important germplasm resource in the plateau. Compared with other cattle breeds, yak attains sexual maturity late in life and has low fertility.Citation41 It has a strong adaptability to cold and hypoxic environment; therefore, it is all-year-round livestock providing meat for local herders.Citation42 Among them, Meiren yak, as an extremely important genetic resource of livestock in China, has a strong physique and muscles. To better understand the evolution and genetic characteristics of Meiren yak, we performed whole gene resequencing, and the obtained data were compared with those of other yak populations. The genome characteristics of the yak populations and differences between Meiren yak and other yak breeds were studied using population genomic analysis.
The phylogenetic tree revealed that all yak groups were clearly distinguished. Changtai yak was alone clustered into one group and had the farthest distance. The results of PCA were consistent with those of phylogenetic tree, where Meiren and Tianzhu yaks were closer. This was consistent with the real-life presence of both yak breeds in Gansu Province. The optimal number of subgroups was not observed because of frequent hybridization between yak groups. Heterozygosity analysis revealed that all yak populations exhibited rich genetic diversity, and the observed heterozygosity values were less than the theoretical values. This indicated that various degrees of decline in heterozygosity were observed in yak populations. LD is affected by the inbreeding level of livestock. The higher the degree of LD, the higher the level of inbreeding.Citation43,Citation44 Meiren yaks had the fastest LD decay velocity, indicating that the inbreeding level and degree of LD were low in Meiren yaks. This is consistent with the feeding mode and local breeding mode of Meiren yaks living in the Meiren grassland for a long time. Meiren yaks have a lower degree of domestication and a large LD decay distance. Strong artificial selection in livestock causes an increase in homozygosity in a particular region.Citation45 Analysis of ROH in eight yak breeds indicated that compared with the other seven yak breeds, the ROH of Meiren yaks were shorter and less in number. This indicated that the possibility of inbreeding in Meiren yaks was small, and no high-intensity inbreeding selection was observed. This is consistent with the results obtained from the analysis of LD in this study. The population differentiation index revealed that the average genetic differentiation index of the eight yak breeds was > 0.04. This was consistent with the results of the genomic feature map in the previous analysis. The average genetic differentiation index of Meiren yaks was 0.05; therefore, it could be used as a yak population genetic resource.
Animal groups living in various regions have experienced natural selection, artificial domestication, and migration. Because of these processes, some species have become extinct; some species have differentiated into different subgroups or subspecies, and even some new species have formed. Selection signal analysis can provide us insights into the traces that organisms have left on their genomes during evolution.Citation46,Citation47 Therefore, the detection of selection signals can help to mine genes associated with economic traits of animals, understand the underlying genetic basis, and resolve the mechanisms of interpopulation differences.Citation48,Citation49 GO analysis of the annotated genes in the screened genomic region in yaks revealed that they were mainly enriched in the functions such as N-acetylglucosamine phosphotransferase activity and regulation of amacrine cell differentiation. KEGG enrichment analysis revealed that the annotated genes were mainly involved in biological processes such as pantothenic acid and CoA biosynthesis, α-linolenic acid metabolism, PPAR signaling pathway, and cytokine–cytokine receptor interaction. ACCA1, as the key enzyme of fatty acid β-oxidation in peroxisome, plays an important role in regulating fatty acid metabolism.Citation50 Wang et al.Citation51 in their study on sheep precursor adipocyte differentiation reported that ACAA1 deficiency promoted sheep precursor adipocyte differentiation while upregulating the expression of lipogenic marker genes; when ACAA1 was overexpressed, it repressed the expression of these markers. This suggested that ACAA1 affects lipid metabolism in sheep by regulating lipogenic marker genes. Similarly, some studies suggested that ACCA1 plays an important role in regulating lipid metabolism.Citation52,Citation53
In this study, we found some regulatory genes (BMP2 and ACVR2B) that may be related to the adaptation of yaks to the low-oxygen environment on the plateau. Animals living at high altitudes, such as yaks and Tibetan antelopes, have evolved various adaptation methods to adapt to low-oxygen environments. These adaptations include increased production of red blood cells and blood vessels and alteration in functions such as deposition of muscle fat. Bone morphogenetic protein 2 (BMP2) is involved in bone growth and development. Studies have reported that it plays a role in regulating erythropoiesis and angiogenesis,Citation54–58 which are adaptive changes in terms of the body’s response to hypoxic environment. In response to hypoxia, animals increase the production of erythropoietin (EPO), a hormone that stimulates red blood cell production. BMP2 and EPO have been reported to act together to promote the differentiation of erythroid progenitors into mature erythrocytes.Citation59 Hypoxia-inducible factor 1 alpha (HIF-1α) is a transcription factor that is activated in the hypoxia reaction, which in turn stimulates the production of vascular endothelial growth factor (VEGF) to promote the production of blood vessels. BMP2 can interact with HIF-1α to promote the expression of VEGF. This promotes vascular formation.Citation60 Moreover, BMP signalling is thought to play a key role in the heart and nerves.Citation61 ACVR2B, also known as activator receptor 2B, is a protein-coding gene that plays an important role in cell differentiation, growth, and apoptosis. ACVR2B can reduce cardiomyocyte death and reduce cardiac damage by adjusting cardiomyocyte metabolism in response to hypoxic environments.Citation62 Furthermore, activation of ACVR2B can promote stem cell differentiation to repair damaged cells. These regulations may be the adaptations of Himalayan marmots to extreme environments.Citation63 These studies indicated that research is still limited on the genes regulating animals’ adaptability to the plateau habitat and hypoxic environment. Further research is needed to fully understand the molecular mechanism underlying the adaptation of animals to high altitude.
Conclusion
In summary, we analysed eight yak breeds through whole genome resequencing combined with population genetics to understand the evolution and domestication of these yaks. The results revealed that Meiren yaks have formed unique genetic characteristics in the long-term evolution process and is a potential yak genetic resource. Several genes that may be associated with adaptability to high altitude were obtained in Meiren yaks. This study enhanced our understanding of yak populations in the plateau and provided an important reference for the conservation of genetic resource of Meiren yaks.
Authors’ contributions
Conceptualization, T.W., X.M. and P.Y.; methodology, T.W.; software, T.W. and X.M.; formal analysis, T.W.; investigation, T.W.; resources, X.M., C.M. and C.L.; data curation, C.M., C.L. and X.W.; writing – original draft preparation, T.W.; writing – review and editing, C.M., C.L. and X.W.; visualization, P.Y.; supervision, P.Y.; project administration, P.Y.; funding acquisition, P.Y. All authors contributed to the article and approved the submitted version.
Institutional review board statement
All animal studies conducted in this study were approved by the Animal Administration and Ethics Committee of Lanzhou Institute of Husbandry and Pharmaceutical Sciences, Chinese Academy of Agricultural Sciences (SYXK-2014–0002).
Supplemental Material
Download MS Excel (35.5 KB)Supplemental Material
Download MS Excel (8.8 KB)Supplemental Material
Download MS Excel (1.1 KB)Supplemental Material
Download MS Excel (1.3 KB)Supplemental Material
Download MS Excel (2.8 MB)Supplemental Material
Download MS Excel (19.5 KB)Supplemental Material
Download MS Excel (67.2 KB)Supplemental Material
Download MS Excel (4 KB)Supplemental Material
Download MS Excel (75.6 KB)Acknowledgements
The authors would like to thank the Key Laboratory of Yak Breeding Engineering in Gansu Province for providing the experimental conditions and the teachers and brothers for their help.
Disclosure statement
The authors declare no conflict of interest.
Data availability statement
The datasets generated during the current study are available in the [FigShare] repository, [10.6084/m9.figshare.23723817].
Additional information
Funding
References
- Qi X, Zhang Q, He Y, et al. The transcriptomic landscape of yaks reveals molecular pathways for high altitude adaptation. Genome Biol Evol. 2019:11(1):72–85.
- Bao Q, Zhang X, Bao P, et al. Using weighted gene co-expression network analysis (WGCNA) to identify the hub genes related to hypoxic adaptation in yak (Bos grunniens). Genes Genom. 2021;43(10):1231–1246.
- Ma SL, Li XW, Li X, et al. Assessment of genetic structure of 3 Maiwa yak preserved populations based ongenotyping-by-sequencing technology. Acta Pratacult Sin. 2022;31(09):183–194.
- Wang H, Chai Z, Hu D, et al. A global analysis of CNVs in diverse yak populations using whole-genome resequencing. BMC Genom. 2019;20(1):61.
- Jie Z, Zhen ZX, Ai LC, et al. Identification of meat from yak and cattle using SNP markers with integrated allele-specific polymerase chain reaction-capillary electrophoresis method. Meat Sci. 2019;148:120–126.
- Yan XJ, Lei YH, Xie P, et al. Recent progress in processing technologies for yak jerky meat. Meat Research/Roulei Yanjiu. 2019;33(3):67–71.
- Wang K, Hu QJ, Ma H, et al. Genome-wide variation within and between wild and domestic yak. Mol Ecol Resour. 2014;14(4):794–801.
- Radzik-Rant A, Wojtunik K, Gutowski A. Characteristics and distribution of yak in the world. Wiadomości Zootech. 2014;52(2):130–141.
- Wu J. The distributions of Chinese yak breeds in response to climate change over the past 50 years. Anim Sci J. 2016;87(7):947–958.
- Das PP, Krishnan G, Doley J, et al. Establishing gene Amelogenin as sex-specific marker in yak by genomic approach. J Genet. 2019;98:7–12.
- Wang XD, Pei J, Bao PJ, et al. Mitogenomic diversity and phylogeny analysis of yak (Bos grunniens). BMC Genomics. 2021;22(1):325.
- Lan DL, Ji WH, Xiong XR, et al. Population genome of the newly discovered Jinchuan yak to understand its adaptive evolution in extreme environments and generation mechanism of the multirib trait. Integr Zool. 2020;16(5):685–695.
- Tang YQ. Development of highland special ecological yak problems and countermeasures. China Livest Poult Seed Ind. 2020;16(11):30.
- Wang Q, Li D, Guo A, et al. Whole-genome resequencing of Dulong Chicken reveal signatures of selection. Br Poult Sci. 2020;61(6):624–631.
- Chen QM, Huang YF, Wang ZH, et al. Whole-genome resequencing reveals diversity and selective signals in Longlin goat. Gene. 2021;771:145371–145385.
- Gulcher J, Stefansson K. Population genomics: laying the groundwork for genetic disease modeling and targeting. Clin Chem Lab Med. 1998;36(8):523–527.
- Ellegren H. Genome sequencing and population genomics in non-model organisms. Trends Ecol Evol. 2014;29(1):51–63.
- Begun DJ, Holloway AK, Stevens K, et al. Population genomics: whole-genome analysis of polymorphism and divergence in Drosophila simulans. PLoS Biol. 2007;5(11):e310.
- Xu XY, Bai GH. Whole-genome resequencing: changing the paradigms of SNP detection molecular mapping and gene discovery. Mol Breed. 2015;35(1):11.
- Liu YC, Sun X, Driscoll C, et al. Genome-wide evolutionary analysis of natural history and adaptation in the world’s tigers. Curr Biol. 2018;28(23):3840–3849.e6.
- Kim J, Hanotte O, Mwai OA, et al. The genome landscape of indigenous African cattle. Genome Biol. 2017;18(1):34.
- Wu DD, Ding XD, Wang S, et al. Pervasive introgression facilitated domestication and adaptation in the Bos species complex. Nat Ecol Evol. 2018;2(7):1139–1145.
- Guo JZ, Tao HX, Li PF, et al. Whole-genome sequencing reveals selection signatures associated with important traits in six goat breeds. Sci Rep. 2018;8(1):10405–10415.
- Chen NB, Cai YD, Chen QM, et al. Whole-genome resequencing reveals world-wide ancestry and adaptive introgression events of domesticated cattle in East Asia. Nat Commun. 2018;9(1):1–13.
- Fan HH, Wang TJ, Li Y, et al. Development and validation of a 1 K sika deer (Cervus nippon) SNP Chip. BMC Genom Data. 2021;22(1):35.
- Li XK, Su R, Wan WT, et al. Identification of selection signals by large-scale whole-genome resequencing of cashmere goats. Sci Rep. 2017;7(1):15142.
- Li QF, Zhao XB, Liu HL, Li N, Xie Z. A review of the research on taxonomic status in yak (Poephagus). Acta Zootaxonom Sin. 2006;31(3):520–524.
- Xu SY, Zhao LL, Xiao SJ, Gao TX. Whole genome resequencing data for three rockfish species of Sebastes. Sci Data. 2019;6(1):97.
- Bolger AM, Lohse M, Usadel B. Trimmomatic: a flexible trimmer for Illumina sequence data. Bioinformatics 2014;30(15):2114–2120.
- Mckenna A, Hanna M, Banks E, et al. The genome analysis toolkit: a MapReduce framework for analyzing next-generation DNA sequencing data. Genome Res. 2010;20(9):1297–1303.
- Purcell S, Neale B, Todd-Brown K, et al. PLINK: A tool set for whole-genome association and population-based linkage analyses. Am J Hum Genet. 2007;81(3):559–575.
- Kalyaanamoorthy S, Minh BQ, Wong TKF, von Haeseler A, Jermiin LS. ModelFinder: fast model selection for accurate phylogenetic estimates. Nat Methods. 2017;14(6):587–589.
- Manichaikul A, Mychaleckyj JC, Rich SS, Daly K, Sale M, Chen WM. Robust relationship inference in genome-wide association studies. Bioinformatics 2010;26(22):2867–2873.
- Haubold B, Pfaffelhuber P, Lynch M. mlRho–a program for estimating the population mutation and recombination rates from shotgun‐sequenced diploid genomes. Mol Ecol. 2010;19(1):277–284.
- Zhang C, Dong SS, Xu JY, He WM, Yang TL. PopLDdecay: A fast and effective tool for linkage disequilibrium decay analysis based on variant call format files. Bioinformatics 2019;35(10):1786–1788.
- Danecek P, Auton A, Abecasis G, et al. The variant call format and VCFtools. Bioinformatics 2011;27(15):2156–2158.
- Shi HB, Li TT, Su MC, et al. Whole genome sequencing revealed genetic diversity, population structure, and selective signature of Panou Tibetan sheep. BMC Genom. 2023;24(1):50.
- Chen H, Patterson N, Reich D. Population differentiation as a test for selective sweeps. Genome Res. 2010;20(3):393–402.
- Kang YD, Guo SK, Wang XD, et al. Whole-genome resequencing highlights the unique characteristics of Kecai Yaks. Animals (Basel). 2022;12(19):2682–2692.
- Chen B, Hua ZY, Qin XN, Li ZJ. Integrated microarray to identify the Hub miRNAs and constructed miRNA–mRNA network in neuroblastoma via bioinformatics analysis. Neurochem Res. 2021;46(2):197–212.
- Qiu Q, Zhang GJ, Ma T, et al. The yak genome and adaptation to life at high altitude. Nat Genet. 2012;44(8):946–949.
- Liu Y, Yan CY, Matthew C, Wood B, Hou FJ. Key sources and seasonal dynamics of greenhouse gas fluxes from yak grazing systems on the Qinghai-Tibetan Plateau. Sci Rep. 2017;7(1):40857–40867.
- Wang MS, Li Y, Peng MS, et al. Genomic analyses reveal potential independent adaptation to high altitude in Tibetan chickens. Mol Biol Evol. 2015;32(7):1880–1889.
- Wang GD, Zhai WW, Yang HC, et al. Out of southern East Asia: the natural history of domestic dogs across the world. Cell Res. 2016;26(1):21–33.
- Leocard S. Selective sweep and the size of the hitchhiking set. Adv Appl Probab. 2009;41(3):731–764.
- Zhou T, Wang N, Wang Y, et al. Nucleotide evolution, domestication selection, and genetic relationships of chloroplast genomes in the economically important crop genus gossypium. Front Plant Sci. 2022;13:873788–873803.
- Xiang H, Li X, Dai FY, et al. Comparative methylomics between domesticated and wild silkworms implies possible epigenetic influences on silkworm domestication. BMC Genom. 2013;14(1):646.
- Friedrich J, Talenti A, Arvelius P, Strandberg E, Haskell MJ, Wiener P. Unravelling selection signatures in a single dog breed suggests recent selection for morphological and behavioral traits. Adv Genet (Hoboken). 2020;1(1):e10024.
- Rezvannejad E, Asadollahpour NH, Esmailizadeh A. Detection of candidate genes affecting milk production traits in sheep using whole-genome sequencing analysis. Vet Med Sci. 2022;8(3):1197–1204.
- Wanders RJA, Vreken P, Ferdinandusse S, et al. Peroxisomal fatty acid α-and β-oxidation in humans: enzymology, peroxisomal metabolite transporters and peroxisomal diseases. Biochem Soc Trans. 2001;29(2):250–267.
- Wang YL, Li X, Cao Y, et al. Effect of the ACAA1 gene on preadipocyte differentiation in sheep. Front Genet. 2021;12:649140–649149.
- Lisowski P, Kościuczuk EM, Gościk J, Pierzchała M, Rowińska B, Zwierzchowski L. Hepatic transcriptome profiling identifies differences in expression of genes associated with changes in metabolism and postnatal growth between Hereford and Holstein‐Friesian bulls. Anim Genet. 2014;45(2):288–292.
- Li GX, Fu SY, Chen Y, et al. MicroRNA-15a regulates the differentiation of intramuscular preadipocytes by targeting ACAA1, ACOX1 and SCP2 in chickens. Int J Mol Sci. 2019;20(16):4063–4075.
- Wiley DM, Jin SW. Bone Morphogenetic Protein functions as a context-dependent angiogenic cue in vertebrates. Semin Cell Dev Biol. 2011;22(9):1012–1018.
- Maguer-Satta V, Rimokh R. FLRG, member of the follistatin family, a new player in hematopoiesis. Mol Cell Endocrinol. 2004;225(1–2):109–118.
- Nemeth E. Iron regulation and erythropoiesis. Curr Opin Hematol. 2008;15(3):169–175.
- Yang M, Guo MY, Hu YH, Jiang Y. Scube regulates synovial angiogenesis-related signaling. Med Hypotheses. 2013;81(5):948–953.
- Ding A, Li CH, Yu CY, Zhou HT, Zhang ZH. Long non-coding RNA MALAT1 enhances angiogenesis during bone regeneration by regulating the miR-494/SP1 axis. Lab Invest. 2021;101(11):1458–1466.
- Detmer K, Walker AN. Bone morphogenetic proteins act synergistically with haematopoietic cytokines in the differentiation of haematopoietic progenitors. Cytokine. 2002;17(1):36–42.
- Chen DF, Tian W, Li Y, Tang WJ, Zhang C. Osteoblast-specific transcription factor Osterix (Osx) and HIF-1α cooperatively regulate gene expression of vascular endothelial growth factor (VEGF). Biochem Biophys Res Commun. 2012;424(1):176–181.
- Chen DI, Zhao M, Mundy GR. Bone morphogenetic proteins. Growth Fact. 2004;22(4):233–241.
- Magga J, Vainio L, Kilpiö T, et al. Systemic blockade of ACVR2B ligands protects myocardium from acute ischemia-reperfusion injury. Mol Ther. 2019;27(3):600–610.
- Bai L, Liu BN, Ji CM, et al. Hypoxic and cold adaptation insights from the Himalayan marmot genome. Iscience 201911:519–530.