
Abstract
Despite the significant threat of heat stress to livestock animals, only a few studies have considered the potential relationship between broiler chickens and their microbiota. Therefore, this study examined microbial modifications, transcriptional changes and host–microbiome interactions using a predicted metabolome data-based approach to understand the impact of heat stress on poultry. After the analysis, the host functional enrichment analysis revealed that pathways related to lipid and protein metabolism were elevated under heat stress conditions. In contrast, pathways related to the cell cycle were suppressed under normal environmental temperatures. In line with the transcriptome analysis, the microbial analysis results indicate that taxonomic changes affect lipid degradation. Heat stress engendered statistically significant difference in the abundance of 11 microorganisms, including Bacteroides and Peptostreptococcacea. Together, integrative approach analysis suggests that microbiota-induced metabolites affect host fatty acid peroxidation metabolism, which is correlated with the gene families of Acyl-CoA dehydrogenase long chain (ACADL), Acyl-CoA Oxidase (ACOX) and Acetyl-CoA Acyltransferase (ACAA). This integrated approach provides novel insights into heat stress problems and identifies potential biomarkers associated with heat stress.
Introduction
Elevated environmental temperatures severely affect livestock,Citation1,Citation2 with poultry being extensively susceptible to ambient conditions.Citation3 Heat stress is the foremost lethal stressor in chickens, attenuating feed intake, growth rates, meat productivity and quality.Citation4–6 Previous studies have evidenced that heightened environmental conditions amplify reactive oxygen production and inflammation reactions,Citation7,Citation8 prompting intestinal impairments and epithelial barrier dysfunction.Citation6,Citation9 Vital functions in chicken intestines afflicted by heat stress include nutrient digestion, absorption and pathogen protection.Citation10,Citation11 Specifically, the immune and microbial barrier in the jejunum, the central section of the small intestine, plays a crucial role in maintaining gut health in broiler chickens.Citation12 Thus, additional molecular and cellular mechanistic investigations centred on jejunal transcriptome profiling will provide further insight into gene expression changes, complex genomic heat stress responses and genetic heat tolerance regulation in chickens.Citation13,Citation14 Furthermore, alterations in gut microorganisms as a result of heat stress have recently garnered attention as a significant factor in explaining heat stress.Citation15,Citation16 It has been confirmed that heat stress leads to a significant change in the intestinal environment, causing an imbalance in intestinal microorganisms resulting in phenotypic changes in the host.Citation17,Citation18 Previous studies have attempted to determine the effects of heat stress on jejunal tissue and microbiota using a single-omic approach; however, this method cannot establish molecular change and gene expression relationships in specific circumstances.Citation19,Citation20
The biological system of animals comprises complex regulatory features and is sensitive to environmental factors that influence host phenotypes and gut function.Citation21 In addition to regulatory heat stress responses, the microbiome can fluctuate host gene and metabolite expressions. Thus, each component and its interactions must be investigated to understand heat stress mechanisms.Citation22,Citation23 In recent observations, the microbiome directly affected stress-associated hormones and mediators in bacterial pathogens.Citation24 Although previous research has elucidated the significance of microbiome through chicken microbiome analyses, few have compared functional changes predicated on heat stress.
Microbiome and transcriptome integration approaches enable comprehensive insights into heat stress mechanisms by predicting microbiota-derived metabolites, unveiling how the microbiome mitigates or enhances heat stress conditions.Citation25,Citation26 These approaches are expected to present continuous and direct microfloral strategies for managing continuously rising environmental temperatures and various heat stress concerns. This study employs integrative approaches to analyse transcriptional and microbial changes in the broiler intestine in response to heat stress. Thus, we focused on gaining a comprehensive understanding of heat stress responses and identifying potential microbiota and genes for reducing economic losses by mitigating phenotypic changes.
Materials and methods
Experimental animals and sample collection
The Institutional Animal Care and Use Committee (IACUC; No. 2020-00022) approved this study. We utilized animal samples described by Kim et al. for broilers in our study.Citation27 A total of 170 male broiler chicks from the Ross 308 strain were acquired at 1 day of age from a local hatchery (Dongsan broiler hatchery, situated in Cheonan-si, Korea.) Before the commencement of the experiment, all these chicks were provided with a commercial diet to meet their energy and nutritional requirements. When the broiler chickens reached 21 days of age, their weights were recorded, and 50 chickens with significantly high or low body weights were excluded from the study, leaving us with 120 broiler chickens. These remaining broilers had an average body weight of 866 ± 61.9 g. Subsequently, the broilers were divided into two treatment groups, each further allocated to six separate cages. This allocation was carried out using a completely randomized design.
The thermoneutral group of broilers was reared in a controlled environment with a temperature of 20 °C and a relative humidity of 57% throughout the entire experimental period. In contrast, heat-stressed group of broilers was subjected to a cyclic heat stress circumstance, experiencing temperatures ranging from 31 to 32 °C for 8 h a day and 27 to 28 °C for the rest of the time. Both groups of Broilers were provided with a basal diet which was carefully formulated to meet or surpass the nutritional requirements specified in the Ross 308 manualCitation28 and 23-h lighting program was used in the experiment. We selected the three broilers that have growth performance close to average in each group for bioinformatic analysis. The animals were euthanized on Day 42; jejunal mucosa and contents were collected for mRNA and 16S rRNA extractions. A sterile slide scraped jejunal mucosa from the inner intestinal tissue. All samples were collected in sterilized tubes, frozen using liquid nitrogen and stored at −80 °C.
RNA extraction, library preparation and sequencing
A 1 ml TRIzol reagent (Invitrogen, Carlsbad, CA, USA) extracted 50 mg of six jejunal sample’s total RNA, which the NanoDrop (Thermo Scientific, Waltham, MA, USA) assessed for quality. The samples that are RNA integrity number (RIN) over the 7 were used in further analysis. A cDNA library was independently generated for each sample using the Illumina TruSeq Stranded mRNA Sample Prep Kit (Illumina, Inc., San Diego, CA, USA) and 1 µg of total RNA. The initial step involved eliminating rRNA from the total RNA using the Ribo-Zero rRNA Removal Kit (Human/Mouse/Rat; Illumina, Inc.). Following this, the remaining mRNA underwent fragmentation into small pieces through exposure to divalent cations at elevated temperatures. The resulting cleaved RNA fragments were then reverse-transcribed into first-strand cDNA using SuperScript II reverse transcriptase (Invitrogen, Life Technologies) and random primers. Subsequently, second-strand cDNA synthesis was performed using DNA Polymerase I, RNase H and dUTPs. The cDNA fragments underwent an end-repair process, including the addition of a single ‘A’ base, followed by the ligation of adapters. The resulting products were purified and enriched through PCR to yield the final cDNA library. Quantification of the libraries was carried out using KAPA Library Quantification kits for Illumina Sequencing platforms, following the qPCR Quantification Protocol Guide (Roche, Basel, Switzerland). Validation of the libraries was conducted using the TapeStation D1000 ScreenTape System (Agilent Technologies, Santa Clara, CA, USA). Messenger RNA sequencing was achieved using an Illumina HiSeq 4000 (Illumina Inc., San Diego, CA, USA) sequencer with paired-end, 100 base-pair reads.
Differentially expressed gene profiling
Raw read data quality was assessed using FastQC,Citation29 and low-quality adapter sequences and reads were removed using Trimmomatic v.0.39 to separate clean reads for further analysis.Citation30 The Gallus_gallus (GRCg6a, GCA_000002315.5) reference genome in the FASTA format was obtained from Ensemble (http://www.ensembl.org/). Clean, paired-end reads were mapped against an indexed reference genome using HISAT2,Citation31 a sensitive and swift alignment program for next-generation sequencing reads. Raw counts corresponding to each library’s genes were calculated based on exons; the Gallus_gallus v101 GTF file was implemented as the genomic annotation reference file using FeatureCounts’ R package ‘Subread’ function.Citation32
Raw counts were normalized through the trimmed means of M values (TMM) method in the ‘edgeR’ package,Citation33 followed by DEG profiling from normalized read count comparisons between the heat-stressed and thermoneutral groups. The false discovery rate (FDR) was calculated using the Benjamini–Hochberg procedure. Significant DEGs were extracted by applying FDR < 0.05 and absolute log2 fold change (FC) ≥ 1 thresholds; overall gene expressions were visualized using the ‘ggplotR’ package.
Functional enrichment analyses
The Database for Annotation, Visualization and Integrated Discovery (DAVID) bioinformatics resources 6.8 were employed to examine the Kyoto Encyclopedia of Genes and Genomes (KEGG) and gene ontology (GO) databases for functional enrichment analyses of DEGs; KEGG and GO significance in each stage were detected at p < 0.1, and results were visualized by using − log10 p and log2 fold enrichment as criteria. GO enrichment analysis assessed biological process, cellular component and molecular function. REVIGO visualized these enriched GO terms as treemaps.Citation34
Expression data for the gene set enrichment analysis (GSEA) were collated using TMM-normalized count data; all gene expression differences were ranked to ascertain patterns between groups. The GO database processed the gene set data, parameters were set at their default values, and gene sets were ranked by calculating normalized enrichment scores (NESs). Cytoscape (v.3.7.2) visualized the results as a functional enrichment map.Citation35 The cut-off value was FDR < 0.01; the similarity cut-off was a >0.8 overlap coefficient.
Microbial DNA extraction, library construction and sequencing
Sequencing libraries were prepared following Illumina 16S Metagenomic Sequencing Library protocols to amplify the V3 and V4 regions using 3 ml of jejunal contents in each 6 samples. The input gDNA 2 ng was PCR-amplified with a 5× reaction buffer, 1 mM of dNTP mix and 500 nM of the universal F/R PCR primer and Herculase II fusion DNA polymerase (Agilent Technologies, Santa Clara, CA). Initial PCR cycle conditions were 3 min at 95 °C for heat activation and 25 cycles of 30 s at 95 °C, 30 s at 55 °C and 30 s at 72 °C, followed by a final 5-min extension at 72 °C. The universal primer pair with Illumina adapter overhang sequences for the first amplification was as follows: V3-F: 5′-TCGTCGGCAGCGTCAGATGTGTATAAGAGACAGCCTACGGGNGGCWGCAG-3′, V4-R: 5′- GTCTCGTGGGCTCGGAGATGTGTATAAGAGACAGGACTACHVGGGTATCTAATCC-3′. The first PCR product was purified with AMPure beads (Agencourt Bioscience, Beverly, MA), and then 2 μl was PCR-amplified using the Nextera XT kit (Illumina, San Diego, CA) for final library construction. The second PCR cycle conditions matched the first, except for 10 cycles. The PCR product was purified with AMPure beads, quantified using qPCR adhering to the qPCR Quantification Protocol Guide (KAPA Library Quantification kits for Illumina Sequencing platforms) and qualified using the TapeStation D1000 ScreenTape (Agilent Technologies, Waldbronn, Germany). Paired-end (2 × 300bp) sequencing was achieved by the MiSeq™ platform (Illumina, San Diego, USA).
Microbiome dataset processing and diversity analysis
Cutadapt v3.7 trimmed trivial 16S rRNA sequence adaptors for further study, and QIIME2 v2020.03 processed all 16S rRNA gene sequences. Concerning the microbiome dataset, noisy and amplicon sequence errors were filtered (minimum length ≥ 5, quality score ≥ 25) while the DADA2 algorithm generated amplicon sequence variants (ASVs). A Naïve Bayes classifier (SILVA 132) trained for 16S rRNA V3–V4 hypervariable region using the q2-feature-classifier plugin assigned representative sequences taxonomy. ASVs, resulted from DADA2, were classified against the trained SILVA v132 reference database. Identified taxa underwent differential abundance analysis with a linear discriminant analysis effect size (LEfSe) of >2.0 LDA.
The Qiime2 core-metrics-phylogenetic and alpha-group-significance script estimated richness (observed ASVs) and Shannon Diversity Indices for the alpha-diversity analysis.Citation36 Similarly, beta diversity was assessed via non-metric multidimensional scaling ordination from ASV Bray–Curtis dissimilarity in the Qiime2 core-metrics-phylogenetic and alpha-group-significance script.
Microbiota functional annotation
Phylogenetic Investigation of Communities by Reconstruction of Unobserved States (PICRUSt2) predicted the functional gut microbiome from 16S rRNA genes in the Silva database gene sequences’ phylogenetic tree. Representative sequence data was input for metagenome prediction rarefied, and the ASV table used each sample’s 16S rRNA gene count for normalization. To improve accuracy of gene prediction and reduce the fluctuations in microbiota, there is copy number normalization process after gene content prediction by PICRUSt2. Composition profiles were annotated into the KEGG pathway database. Each pathway’s significance was calculated through t-tests and identified as significant at a p value <0.05. STAMP v2.1.3 visualized identified pathways.Citation37
Host–microbiota interaction analysis
The PICRUSt2 database used KEGG Orthology (KO) as a query to identify microorganisms associated with the selected significant pathways. We compiled a presence/absence list of compounds contributing to these significant pathways from the KEGG pathway database and excluded metabolites without InChIKey from further analysis. Hostmetabolic contribution was determined using the STITCHv5.0 database.Citation38 STITCH offers a valuable resource for searching through established as well as potential interactions between chemicals and proteins.Citation38 This is made possible through the integration of information from diverse sources, such as metabolic pathways, crystal structures, binding experiments and drug-target relationships.Citation38 Interactions with high confidence scores (>0.9) and known functional effects were identified, and a PPI network analysis for each predicted metabolite set was conducted.
Overlapped transcriptome and integration analysis pathways were further analysed as described by MacMillan et al.Citation39 Contributing taxa and host transcriptome genes were selected and examined through Pathview to distinguish potent gene and protein modulations.Citation40 Analysis with the Spearman correlation for overlapped pathways was performed on host genes and taxa, including pathway-contributing DEGs and microbiota associated with more than four KOs in the pathway and present in more than half of all samples.
Results
RNA-seq data and DEG profiling
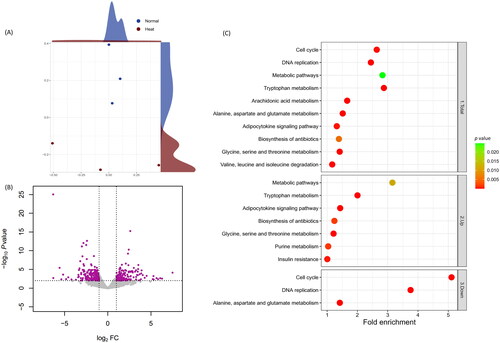
RNA sequencing data processing results revealed that Normal and Heat groups averaged 34,923,354 raw reads and 50.82% GC; trimmed average reads were 34,628,356 and 50.80% GC. Alignment results for the six samples were 70.99% unique aligned reads and 92.87% overall alignment rate (Supplementary table 1). All the samples were deemed suitable to advance to the subsequent stage of the process. Multidimensional scaling (MDS) analysis compared gene expression patterns and identified distinct clusters in both groups (). The DEG profiling analysis identified 429 DEGs, including 220 up-regulated and 209 down-regulated ().
Figure 1. RNA-seq transcriptional profiling in the chicken cecum and functional DEG analysis. (A) MDS; each point represents an individual sample. Yellow and purple dots indicate control (Normal) and treatment (Heat) groups. (B) DEGs volcano plot overview. log2 FCs in Heat-to-Normal gene expression ratios and –log10 p are indicated on the x and y axes, respectively. Purple dots denote significantly 220 up- and 209 down-regulated DEGs (FDR < 0.05, absolute log2 FC ≥ 1). Grey dots indicate non-significant DEGs, horizontal lines mark the significance threshold (FDR < 0.05), and vertical lines establish the two FC thresholds (absolute log2 FC ≥ 1). KEGG pathways of the DEGs x-axis displays fold enrichment values; red coloured dots indicate low p. Each plot includes 1. Total, 2. Up-regulated and 3. Down-regulated DEGs.
Functional annotations
GO and KEGG enrichment analyses identified ambient temperature-induced functional changes (Supplementary tables 2 and 3). A treemap with a − log10 p value box size visualized GO enrichment analysis results (Supplementary figure 1), substantiating that ‘Positive regulation of cell migration’ was a paramount GO term in the Heat group and ‘Cell division’ was predominant in the Normal group. The KEGG database determined significant pathways () corroborating GO results. Protein and lipid metabolite-related terms, such as ‘Tryptophan Metabolism’, ‘Metabolic Pathways’ and ‘Adipocytokine Signaling Pathway’, were prevalent in the Heat group by indicating the lowest p value, contrasting ‘Cell Cycle’ and ‘DNA Replication Pathways’ in the Normal group shown as the lowest p value (Supplementary figure 3).
GSEA
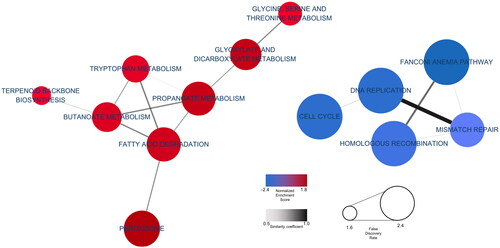
To assess which functional changes are affected by heat stress, we calculated enrichment score (ES) of each group an ES was adjusted for multiple hypothesis testing to confirm GSEA results which considering cumulative gene changes (Supplementary table 4). GSEA results were visualized as a cluster network based on significant terms by combining representative functions (). Each node’s colour signifies the NES; higher scores were expressed as thicker colours. Similarly, node size indicates the FDR; the size increases as FDR lessens. In addition, edge thickness conveys coefficient degree overlap. The network identified lipid and protein metabolism-related terms, such as ‘Fatty Acid Degradation’, ‘Propanoate Metabolism’, ‘Butanoate Metabolism’ and ‘Tryptophan Metabolism’ as highly clustered NES values by indicating NES > 1.0 and adjusted p value <0.005. Corroborating GO and KEGG database functional analyses, ‘DNA Replication Pathways’ and ‘Cell Cycle’ terms indicated lowly clustered NES values by indicating NES > 1.0 and adjusted p value <0.005. Notably, the functional analysis results derived from DEGs and the results indicating the extent of gene functional involvement, as determined by ranking all of genes, exhibited high similarity between two methods. In addition, ‘Fatty acid degradation’ and ‘Tryptophan Metabolism’ have high similarity coefficient with other pathways in the network ().
Figure 2. KEGG GSEA. Cytoscape visualized functional enrichment analysis results from GSEA. Nodes represent enriched KEGG pathways. Line thickness indicates overlap coefficients (overlap levels between nodes).
Jejunal microbial classification from amplicon sequencing and diversity analysis
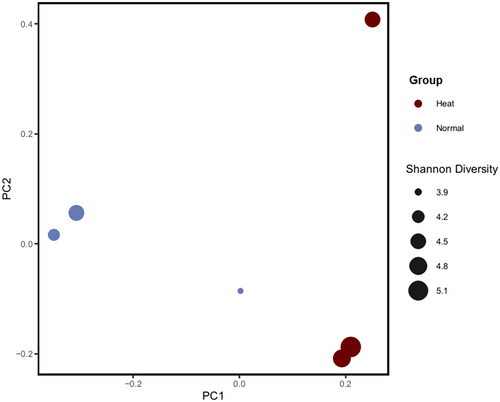
Six jejunal samples (three Normal and three Heat) were 16S rRNA sequenced by MiSeq platform. After the quality check, approximately 9,832 ASV were revealed following denoising and clustering. The Heat group expressed a relatively higher Shannon Index than the Normal group; however, there was no statistically significant difference (Supplementary figure 2). Contrary to previous results, evenness decreased in the Heat group but indicated no statistically significant difference (Supplementary table 1). Beta diversity was calculated through an unweighted UniFrac algorithm that considered species presence, absence and phylogenic branch length. Principal coordinate analysis (PCoA) downscaled beta diversity analysis results, then alpha and beta diversity results were merged and visualized (). PCoA downscaled beta diversity analysis indicates that the cluster of samples by each of the group.
Figure 3. PCoA using weighted UniFrac distance, including Shannon Index information between samples. Blue indicates the Heat group, and red represents the Normal group. Node size denotes the Shannon Index.
Taxonomic classifications under high ambient temperature
Firmicutes were the dominant bacterial phylum in the Heat and Normal groups (Supplementary figure 3); however, a lower relative abundance was observed in the Heat group (90.68%) compared to the Normal group (98.56%; Supplementary table 5 and Supplementary figure 3). Next, Bacteroidetes were the second most abundant phylum in the Heat group (7.06%), notably elevated compared to Normal groups (0.36%; Supplementary table 5 and Supplementary figure 3). Unlike normal ambient temperature conditions, Proteobacteria continuously intensified under heat stress (Supplementary table 5 and Supplementary figure 3). The Heat and Normal group F/B ratio was also considerably curtailed in heat-stressed conditions.
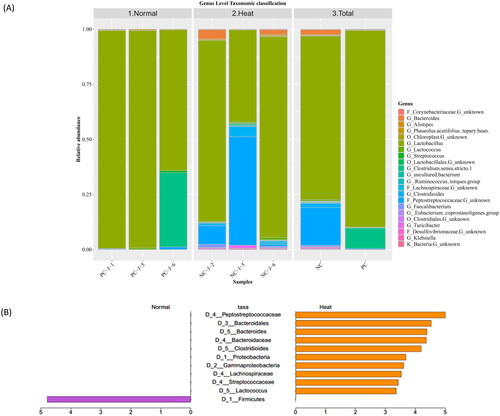
Lactobacillus was the dominant genus-level taxa in Heat (69.85%) and Normal groups (77.07%; ). Heat stress abated Lactobacillus abundance compared to standard ambient temperatures. Clostridium sensu stricto 1 consistently escalated in the Heat group, whereas Lactococcus and Peptostreptococcaceae continually declined.
Figure 4. (A) Taxonomy analysis results. Colours indicate each taxon, and legends indicate taxa with more than 0.05 relative abundance. (B) Linear discriminant analysis effect size (LEfSe) results of differentially abundant taxa with an LDA threshold >2.0.
Differentially abundant taxonomic analysis
Since LEfSe emphasized statistical significance, it was selected to identify specific bacterial taxa enrichment between environmental conditions. At a 2.0 LDA cut-off between groups, the phylogenic dendrogram plots include 11 differentially abundant microorganisms (). Consistent with taxonomic changes in classification results, Peptostreptococcaceae, Bacteroides, Clostridioides and Lactococcus were more prevalent in the Heat group than in the Normal group (Supplementary figure 4). Comparatively, Firmicutes were notably depleted in heat stress conditions (Supplementary figure 4).
Functional microbial data analysis
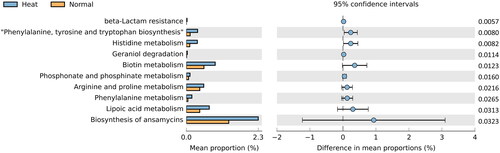
A PICRUSt2 microbiome data analysis examined jejunum microorganisms in heat-stress conditions. Eleven statistically significant KEGG pathways were identified based on a p value <0.05 cut-off calculated by t-test ( and Supplementary table 6). Notably, lipid and protein metabolism-related pathways were identified as ‘Lipoic Acid Metabolism’, ‘Arginine and Proline Metabolism’, ‘Phenylalanine, Tyrosine’ and ‘Tryptophan Biosynthesis’ in Heat stress group. In addition, pathways that overlapped with transcriptome functional annotation analysis results included ‘Lipoic Acid Metabolism’, ‘Phenylalanine, Tyrosine and Tryptophan Biosynthesis’ and ‘Histidine Metabolism’ in Heat stress group. Due to these pathways were identified microbial functional changes in heat stress condition, these pathways were further analysed to identify microbiome–host interaction.
Figure 5. Microbial functional analysis in jejunal contents. KEGG established taxa pathways. Statistically significant pathways (p < 0.05) were presented by bar plot using STAMP. Orange represents the Normal group’s significant pathways; blue denotes the Heat group’s. Difference in mean proportions indicates the predicted difference in contributions for each pathway between the values.
Microbiome-metabolite-transcriptome integration analysis
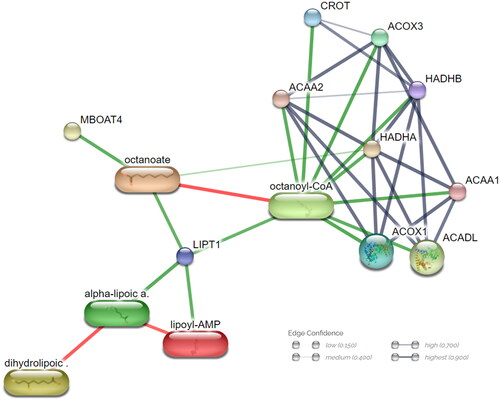
The PICRUSt2 database identified 85 microorganisms, which is contributing to the significant pathways, and the KEGG database matched 338 pathway-contributing metabolites to InChIKey from statistically significant 11 pathways and clusters with 17 categories based on class level of HMDB database. The STITCH database established 22 metabolite-induced pathways by analysing contributing metabolite and target interactions the size of the box indicates the number of contributing factors. The fatty acid degradation pathway were identified as one of largest microbiome induced metabolite contributing pathways and overlapped with GSEA results in the transcriptome analysis (). Furthermore, a PPI network analysis delineated metabolite host contributions in fatty acid degradation analysis. Anticipated functional partner proteins clustered with octanoyl-CoA included Acyl-CoA Oxidase 1 (ACOX1), Acyl-CoA Oxidase 3 (ACOX3), Acetyl-CoA Acyltransferase 1 (ACAA1), Acetyl-CoA Acyltransferase 1 (ACAA2), Hydroxyacyl-CoA Dehydrogenase Trifunctional Multienzyme Complex Subunit Alpha (HADHA), Hydroxyacyl-CoA Dehydrogenase Trifunctional Multienzyme Complex Subunit Beta (HADHB) and Acyl-CoA Dehydrogenase Long Chain (ACADL) ().
Figure 6. Sankey diagram of linked microbial phylum, metabolic response, inferred metabolite and host target interactions. Each taxon was represented by phylum and connected through metabolic reaction. Metabolic reactions were grouped into KEGG pathway categories. Metabolites were grouped by class in PubChem. Predicted metabolite pathways are shown in the last column.
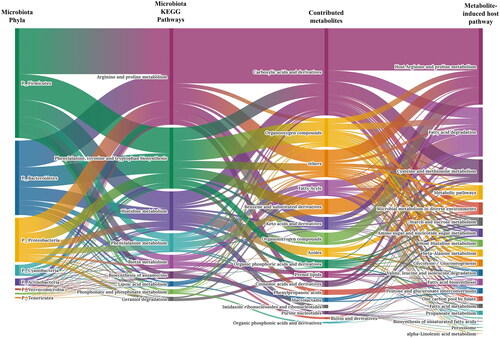
Figure 7. Microbiota impacts ‘fatty acid degradation pathway’ metabolites and gene network. Network nodes represent proteins; each node signifies all proteins produced by a single, protein-coding gene locus. Edges indicate protein–protein associations; stronger associations are illustrated with thicker lines. Protein–protein interactions are shown in grey, chemical–protein interactions in green and chemical interactions in red.
Additionally, pathway-based integration analysis of fatty acid degradation pathways with host DEGs predicted functional partner proteins and metabolites from microbiota were assessed (). Differentially expressed host genes contributed to the fatty acid degradation pathway’s beginning and end. Other predicted metabolites and functional partner proteins were primarily involved at the pathway’s midpoint.
Figure 8. ‘Fatty acid degradation pathway’ and associated gene and taxon correlations. (A) Red and blue rectangles represent up- and down-regulated genes. Each coloured edge indicates metabolite-induced host genes related to the fatty acid degradation pathway. Octaconyl-CoA was identified as a microbiota-induced protein. (B) Correlation plot between genes and taxa related to fatty acid degradation. The figure portrays 29 genes from this pathway and three microorganisms that passed the thresholds. * indicates p < 0.05 and r2 > 0.7.
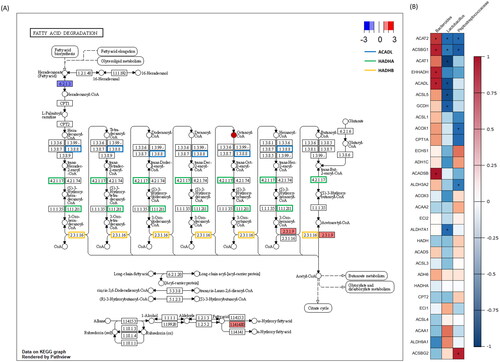
Correlation analysis evaluated 22 fatty acid degradation pathway-contributing genes and three microorganisms (Bacteroides, Lactobacillus, Peptostreptococcaceae). Bacteroides exhibited a positive (r2 > 0.7) association with Acetyl-CoA Acetyltransferase 2 (ACAT2), Acyl-CoA Synthetase Bubblegum Family Member 1 (ACSBG1), Enoyl-CoA Hydratase And 3-Hydroxyacyl CoA Dehydrogenase (EHHADH), Acyl-CoA Dehydrogenase Long Chain (ACADL) and Acyl-CoA Dehydrogenase Short/Branched Chain (ACADSB), whereas Lactobacillus negatively correlated with ACAT1, ACADL, Achaete-Scute Family BHLH Transcription Factor 5 (ASCL5), Glutaryl-CoA Dehydrogenase (GCDH) and Aldehyde Dehydrogenase 7 Family Member A1 (ALDH7A1). Peptostreptococcaceae negatively correlated with ACAT2, ACSBG1, ACOX1 and carnitine palmitoyltransferase 1 A (CPT1A) and positively correlated with Acyl-CoA Synthetase Bubblegum Family Member 2 (ACSBG2).
Discussion
Functional DEGs among intestinal tissues under heat stress
Functional annotation analysis results of host using the KEGG database revealed ‘Tryptophan Metabolism’ and ‘Glycine, Serine and Threonine Metabolism’ as significant pathways in the functional annotations of up-regulated DEGs (). Consistently, the GSEA results confirmed that the ‘Protein Metabolism’ and ‘Fatty Acid Degradation Pathways’ were significant. Tryptophan, glycine and threonine compositional changes occur in broilers under heat stress for energy supply.Citation41 Including tryptophan and glycine, the jejunum digests and delivers nutrients to the body.Citation42 Our results suggest that changes in mRNA expression on the surface of the jejunum lead to distortions in the digestion and absorption of amino acids. In addition, broiler chickens regularly use adipocytokines for energy metabolism when exposed to heat stress. In other livestock breeds, including other broilers, adipocytokine signalling contributes to stress adaptation by activating energy metabolism in chronic high-temperature scenarios.Citation41,Citation43,Citation44
Fatty acid degradation identified in GSEA results includes oxidation (), and chronic heat stress during lipid peroxidation prompts cytochrome C reduction and the production of hydroxyl radicals.Citation45 Moreover, oxidative lipid degradation promotes cell death by producing peroxidesCitation46; the subsequent cell reproduction regulation inhibits nutrient digestion and body weight gain. Indeed, statistically significant decreases in growth performance such as body weight, bodyweight gain and feed intake were observed in the same experiments.Citation27 Furthermore, strengthened fatty acid degradation in the jejunum, which is responsible for digestion and absorption, contributes to the adaptation process by increasing energy metabolism during heat stress. A similar study on other animals confirmed that appetites waned when elevated fatty acid oxidation augmented energy metabolism.Citation47 Therefore, the reduced appetite in broilers due to heat stress was likely caused by increased fatty acid decomposition in the jejunum.
Alternatively, the KEGG pathway analysis and GSEA using down-regulated DEGs revealed involvement of cell cycle and DNA replication pathways ( and ). Jejunal tissues produce heightened shock proteins when exposed to high ambient temperatures.Citation48 Denatured and aggregated proteins damage intestinal cells and mucosa,Citation49–51 diminishing feed intake, feed efficiency and nutrient transporters that aid luminal bacteria invasion.Citation52 Moreover, heat stress leads to apoptosis of intestinal epithelial cells as a result of elevated reactive oxygen species.Citation53 Our analysis of differentially expressed genes (DEGs) shows up-regulation of functional pathways related to fatty acid oxidation, suggesting that cell cycle disruption, DNA replication and fatty acid degradation may impede the recovery of damaged jejunal tissue.
Taxonomic modification under ambient temperature modification
According to the taxonomic analysis of microorganism classification, the Firmicutes phylum and Lactobacillus genus were dominant in both groups, but they were markedly higher in the Heat group ().Citation54,Citation55 Our findings support previous reports that Firmicutes and Lactobacillus are the predominant species in the jejunal microbiota of swine.Citation56 Notably, previous studies have suggested that a low abundance of Lactobacillus increases intestinal permeability and disrupts obesity metabolism, which aligns with the observations in our study. Thus, the Firmicutes/Bacteroidetes (F/B) ratio correlated with host–microbiota imbalance and obesity degree, significantly prevalent in the heat-stressed group.Citation57
The Heat group exhibited remarkably abundant Peptostreptococcaceae and Bacteroides, while the Normal group showed a strikingly high abundance of Firmicutes and the Lactobacillus genus (). Elevated levels of the Bacteroides genus in the intestines led to intestinal dysbiosis, which dominated the degradation efficacy in the gut and altered fatty acid metabolism.Citation58 Previous studies have observed that dysbiosis, characterized by low Lactobacillus levels of Lactobacillus, can lead to increased intestinal permeability and contribute to metabolic dysfunction associated with obesity, which is consistent with our findings.Citation59
A microorganism’s metabolism produces short-chain fatty acid (SCFA) and branched-chain fatty acid as final fat and protein metabolites.Citation60,Citation61 Our findings suggest that environmental changes alter the composition of the microbiome, leading to an increase in SCFA production under heat stress as a result of increased protein and fat metabolisms (). SCFAs participate in host fat metabolism and increase lipid peroxidation by moulding an environment that exposes intestinal epithelial cells to lipid peroxide products.Citation62 In addition, our transcriptome analysis revealed that apoptosis, proliferation and growth cessation disrupt the cell cycle when exposed to products undergoing lipid peroxidation.Citation63
Moreover, lipid peroxidation products loosen tight junctions in intestinal epithelial tissue.Citation64 The current study identified a term related to the synthesis of L-tryptophan induced by heat stress. Metabolic products of bacterial L-tryptophan directly influence the host’s immune systemCitation65 and activate epithelial barrier functions by enhancing tight junctions in pig intestinal epithelial cells.Citation66 Our transcriptome analysis revealed a significant increase in tryptophan metabolism, suggesting that intestinal epithelial cells activate tryptophan in response to heat stress damage.
This study also ascertained that heat stress fluctuated microbial flora in pigs. These results indicate that the microbiome compositions showed increased abundance of the Firmicutes phylum and Lactobacillus genus in both groups, with this dominance being more pronounced in the heat-stressed group. However, the groups showed no statistically significant differences in alpha-diversity index. Heightened levels of Peptostreptococcaceae and Bacteroides in the Heat group altered fatty acid metabolism. Similarly, increased heat stress led to higher production of SCFAs, which in turn was linked to increased protein and fat metabolisms, leading to lipid peroxidation and intestinal epithelial cell disruption.
Functional host and microbiota interactions
We noted that microbiota adapted to environmental heat stress conditions by accelerating energy metabolism ().Citation67 Pathways related to metabolite identification indicated that the microorganism’s metabolism produced an excessive amount of metabolites for host energy production. In addition, the host contributing pathways identified from the predicted metabolites were confirmed to be primarily protein, proline and fat metabolism, including arginine and fatty acid degradation. Furthermore, the degradation products of fatty acids were found to SCFA, which influences host lipid peroxidation and cell cycle disruption.Citation68 These results propose that microbiota and host transcriptomes utilize the host’s metabolites as a mediator in the fatty acid degradation process.
Clustered protein and metabolite PPI networks involved in fatty acid degradation include ACOX1, ACOX2, ACOX3, ACAA1, ACAA2, HADHA, HADHB, CROT and octanoyl-CoA (). By utilizing proteins, metabolites and DEGs obtained from transcriptome analyses, we confirmed that the transcripts involved in fatty acid degradation are present in both the initial and final stages. Additionally, microorganism-derived metabolites and proteins were found to contribute to the repetitive degradation process. These findings not only confirm the involvement of the transcript in the degradation process but also suggest that modifications by microorganisms influence energy metabolism, particularly affecting host fatty acid degradation.
Bacteroides, Lactobacillus and Peptostreptococcaceae were prevalent microorganisms involved in these interactions and exhibited differential abundance. Correlation analysis between corresponding microorganisms and genes involved in fatty acid degradation identified ACAT2, ACSBG1, ACAT1, EHHADAH and ACADL as highly related to three microbiota (). These genes encode proteins that specifically influence the stabilization induced by lipids, particularly associated with mitigating lipotoxicity through lipid-induced stabilization.Citation69,Citation70 When considered alongside changes in the microbial community, these alterations corresponded to an increase in Bacteroides and a decrease in Lactobacillus and Peptostreptococcaceae during heat stress. This led to modifications in key genes, including those in the ACAT gene family, which affect competitive fat oxidation in broiler chickens. The ACADL gene has a significant function in the fatty acid degradation pathway and is highly correlated with significant taxa. It catalyses the initial stage of mitochondrial fatty acid oxidation and has adverse effects on muscle and fat synthesis.Citation71,Citation72 The findings from previous study are consistent with a verified decrease in cell cycle and DNA replication, as indicated by RNA sequencing results. Thus, changes in the expression level of the ACADL gene, associated with the increase in Bacteroides and the decrease in Lactobacillus and Peptostreptococcaceae, not only affect the fatty acid degradation and oxidation but are also closely linked to cell regeneration and division within the host’s jejunum. Consequently, our results suggest that ACADL serves as a key gene and a potential biomarker for damage caused by heat stress. Additionally, Bacteroides positively correlated with ACADSB, which encodes the short/branched-chain acyl-CoA dehydrogenase that catalyses the dehydrogenation of acyl-CoA derivatives in fatty acid metabolisms.Citation73 Since Bacteroides contribute to lipid metabolism and decrease the circulation of lipid peroxidation products, we hypothesize that elevated ACADSB gene and Bacteroides concentrations contribute to lipid degradation by up-regulating expression levels of other genes.
This study unveiled interactions between microorganisms and hosts mediated by metabolites to the lipid peroxidation under heat stress. We provided candidate biomarkers in microbiota and genes under heat stress conditions including Bacteroides, Lactobacillus, Peptostreptococcaceae, ACADL, ACAT gene family and ACOX gene family which are related with fatty acid degradation pathway. Our findings contribute to a more comprehensive understanding of the physiological and molecular mechanisms underlying broiler adaptations to heat stress conditions, aiding heat-stress countermeasure developments in poultry industry. However, additional metabolomic analysis, which considers quantitative data on metabolites produced by microorganisms is necessary for a more comprehensive understanding.
Ethical approval and consent to participate
All experiments were reviewed and approved by the Chun-Ang University Animal Care and Use Committee (Statement No. 2020-00022).
Supplemental Material
Download MS Excel (16.8 KB)Supplemental Material
Download MS Excel (21.8 KB)Supplemental Material
Download MS Excel (31.3 KB)Supplemental Material
Download MS Excel (12.5 KB)Supplemental Material
Download MS Excel (26.2 KB)Supplemental Material
Download MS Excel (18.1 KB)Acknowledgements
The authors would like to thank Ji-Yeong Lee, Chung-Ang University, Korea, for visualization guidance related to this work and Dr. Rajesh Kumar Pathak, Chung-Ang University, Korea, for writing guidance related to this work.
Disclosure statement
The authors declare no competing interests.
Data availability statement
The datasets generated and analysed during the current study are available in the NCBI Sequence Read Archive (SRA) repository, https://www.ncbi.nlm.nih.gov/sra/PRJNA984346.
Additional information
Funding
References
- St-Pierre N, Cobanov B, Schnitkey G. Economic losses from heat stress by US livestock industries. J Dairy Sci. 2003;86:1–16.
- Lee H. Intergovernmental Panel on Climate Change. World Meteorological Organization. 2007;52:1–43.
- Lara LJ, Rostagno MH. Impact of heat stress on poultry production. Animals. 2013;3(2):356–369.
- Mashaly MM, Hendricks GL, Kalama MA, et al. Effect of heat stress on production parameters and immune responses of commercial laying hens. Poult Sci. 2004;83(6):889–894.
- Bartlett J, Smith M. Effects of different levels of zinc on the performance and immunocompetence of broilers under heat stress. Poult Sci. 2003;82(10):1580–1588.
- Quinteiro-Filho WM, Ribeiro A, Ferraz-de-Paula V, et al. Heat stress impairs performance parameters, induces intestinal injury, and decreases macrophage activity in broiler chickens. Poult Sci. 2010;89(9):1905–1914.
- Lin H, Decuypere E, Buyse J. Acute heat stress induces oxidative stress in broiler chickens. Comp Biochem Physiol A Mol Integr Physiol. 2006;144(1):11–17.
- Akbarian A, Michiels J, Degroote J, et al. Association between heat stress and oxidative stress in poultry; mitochondrial dysfunction and dietary interventions with phytochemicals. J Anim Sci Biotechnol. 2016;7(1):37.
- Santos RR, Awati A, Roubos-van den Hil PJ, et al. Quantitative histo-morphometric analysis of heat-stress-related damage in the small intestines of broiler chickens. Avian Pathol. 2015;44(1):19–22.
- Ferraris RP. Dietary and developmental regulation of intestinal sugar transport. Biochem J. 2001;360(Pt 2):265–276.
- Ferrer R, Gil M, Moretó M, et al. Hexose transport across the apical and basolateral membrane of enterocytes from different regions of the chicken intestine. Pflugers Arch. 1994;426(1–2):83–88.
- Rajput IR, Ying H, Yajing S, et al. Saccharomyces boulardii and Bacillus subtilis B10 modulate TLRs and cytokines expression patterns in jejunum and ileum of broilers. PLoS One. 2017;12(3):e0173917.
- Sun X, Zhang H, Sheikhahmadi A, et al. Effects of heat stress on the gene expression of nutrient transporters in the jejunum of broiler chickens (Gallus gallus domesticus). Int J Biometeorol. 2015;59(2):127–135.
- Lan PTN, Sakamoto M, Benno Y. Effects of two probiotic Lactobacillus strains on jejunal and cecal microbiota of broiler chicken under acute heat stress condition as revealed by molecular analysis of 16S rRNA genes. Microbiol Immunol. 2004;48(12):917–929.
- Brugaletta G, Teyssier J-R, Rochell SJ, et al. A review of heat stress in chickens. Part I: insights into physiology and gut health. Front Physiol. 2022;13:934381.
- Rostagno MH. Effects of heat stress on the gut health of poultry. J Anim Sci. 2020;98(4):skaa090.
- Zhang Y, Chen H, Cong W, et al. Chronic heat stress affects bile acid profile and gut microbiota in broilers. Int J Mol Sci. 2023;24(12):10238.
- Goel A, Ncho CM, Jeong C-M, et al. Dietary supplementation of solubles from shredded, steam-exploded pine particles modifies gut length and cecum microbiota in cyclic heat-stressed broilers. Poult Sci. 2023;102(4):102498.
- Liu Z, Liu Y, Xing T, et al. Transcriptome analysis reveals the mechanism of chronic heat stress on meat quality of broilers. J Anim Sci Biotechnol. 2022;13(1):110.
- Kim H, Kim H, Seong P, et al. Transcriptomic response under heat stress in chickens revealed the regulation of genes and alteration of metabolism to maintain homeostasis. Animals. 2021;11(8):2241.
- Halliwell B, Whiteman M. Measuring reactive species and oxidative damage in vivo and in cell culture: how should you do it and what do the results mean? Br J Pharmacol. 2004;142(2):231–255.
- Murota K, Nakamura Y, Uehara M. Flavonoid metabolism: the interaction of metabolites and gut microbiota. Biosci Biotechnol Biochem. 2018;82(4):600–610.
- Chu H, Khosravi A, Kusumawardhani IP, et al. Gene-microbiota interactions contribute to the pathogenesis of inflammatory bowel disease. Science. 2016;352(6289):1116–1120.
- Caputi V, Popov J, Giron MC, O Apos Mahony S. Gut microbiota as a mediator of host neuro-immune interactions: implications in neuroinflammatory disorders. Mod Trends Psychiatry. 2021;32:40–57.
- Kim D-Y, Kim J-M. Multi-omics integration strategies for animal epigenetic studies—a review. Anim Biosci. 2021;34(8):1271–1282.
- Hasin Y, Seldin M, Lusis A. Multi-omics approaches to disease. Genome Biol. 2017;18(1):83.
- Kim DY, Kim JH, Choi WJ, et al. Comparative effects of dietary functional nutrients on growth performance, meat quality, immune responses, and stress biomarkers in broiler chickens raised under heat stress conditions. Anim Biosci. 2021;34(11):1839–1848.
- Aviagen W. Ross 308 Broiler Nutrition Specifications. Huntsville, AL: Aviagen; 2014.
- Andrews S, et al. FastQC: A Quality Control Tool for High Throughput Sequence Data. 2010. [Online]. Available online at: http://www.bioinformatics.babraham.ac.uk/projects/fastqc/
- Bolger AM, Lohse M, Usadel B. Trimmomatic: a flexible trimmer for Illumina sequence data. Bioinformatics. 2014;30(15):2114–2120.
- Kim D, Paggi JM, Park C, et al. Graph-based genome alignment and genotyping with HISAT2 and HISAT-genotype. Nat Biotechnol. 2019;37(8):907–915.
- Liao Y, Smyth GK, Shi WJB. featureCounts: an efficient general purpose program for assigning sequence reads to genomic features. Bioinformatics. 2014;30(7):923–930.
- Robinson MD, McCarthy DJ, Smyth GKJB. edgeR: a Bioconductor package for differential expression analysis of digital gene expression data. Bioinformatics. 2010;26(1):139–140.
- Supek F, et al. REVIGO summarizes and visualizes long lists of gene ontology terms. PloS one. 2011;6(7).
- Smoot ME, Ono K, Ruscheinski J, et al. Cytoscape 2.8: new features for data integration and network visualization. Bioinformatics. 2011;27(3):431–432.
- Shannon CE. A mathematical theory of communication. Bell Syst Techn J. 1948;27(3):379–423.
- Parks DH, Tyson GW, Hugenholtz P, et al. STAMP: statistical analysis of taxonomic and functional profiles. Bioinformatics. 2014;30(21):3123–3124.
- Szklarczyk D, Santos A, von Mering C, et al. STITCH 5: augmenting protein–chemical interaction networks with tissue and affinity data. Nucleic Acids Res. 2016;44(D1):D380–D384.
- MacMillan HA, Knee JM, Dennis AB, et al. Cold acclimation wholly reorganizes the Drosophila melanogaster transcriptome and metabolome. Sci Rep. 2016;6(1):28999.
- Luo W, Brouwer C. Pathview: an R/Bioconductor package for pathway-based data integration and visualization. Bioinformatics. 2013;29(14):1830–1831.
- Ma B, Zhang L, Li J, et al. Heat stress alters muscle protein and amino acid metabolism and accelerates liver gluconeogenesis for energy supply in broilers. Poult Sci. 2021;100(1):215–223.
- Tasaki I, Takahashi N. Absorption of amino acids from the small intestine of domestic fowl. J Nutr. 1966;88(4):359–364.
- Qaid MM, Al-Garadi MA. Protein and amino acid metabolism in poultry during and after heat stress: a review. Animals. 2021;11(4):1167.
- Wheelock JB, Rhoads RP, Vanbaale MJ, et al. Effects of heat stress on energetic metabolism in lactating Holstein cows. J Dairy Sci. 2010;93(2):644–655.
- Altan O, Pabuçcuoğlu A, Altan A, et al. Effect of heat stress on oxidative stress, lipid peroxidation and some stress parameters in broilers. Br Poult Sci. 2003;44(4):545–550.
- Gaschler MM, Stockwell BR. Lipid peroxidation in cell death. Biochem Biophys Res Commun. 2017;482(3):419–425.
- Karimian Azari E, Leitner C, Jaggi T, et al. Possible role of intestinal fatty acid oxidation in the eating-inhibitory effect of the PPAR-α agonist Wy-14643 in high-fat diet fed rats. PLoS One. 2013;8(9):e74869.
- Endong B, Yuanying G, Hartung J, et al. Relation between pathologic damages and HSP70 changes in acute heat stressed broilers. Zhongguo Nong ye ke Xue = Zhongguo Nongye Kexue. 2004;37(2):301–305.
- Stojadinovic A, Kiang J, Smallridge R, et al. Induction of heat-shock protein 72 protects against ischemia/reperfusion in rat small intestine. Gastroenterology. 1995;109(2):505–515.
- Beck S, et al. Presence of the stress-inducible form of hsp-70 (hsp-72) in normal rat colon. Shock. 1995;3(6):398–402.
- Tsuruma T, Yagihashi A, Watanabe N, et al. Heat-shock protein-73 protects against small intestinal warm ischemiareperfusion injury in the rat. Surgery. 1999;125(4):385–395.
- Habashy WS, Milfort MC, Fuller AL, et al. Effect of heat stress on protein utilization and nutrient transporters in meat-type chickens. Int J Biometeorol. 2017;61(12):2111–2118.
- Yi G, Li L, Luo M, et al. Heat stress induces intestinal injury through lysosome-and mitochondria-dependent pathway in vivo and in vitro. Oncotarget. 2017;8(25):40741–40755.
- Rychlik I. Composition and function of chicken gut microbiota. Animals. 2020;10(1):103.
- Lu J, Idris U, Harmon B, et al. Diversity and succession of the intestinal bacterial community of the maturing broiler chicken. Appl Environ Microbiol. 2003;69(11):6816–6824.
- Holman DB, Brunelle BW, Trachsel J, et al. Meta-analysis to define a core microbiota in the swine gut. mSystems. 2017;2(3):e00004-17.
- Wen L, Ley RE, Volchkov PY, et al. Innate immunity and intestinal microbiota in the development of type 1 diabetes. Nature. 2008;455(7216):1109–1113.
- Ridaura VK, Faith JJ, Rey FE, et al. Gut microbiota from twins discordant for obesity modulate metabolism in mice. Science. 2013;341(6150):1241214.
- Pedersen R, Ingerslev H-C, Sturek M, et al. Characterisation of gut microbiota in Ossabaw and Göttingen minipigs as models of obesity and metabolic syndrome. PLoS One. 2013;8(2):e56612.
- Morrison DJ, Preston T. Formation of short chain fatty acids by the gut microbiota and their impact on human metabolism. Gut Microbes. 2016;7(3):189–200.
- Mafra D, Barros AF, Fouque D. Dietary protein metabolism by gut microbiota and its consequences for chronic kidney disease patients. Future Microbiol. 2013;8(10):1317–1323.
- He J, Zhang P, Shen L, et al. Short-chain fatty acids and their association with signalling pathways in inflammation, glucose and lipid metabolism. Int J Mol Sci. 2020;21(17):6356.
- Gotoh Y, Noda T, Iwakiri R, et al. Lipid peroxide‐induced redox imbalance differentially mediates CaCo‐2 cell proliferation and growth arrest. Cell Prolif. 2002;35(4):221–235.
- Aw TY. Molecular and cellular responses to oxidative stress and changes in oxidation-reduction imbalance in the intestine. Am J Clin Nutr. 1999;70(4):557–565.
- Gao J, Xu K, Liu H, et al. Impact of the gut microbiota on intestinal immunity mediated by tryptophan metabolism. Front Cell Infect Microbiol. 2018;8:13.
- Wang H, Ji Y, Wu G, et al. L-tryptophan activates mammalian target of rapamycin and enhances expression of tight junction proteins in intestinal porcine epithelial cells. J Nutr. 2015;145(6):1156–1162.
- Rowland I, Gibson G, Heinken A, et al. Gut microbiota functions: metabolism of nutrients and other food components. Eur J Nutr. 2018;57(1):1–24.
- Blottière HM, et al. Molecular analysis of the effect of short-chain fatty acids on intestinal cell proliferation. Proc Nutr Soc. 2003;62(1):101–106.
- Kim JW, Lee J-Y, Oh M, et al. An integrated view of lipid metabolism in ferroptosis revisited via lipidomic analysis. Exp Mol Med. 2023;55(8):1620–1631.
- Wang Y-J, Bian Y, Luo J, et al. Cholesterol and fatty acids regulate cysteine ubiquitylation of ACAT2 through competitive oxidation. Nat Cell Biol. 2017;19(7):808–819.
- Kurtz DM, Rinaldo P, Rhead WJ, et al. Targeted disruption of mouse long-chain acyl-CoA dehydrogenase gene reveals crucial roles for fatty acid oxidation. Proc Natl Acad Sci U S A. 1998;95(26):15592–15597.
- Rinaldo P, Matern D, Bennett MJ. Fatty acid oxidation disorders. Annu Rev Physiol. 2002;64(1):477–502.
- Jiang P, Fang X, Zhao Z, et al. The effect of short/branched chain acyl-coenzyme A dehydrogenase gene on triglyceride synthesis of bovine mammary epithelial cells. Arch Anim Breed. 2018;61(1):115–122.