
Abstract
Objectives
In cognitive behavioral therapy (CBT) for social anxiety disorder (SAD), avoidance behavior (AB) and cognitions (COG) are two important targets of intervention, but so far no studies have directly examined their relative importance. By means of cross-lagged panel models (CLPM), we examined their temporal associations and impacts on outcome in clients with symptoms of SAD while addressing typical methodological challenges.
Method
We used data from the first six therapy sessions in a sample of 428 primary care clients (mean [SD] age = 34.6 [12.2], 34.3% men), participating in the Prompt Mental Health Care trial. Session-by-session data was collected on AB, COG, depression and general anxiety. Competing multiple indicator CLPMs were tested.
Results
The Random Intercept-CLPM provided best fit, and indicated that AB predicted COG at subsequent time points (.39 ≤ β ≤ .42 for T2–T5, p < .05), but not vice versa. In addition, AB, but not COG, predicted clients’ general anxiety score at subsequent time points. Results were both robust to the inclusion of depressive symptoms as a within-level covariate, and sensitivity tests for stationarity and missing data assumptions.
Conclusion
Targeting avoidance behavior for primary care clients with symptoms of SAD may be more vital for the optimal effect of CBT than targeting cognitions. Methodological considerations and limitations of the study are discussed.
Trial registration: ClinicalTrials.gov identifier: NCT03238872.
Clinical or methodological significance of this article: The present study investigates temporal associations between avoidance behavior and cognitions in clients with symptoms of social anxiety disorder (SAD) who receive cognitive behavioral therapy in a primary care setting. Using state-of-the-art statistical models, our findings suggest that SAD-related avoidance behavior predicts SAD-related cognitions, but not vice versa. The results were robust to the inclusion of depressive symptoms as a covariate, and suggest that targeting avoidance behavior for primary care clients with symptoms of SAD may be vital for the optimal effect of CBT.
Introduction
Social anxiety disorder (SAD) is characterized by a marked fear of being negatively evaluated by others in one or more social situations. The situations are avoided or endured with intense fear or anxiety (American Psychiatric Association, Citation2013). It is among the most prevalent anxiety disorders worldwide, and accounts therefore for a significant part of the burden of common mental disorders (CMDs) (Folkehelseinstituttet, Citation2018; Hay et al., Citation2017; Stein et al., Citation2017). This is related to its high prevalence, but also to its presumed chronicity if left untreated, and the risk of leading to other mental disorders (Remes et al., Citation2016). The disorder can have detrimental effects on the health status and general functioning of the individual, and results in huge costs for society (Stuhldreher et al., Citation2014).
Although several meta-analyses have consistently suggested cognitive behavioral therapy (CBT) to be an effective treatment for SAD (Carpenter et al., Citation2018; Hans & Hiller, Citation2013; Hofmann et al., Citation2012), research on how and why psychological treatment works remains unsettled (Hayes et al., Citation2007). According to the commonly applied Clark and Wells model (C&W) (Clark & Wells, Citation1995), both maladaptive cognitions and avoidance behavior are considered central maintaining factors of SAD, and are as such important targets of interventions. The model assumes that upon social interaction dysfunctional beliefs are activated, leading to the cognitive appraisal of danger, which in turn may result in avoidance behavior. Patients with SAD tend to overestimate both the likelihood and the consequences of negative outcomes, respectively known as likelihood bias and cost bias (Powers et al., Citation2017; Smits et al., Citation2012). As such, a person with SAD may have an exaggerated belief that showing visible signs of anxiety in social situations will result in social rejection (Smits et al., Citation2012). The resulting use of avoidance behavior is assumed to prevent disconfirmation of SAD persons’ cognitions about the high likelihood and cost of negative social events and thus makes SAD persist. In other words, the C&W model assumes a reciprocal temporal relationship between maladaptive cognitions and avoidance behavior.
While both mechanisms have been shown to be associated with recovery from SAD (Aderka et al., Citation2013; Hoffart et al., Citation2016; Johnson et al., Citation2018; Santoft et al., Citation2019), we weren’t able to identify a single study that examined the temporal associations between maladaptive social anxiety cognitions and a specific measure of avoidance behavior. Some studies did include avoidance behavior as part of a composite measure of symptoms of social anxiety, and examined the association with cognitions, but as the composite measures included multiple dimensions of SAD, this provided incomplete information on the true relationship between these two mechanisms (Hoffart et al., Citation2016; Santoft et al., Citation2019). As such, more studies are needed to clarify whether direction and strength of the association between cognitions and avoidance behavior in the context of SAD are compatible with the C&W model, and to what extent they are differently associated with symptoms of anxiety. This is important from a theoretical and practical perspective at it may both provide a better understanding about the causal mechanisms involved in SAD as well as additional guidance about what mechanisms to focus on in therapy in order to achieve better outcomes.
As temporal associations are typically studied in longitudinal research designs in which data are collected at repeated measurement occasions (e.g. weekly), there are a number of methodological issues to consider. In the context of therapy, within-person changes are of key interest, and it is as such important to distinguish between within- and between-person effects. As pointed out by several other researchers, previous studies have often failed to do so, which may have led to biased results (Hamaker et al., Citation2015; Hoffart et al., Citation2016). Not accounting for measurement error and lack of discriminant validity between the included constructs may also seriously affect the direction of the temporal associations and may potentially lead to false conclusions (Kröger et al., Citation2016; Rodriguez et al., Citation2016). In addition, most studies that collect data at multiple occasions suffer from attrition and non-response. Although maximum likelihood-based methods can deal with missing follow-up data under the missing-at-random (MAR) assumption, part of the missing follow-up data may well be missing-not-at-random (MNAR). This may particularly be true for treatment studies as, for example, those with lack of improvement may be more likely to drop out. Sensitivity analyses are therefore warranted (Enders, Citation2010). A final issue that is often ignored but important to consider when examining temporal associations is statistical power (Masselink et al., Citation2018).
The data available for the present study is based on a relatively large sample that stems from the evaluation of Prompt Mental Health Care (PMHC)(Knapstad et al., Citation2020), which is the Norwegian version of Improving Access to Psychological Therapies (IAPT)(Clark et al., Citation2009), and treats people with anxiety and/or mild-to-moderate depression by means of CBT. The service does not formally set diagnoses but uses screening instruments as part of an intake interview to identify compliance with in- and exclusion criteria for treatment, the available client resources, and motivation for treatment. As such, the study population is heterogeneous with regard to the number, type, and severity of presented problems and reflects to a large degree a real-life primary care setting.
The present study aimed to examine the temporal associations between avoidance behavior (AB) and cognitions (COG) by means of cross-lagged panel models while addressing the methodological issues mentioned earlier. Based on the C&W model, we hypothesized reciprocal effects. As SAD often is accompanied by symptoms of depression, and may even be directly influenced by this (Moscovitch et al., Citation2005), it was also examined whether the associations between AB and COG altered when symptoms of depression were added as a co-variate. Finally, the predictive value of AB and COG on general symptoms of anxiety was examined as well.
Methods
Setting
PMHC was introduced in Norway in 2012 (Knapstad et al., Citation2018). The present study used data from the PMHC treatment arm of an RCT study in the municipalities of Sandnes and Kristiansand. A detailed description of the trial can be found elsewhere, ClinicalTrials.gov NCT03238872 (Knapstad et al., Citation2020).
Procedures
All clients contacting PMHC participated in an initial assessment. During this session, information about the study and treatment methodology within PMHC was provided, and the therapist assessed relevant information to decide whether PMHC could be the appropriate treatment or not. The therapist identified the relevance and severity of the mental problems, and the available client resources. Participation was based on opt-in, where clients who were suitable for treatment were invited to participate and asked to sign an informed consent.
Inclusion criteria for PMHC are being inhabitant of the specific municipality offering PMHC, being ≥18 years of age, and having clinically significant levels of anxiety and/or mild to moderate symptoms of depression based on cut-off values from validated questionnaires (formal diagnosis not provided). Clients entitled to secondary care services due to eating disorder, suicide risk, bipolar disorder, severe depression, invalidating anxiety (qualitative consideration on whether client would be able to take part in treatment as offered by PMHC), psychotic symptoms, severe substance abuse, personality disorder, two or more previous treatment attempts without effect, and serious physical health problem as prime problem disorder are generally excluded from PMHC and are referred elsewhere. Clients completed questionnaires during the initial assessment, and before each session during the treatment. The study was approved by the Regional Ethics Committee for Western Norway (REK-vest no. 2015/885).
Participants
Between Nov 9, 2015, and Aug 31, 2017, 1189 clients were assessed for eligibility. Of these, 353 did not meet the inclusion criteria, 35 declined treatment and 26 declined trial participation. Subsequently, 774 clients were randomized to either PMHC or TAU. The total number of participants in the PMHC group was 526. Sessions were planned on an individual basis to fit the schedule of both therapists and clients. The maximum number of sessions in PMHC was 15, although most clients terminate treatment long before that (median no. of sessions = 6.0).
For the present study, we aimed to examine the development of AB and COG during the first 6 therapy sessions including the initial assessment (T0). Six sessions were chosen as a trade-off between substantial treatment duration, reasonable sample size, and sufficient number of measurement occasions. Clients were screened for clinical relevant symptoms of social anxiety by means of a 9-item version of the Social Phobia Inventory (SPIN-9), which is an abbreviated version of the original 17-item version (Connor et al., Citation2000). Prior to the study, item selection for the abbreviated version was carried out by two experienced researchers at Modum Bad in Norway based on clinical experience and statistical information from previous studies. The SPIN-9 consisted of the subscale physiological symptoms (4 items) and the subscale avoidance (5 of the 6 original items). These subscales were included as they were considered more concrete targets for treatment in the context of PMHC compared to the excluded subscale fear. Data from a previous study (Johnson et al., Citation2017) was used to calculate the correlation between SPIN-9 and SPIN-17 that equaled .95, suggesting a near-perfect overlap. Only clients who scored >4.5 at baseline were asked to complete SPIN-9 at consecutive measurement occasions and were included in the present study (N = 428). The former was done to reduce the response burden for clients for whom social anxiety clearly was not relevant. As a formal cut-off has not been established for the SPIN-9, we chose a rather liberal cut-off of >4.5 during data collection. For the original SPIN-17, the IAPT recommended cut-off to screen for social anxiety disorder is >18 (“The IAPT data handbook version Citation2,” Citation2011), which would translate to a cut-off >9.5 for the SPIN-9. To preserve sample size, participants with scoring above 4.5 cut-off were included in the main analyses, whereas the 9.5 cut-off was used as part of a sensitivity analysis (see statistical analysis section). The average follow-up times measured in weeks and the number of observations were as follows: T1avg = 2.9, SD = 2.5, n = 371; T2avg = 4.7, SD = 3.7, n = 322; T3avg = 6.3, SD = 3.9, n = 279; T4avg = 8.7, SD = 5.2, n = 211; T5avg = 12.9, SD = 6.8, n = 156.
Treatment
Each site had one clinical psychologist who carried the professional responsibility. All therapists (n = 11; 63.6% females, mean age 41.5 years) had a minimum of three years of relevant higher education and completed an additional mandatory one-year training in cognitive behavioral therapy that was inspired by the IAPT curriculum, but adjusted to the Norwegian context. All therapists had individual treatment responsibilities. Median caseload during the study was 45 (IQR: 17–84). Treatment included both low-intensity (guided self-help and group-based psychoeducation) and high-intensity (face-to-face individual therapy) treatment forms. 37.5% of the clients primarily received low-intensity treatment, 33.0% received a mixture of low- and high-intensity treatment, whereas the remaining 29.5% primarily received high-intensity treatment (Lervik et al., Citation2020). Levels of fidelity to CBT in PMHC have been reported to be sufficient (Knapstad et al., Citation2020). All therapists received amongst others training in the Clark and Wells CBT model for SAD (Clark & Wells, Citation1995). In this model both cognitive and behavioral interventions are included. The CBT techniques used in PMHC varied considerably across clients. Based on audio-recorded sessions (early, mid and late in treatment – 3 recordings in total) from a sample of 132 clients, it was estimated that about 30% of the clients received some form of exposure training, whereas some form of cognitive restructuring was used in about 70% of the clients. This difference likely reflects the heterogeneous nature of the PMHC population (Knapstad et al., Citation2020).
Measures
As questionnaires were administered at multiple occasions and in a therapeutic setting, shortened versions were used for AB and COG, again to reduce the overall response burden.
Avoidance behavior was assessed by five items from the Social Phobia Inventory (SPIN) (Antony et al., Citation2006). We wanted to use a specific measure of SAD avoidance behavior and selected all but one of the six items from the SPIN avoidance subscale. The “Fear of embarrassment causes me to avoid doing things or speaking to people” item was left out because it is a general question much covered by the other more specific ones. The included items ranged from broad social situations such as being the center of attention to more specific items such as speaking to people in authority (). Participants were asked to report how much each avoidance behavior had been bothersome during the last week on a scale ranging from 0 (not at all) to 4 (extremely). Cronbach’s alpha varied between .72 and .87 across measurement occasions.
Table I. Item content of primary instruments.
Four items from the Social Probability and Cost Questionnaire (SPCQ) were used to measure cognitions () (McManus et al., Citation2000). These four items have been used for this purpose before (Hoffart et al., Citation2016; Johnson et al., Citation2018; Santoft et al., Citation2019), and were initially selected because these were found to have the highest Cronbach’s alpha in a study conducted with social phobia patients at Modum Bad (Hoffart et al., Citation2009). Participants were asked to report how much they believed the four statements to be true in relation to their anxiety problems on a 11-point scale from 0 (not at all) to 100 (completely). The scores were re-coded on a scale from 1 (not at all) to 11 (completely) to facilitate model estimation. Cronbach’s alpha varied between .89 and .93 across measurement occasions.
Symptoms of depression were measured using the Patient Health Questionnaire (PHQ-9). Participants were asked how often during the last two weeks they had experienced nine common symptoms of depression, such as “little interest or pleasure in doing things” and “feeling down, depressed, or hopeless” (Kroenke et al., Citation2001). The frequency of each symptom was reported on a scale from 0 (not at all) to 3 (nearly every day). At each measurement occasion, a sum score ranging from 0 to 27 was created. PHQ-9 scores have been shown to be a reliable and valid measure of depressive symptoms (Kroenke et al., Citation2001, Citation2010). In the current sample, Cronbach’s alpha varied between .78 and .85 across measurement occasions.
In the General Anxiety Disorder-7 (GAD-7) questionnaire, participants were asked to rate how often during the last two weeks they had experienced seven common symptoms of anxiety, such as “feeling nervous, anxious or on edge” and “not being able to stop or control worrying” (Kroenke et al., Citation2010; Spitzer et al., Citation2006). The frequency was reported on the same scale as for PHQ-9, from 0 (not at all) to 3 (nearly every day). At each measurement occasion, a sum score ranging from 0 to 21 was created. The GAD-7 is often used as a measure of anxiety severity and considered relevant across a wide array of anxiety disorders. It has been shown that GAD scores have satisfactory sensitivity and specificity for generalized anxiety disorder, social anxiety disorder, panic disorder and PTSD (Kroenke et al., Citation2007). Therefore, and considering the heterogeneity of the PMHC sample, the GAD-7 was regarded a relevant outcome measure of anxiety in the context of SAD. Cronbach’s alpha varied between .81 and .88 across measurement occasions.
Statistical Analysis
Descriptive statistics were calculated for manifest baseline and outcome variables. Intercorrelations were calculated across time for AB, COG, and GAD-7.
All subsequent models were estimated using full information maximum likelihood (FIML) estimation under the assumption of data missing at random (MAR) with robust standard errors (MLR). Model fit was assessed by using the Comparative Fit Index (CFI), the Root Mean Square Error of Approximation (RMSEA), and the Standardized Root Mean Square Residual (SRMR). CFI ≥ .95, RMSEA ≤ .06, and SRMR ≤ .08 were considered indicative of good model fit (Hu & Bentler, Citation1999). To compare nested models, we used the following guidelines based on the recommendations by Chen (Citation2007): a change of ≤−.010 in CFI, supplemented by a change of ≥.015 in RMSEA or a change of ≥.010 in SRMR would support the less restricted model (restricted model minus unrestricted model). When appropriate, models were also compared by means of the Aiken Information Criterion (AIC) and the Bayesian Information Criterion (BIC). A difference of 10 or more between two competing models was considered strong evidence in favor of the model with the lowest AIC/BIC values (Kass & Raftery, Citation1995).
As a first step, the basic factor structure of the AB and COG measures was examined. Two independent samples were used to test a 2-factor confirmatory factor model for AB (5 items) and COG (4 items) at baseline. For this purpose, we used data from a previous PMHC evaluation as the training sample (N = 1177; (Knapstad et al., Citation2018)), and data from the present study as the validation sample. The AB and COG factors were allowed to correlate, but error correlations and cross-loadings were not specified. If model fit indices indicated poor fit, modification indices were examined and poor functioning items were deleted on a one-to-one basis. Further analyses would be conducted only if each factor retained at least three items (see supplemental file 1 for path model specification). The final model was cross-validated in the validation sample by specifying a model with fixed parameters based on the estimates obtained from the training sample in line with procedures described by Browne and Cudeck (Citation1993).
If acceptable model fit was achieved in the previous step, discriminant validity was examined in the present sample by using a bi-factor (S-1) model in which the general factor loaded on all items, and a specific residual factor loaded on the cognition items only (Eid et al., Citation2017). In this way, the general factor represented avoidance behavior (see supplemental file 2 for path model specification). For more information about this model specification, we refer to the publication of Eid et al. (Citation2017). Fit indices were reported and standardized estimates were used to calculate the explained common variance (ECV), omega_S, and omega_HS (Rodriguez et al., Citation2016). The ECV reflects the proportion of explained common variance attributable to the general factor, omega S is a model-based estimate of the reliability for the specific factor, whereas omega HS reflects the proportion of reliable systematic variance of a subscale score after partitioning out variance attributable to the general factor.
Prior to testing the cross-lagged panel models, measurement invariance across time was also examined by consecutively comparing the configural, metric, and scalar model using the criteria for nested models described earlier. For this purpose, the multiple indicator specifications of AB and COG at each measurement occasion were included in one single model and subsequently estimated according to configural, metric, and scalar model specifications. Correlations between factors were allowed, as well as autocorrelations between similar items across measurement occasions.
A number of competing multiple indicator cross-lagged panel models were fitted to the data and compared by means of the standards outlined above. The following models were examined: the traditional cross-lagged panel model (CLPM), the random intercept cross-lagged panel model (RI-CLPM), and the latent curve model with structured residuals (LCM-SR, see ). For more information about these models, we refer to Usami et al. (Citation2019). Stationarity was initially assumed for autoregressive and reciprocal parameters, whereas residual (co-)variances were estimated freely. We also tested the impact of accounting for individually varying time of observation on the autoregressive and reciprocal parameter estimates by means of the TSCORES option in Mplus. To achieve this for the RI-CLPM model, a fixed slope was added to describe the group means of the RI-CLPM model (instead of unrestricted group means) (Usami et al., Citation2019). For the best fitting cross-lagged panel model, the stationarity assumption was relaxed by freely estimating the autoregressive and reciprocal parameters, and model fit was subsequently compared to the constrained model. To compare the size of the reciprocal associations at each time-point, Wald-tests were carried out at each time-point based on the standardized coefficients (Schuurman et al., Citation2016).
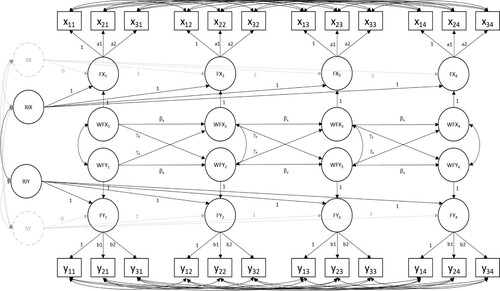
Figure 1. Bivariate multiple indicator random intercept cross-lagged panel model (only 4 of 6 timepoints displayed). Xij, Yij = observed indicators (i) for respectively AB (X) and COG (Y) at time j; FXj, FYj = latent factors for respectively AB(X) and COG (Y) at time j; RIX, RIY = random intercept for respectively AB(X) and COG (Y) – between part of the model; WFXj, WFYj = within-part of the model for respectively AB(X) and COG (Y) at time j; SX, SY = random slopes for respectively AB(X) and COG (Y) – LCM-SR model only; βx, βy = autoregressive coefficients; and γx, γy = reciprocal coefficients.
Three additional sensitivity analyses were conducted for the best fitting cross-lagged panel model as well. The first aimed to test a model under the assumption of missing data not at random (MNAR) by fitting the Diggle-Kenward selection model (Enders, Citation2010), that is modeling missingness at each occasion (T) being conditional on current (T) and previous (T-1) latent outcome scores. The second aimed to test whether the cross-lagged associations between AB and COG changed after adding symptoms of depression as a covariate. Prior to adding depression, discriminant validity at baseline of AB, COG and depression were again tested by means of the bi-factor (S-1) model. For the sake of simplicity, manifest (instead of latent) within-person depression scores (T0-T4) were used as covariates in the cross-lagged panel model.
The third sensitivity analysis was to test whether the cross-lagged relationships of the best fitting cross-lagged panel model would also hold when only the group of clients with clinically relevant symptoms of social anxiety at baseline were included (SPIN-9 score > 9.5).
Finally, the predictive value of AB and COG in terms of outcome was examined in the best fitting cross-lagged panel model by linking the participants’ within-person scores at (T-1) to within-person outcome scores of GAD at (T) while controlling for GAD scores at (T-1). Similar to the sensitivity test including depression, discriminant validity at baseline of AB, COG and GAD was again tested by means of the bi-factor (S-1) model, and manifest within-person GAD scores (T0–T5) were used as outcome in the cross-lagged panel model. A model accounting for the within-person effect of depression was also tested.
The Statistical Package for Social Science version 25 for Windows and Mplus version 8.2 were used for data analyses. The analyses conducted in the present study were not pre-registered. The Mplus in- and output files of the main analyses are available in supplemental file 3. Data are available from the corresponding author on reasonable request.
Results
Descriptive Statistics
Of the 428 participants included in this study, 34.3% (n = 147) were men. The average age was 34.6 years (SD = 12.2), and 44.2% (n = 188) of the participants did not have a partner. With regard to educational level, 10.8% (n = 46) of the sample had primary education only, 47.9% (n = 203) had high school education, whereas 41.3% (n = 175) had higher education. The percentage of participants with an immigrant background was 11.7% (n = 50). Finally, 34.6% (n = 148) was in regular work at baseline, 38.1% (n = 163) in combined work and recipients of benefits (fully or graded sick leave or graded work assessment allowance/disability benefits), and 27.4% (n = 117) was out of work with or without benefits. The average AB score was 3.04 (SD = .82; range 1–5) at baseline, while the average COG score was 5.38 (SD = 2.93; range 1–11). The average PHQ and GAD scores were 14.59 (SD = 4.82; range 0–27) and 11.90 (SD = 4.39; range 0–21), respectively. The latter reflected symptoms of depression and anxiety at the moderate level (Kroenke et al., Citation2016), which is in line with the intended target population of PMHC and IAPT (Clark et al., Citation2009; Knapstad et al., Citation2020).
The observed means based on manifest scores with regard AB and COG indicated a near monotone decrease between T0 (ABT0 = 3.04, SD = .82; COGT0 = 5.38, SD = 2.93) and T5 (ABT5 = 2.63, SD = 1.03; COGT5 = 4.17, SD = 2.68). According to conventional guidelines, this corresponded to a medium change in AB (Cohen’s d = .50) and close to a medium change in COG (Cohen’s d = .41) between T0 and T5. High correlations between time points with regard to respectively AB (.54 ≤ r ≤ .87) and COG (.60 ≤ r ≤ .86) indicated relatively high degrees of stability across time. Correlations between AB and COG across time were moderate to large (.35 ≤ r ≤ .65). Correlations across time were small to moderate for AB and GAD (.08 ≤ r ≤ .42), and small to large for COG and GAD (.21 ≤ r ≤ .52). See also supplementary file 4.
Measurement Properties
In the training sample, the two-factor model CFA containing five AB items and four COG items displayed poor model fit (CFI = .922, RMSEA = .090, SMSR = .053). Modification indices suggested that the AB item on holding a speech was the main contributor to poor model fit (3 correlated errors with other AB items: χ2 = 81.620, highest value; χ2 = 36.391; χ2 = 11.005). After deleting this item, model fit improved but was still not satisfactory (CFI = .946, RMSEA = .083, SMSR = .044). Modification indices pointed to the COG item on feeling nervous in a social situation as another primary contributor to poor model fit (Cross-loading: χ2 = 77.292, highest; three correlated errors with two other COG items and one AB item: χ2 = 33.784; χ2 = 28.348; χ2 = 10.942). The additional deletion of this item resulted in acceptable model fit (CFI = .977, RMSEA = .056, SMSR = .032). The estimates from this model were used as fixed parameters in the 2-factor CFA model that was tested in the validation sample and resulted in a near acceptable model fit (CFI = .947, RMSEA = .054, SMSR = .084). When estimating the parameters of the 2-factor CFA model freely, model fit was acceptable in the validation sample (CFI = .980, RMSEA = .055, SMSR = .039). Given these results, the 2-factor model with four AB items and three COG items was used as the basis for subsequent analyses.
As outlined in the method section, a bi-factor (S-1) model was fitted to the data at baseline in order to examine discriminant validity of the AB and COG measures. As to be expected, the bi-factor model displayed good model fit (CFI = .994, RMSEA = .033, SMSR = .032). The ECV was equal to .56, which was interpreted as evidence for multidimensionality. Moreover, omega_S, and omega_HS were respectively .89 and .67, suggesting that 75% of the reliable variance of the subscale composite score was independent of the general factor. A bi-factor (S-1) model with the COG items as the general factor and AB as the specific factor led to similar findings. Overall, the results indicated that the COG and AB items were sufficiently distinct from each other.
As a first step to test measurement invariance across time, the configural 2-factor model with correlated factors across all six measurement occasions was fitted to the data and yielded acceptable model fit (CFI = .981, RMSEA = .026, SMSR = .052). Constraining factor loadings to be equal across time for similar items did not alter model fit (CFI = .980, RMSEA = .026, SMSR = .054), which suggested metric invariance across time. Posing additional constraints on the item intercepts did not affect model fit significantly either (CFI = .977, RMSEA = .028, SMSR = .058), which provided the necessary evidence for scalar invariance across time.
Cross-lagged Panel Models and Temporal Association Estimates
As shown in , the estimates for the autoregressive and reciprocal parameters were in the same order of magnitude and direction for all models, except for the traditional CLPM. For the latter model, the autoregressive coefficients were relatively large, whereas the reciprocal coefficients were relatively small. Compared to the other included models, model fit of the traditional CLPM was only marginally worse in terms of CFI and RMSEA but was least favorable in terms of AIC and BIC. also shows that the RI-CLPM yielded the best fit compared to all other models. Relaxing the stationarity assumption by freely estimating the autoregressive and reciprocal parameters of RI-CLPM did not improve model fit (CFI = .975; RMSEA = .028; SMSR = .060), and the constrained model with similar fit () was therefore retained.
Table II. Unstandardized parameter estimates and model fit indices from different cross-lagged panel models for avoidance behavior (y) and cognitions (x).
A significant part of the variance was explained at the within-person level for both AB (25.2% at baseline) and COG (43.2% at baseline). As expected, the RI-CLPM revealed a significant, strong between-subject correlation (r = 0.56, p < .001). That is, participants with above-average levels of AB also reported more than average COG. The results further showed a moderate to strong correlated change at measurement occasions 1–5 (). This indicated that when a client’s level of AB decreased (or increased), the client’s level of COG also decreased (or increased). As these are residual correlations, these changes are not caused by changes in the included constructs at previous measurement occasions, but rather by other time-varying variables that were not modeled.
Table III. Standardized parameter estimates from the multiple indicator random intercept cross-lagged panel model (RI-CLPM) for avoidance behavior (AB) and cognitions (COG).
The results indicated that AB predicted COG but not vice versa (). The former effect was of moderate size (.39 ≤ β ≤ .42 for T2–T5). When comparing the within-person standardized reciprocal coefficients at each measurement occasion, all but one of the five Wald-tests were statistically significant (all p < .01; T2–T5). This finding provided further evidence that the effect of avoidance behavior on cognitions was in fact stronger than the other way around.
Sensitivity Analyses
The Diggle-Kenward selection RI-CLPM model was used as a sensitivity analysis of the MAR assumption. As shown in , modeling missingness under the MNAR scenario did not affect the autoregressive and reciprocal parameter estimates. It should also be noted that missingness was not related to AB and COG scores at the current (T) and the previous (T-1) measurement occasion.
The bi-factor (S-1) model with symptoms of depression as the general factor, and the AB and COG items as the two residual factors provided evidence for discriminant validity between constructs. The ECV value was .46, and relative omegas were 81% and 98% for respectively the subscale scores of AB and COG. Accounting for within-person scores of depressive symptoms at t-1 did not alter the overall results found in the previous analyses (). AB remained a predictor of COG, but the standardized effects of AB on COG did become somewhat smaller (T1: β = .19, T2: β = .35, T3: β = .36, T4: β = .36, T5: β = .38). Depressive symptoms (T-1) did not predict AB(T) and COG(T).
When fitting the RI-CLPM to the subgroup of clients with baseline SPIN scores above the IAPT recommended cut-off (N = 321), the cross-lagged estimates changed somewhat, but the findings pointed in the same direction as the model based on the full sample (AB ON COG: b = .052; 95%CI .006, .098; p = .026, COG ON AB: b = 1.082; 95%CI .566, 1.598; p < .001). Increasing the cut-off to >15 (resembles >30 for SPIN-17 and reflects moderate levels of social anxiety) did not change these estimates.
Prediction of Outcome
The bi-factor (S-1) model with symptoms of anxiety as the general factor, and the AB and COG items as the two residual factors provided evidence for discriminant validity between constructs. The ECV value was .51, and relative omegas were 91% and 86% for respectively the subscale scores of AB and COG. Accounting for GAD, COG, and AB scores at (T-1), GAD scores at (T) were predicted by AB (b = 1.377; 95%CI .674, 2.079; p < .001) but not by COG (b = .106; 95%CI −.093, .305; p = .296). The effect of AB(T-1) on GAD(T) remained significant (b = .742; 95%CI .132, 1.351; p = .017) when controlling for depressive symptoms (T-1), which itself was a predictor of GAD (T) as well (b = .136; 95%CI .023, .248; p = .018).
Discussion
In this study we examined temporal associations between AB (avoidance behavior) and COG (cognitions) in several CLPMs in clients with symptoms of SAD. All except the traditional CLPM produced similar results, but it was the RI-CLPM that yielded the best fit to our data. This model indicated both significant between- and within-person level effects. At the between-level, clients with above-average levels of AB also reported more than average COG. At the within-level, AB predicted COG at subsequent measurement occasions, but not vice versa. In other words, at the within person level this means that when a person avoided more/less than he or she usually did, he or she also thought more/less negatively at the subsequent time-point than he or she usually did, independent from stable between-person differences (e.g. gender, treatment type, therapist) (Usami et al., Citation2019). The latter effect also persisted when controlling for the within-person effect of depression. At all but one occasion, the standardized cross-lagged effects of AB were significantly larger as compared to the cross-lagged effects of COG. Finally, AB, but not COG, showed a significant within-person relationship with subsequent general symptoms of anxiety, even after accounting for the within-person effect of depression.
To our knowledge, this is the first study to temporally link COG to a pure measure of AB. Hence, we do not have results for direct comparison. Nonetheless, our main findings are supported by previous studies that have identified the within-person effect of avoidance behavior as an important predictor of outcomes in CBT for SAD (Aderka et al., Citation2013; Santoft et al., Citation2019). Other studies have identified the within-person effect of COG to be an important predictor of outcomes (Aderka et al., Citation2013; Gregory et al., Citation2018; Hoffart et al., Citation2016; Huppert et al., Citation2018; Santoft et al., Citation2019), but given the results from the present study, it is unclear whether these effects would remain statistically significant after accounting for AB.
Our results can be interpreted as support for changes in avoidance behavior being a more important driver of symptom change in clients with symptoms of SAD as compared to cognitions, and that addressing this aspect may be the preferred strategy in the context of PMHC and comparable settings. As the null-hypothesis (i.e. no effect of cognitions) can never be proven true, it may still be the case that cognitions do have an effect on avoidance behavior and symptoms of anxiety, but our findings suggest that its relative importance is likely to be smaller. Of course, the science of what intervention strategies work best in CBT is still not settled, and there has been an ongoing controversy on whether cognitive (e.g. cognitive restructuring) or behavioral (e.g. exposure) techniques work best with most of the more recent evidence suggesting that there may not be differential efficacy between cognitive and behavioral techniques (Carpenter et al., Citation2018; Hofmann & Smits, Citation2008; Longmore & Worrell, Citation2007; Norton & Price, Citation2007; Ougrin, Citation2011; Podina et al., Citation2019). However, at this point, it is unclear how our results fit into this controversy as most of the primary studies use composite outcome measures and there is thus not enough data to determine what interventions would work best to specifically reduce avoidance behavior. The results of our study merely suggest that reducing avoidance behavior also may lead to improved outcomes in terms of maladaptive cognitions and general symptoms of anxiety. Future studies should therefore test the robustness of our findings and ultimately test whether optimizing treatment to specifically reduce avoidance behavior also leads to better SAD outcomes overall.
Methodological Considerations
As mentioned in the introduction we have tried to address some typical methodological challenges associated with these kind of studies. Our findings underscore the importance of separating within- and between-person effects. The traditional CLPM, which does not isolate these effects, yielded worse model fit and seemed to underestimate the longitudinal prediction of COG by AB compared to the better fitting RI-CLPM. Moreover, within the potential outcome framework (Rubin causal model (Rubin, Citation1974)), the cross-lagged estimates from the RI-CLPM (stationarity assumed) can be interpreted as average causal effects under a weaker identifiability assumption, which states that unobserved time-invariant confounders are accounted for after controlling for stable trait factors (Hamaker et al., Citation2015). However, the presence of time-varying confounders might still be an issue, and although the impact of depression was examined and a model was tested that accounts for time-varying influences that change linearly over time (LCM-SR model), the presence of non-linear influences cannot be excluded.
The present study used multiple indicators to measure AB and COG, which made it possible to account for measurement error. Although not reported in the results section, the RI-CLPM based on manifest scores would have led to considerable different results and conclusions (i.e. statistically significant standardized reciprocal effects; ≈.3 for the effect of AB on COG, and ≈.2 for the effect of COG on AB), which advocates the use of multiple indicators. It should be noted that models based on single-item constructs (or sum scores) can also account for measurement error but only after posing constraints that rely on assumptions that may not be tenable (Usami et al., Citation2019). In the context of the potential outcome framework, accounting for measurement error also aids to provide a stronger basis to infer causal effects (Usami et al., Citation2019).
Another issue that is typically ignored concerns discriminant validity. Given that multiple indicators per construct are available, the present study showed that a bi-factor framework can be used to assess discriminant validity of the included measures of interest. Without discriminant validity, it is difficult to interpret cross-lagged parameter estimates as it may be the case that most of the observed reliable variance is common and not specific (Rodriguez et al., Citation2016).
Non-response and attrition are common in treatment studies, and although most modern approaches to data analysis provide valid estimates under the assumption of MAR, it is important to conduct sensitivity analyses and learn how the estimates behave under MNAR conditions. The Diggle-Kenward selection model that was used is only one of several MNAR models that could have been tested. Pattern mixture models are obvious candidates for further exploration of the potential impact of MNAR (Enders, Citation2010), but this was considered beyond the scope of the present study.
Statistical power is a subject that has not been studied much for the CLPMs that were recently developed, but the few studies that did examine this issue suggested that the RI-CLPM may require large samples (>1500) to have enough statistical power to detect small cross-lagged effects (standardized effects >.10) (Barzeva et al., Citation2019; Masselink et al., Citation2018). Although our study stands out in terms of sample size compared to most of the CBT studies mentioned in the introduction, it should by no means be considered excessive. More research on this matter is much needed.
Strengths/Limitations
In addition to the methodological strengths mentioned above, it was also considered a strength that the study was carried out in a naturalistic treatment setting as this is associated with higher external validity. Naturally, there are several limitations that should be mentioned as well. Dedicated measures of AB and COG were not used, but instead 4 of 7 items of the avoidance behavior subscale from the SPIN-17 and 3 items from the SPCQ were selected to estimate the CLPMs. Future studies should examine their psychometric properties in greater depth. Although it’s likely that the 4- and 3-item versions would correlate highly with their respective full original scale, it’s possible that the abbreviated measures do not cover the full spectrum of AB and COG.
Other limitations to consider are related to optimal time lag and the stationarity assumption. It has been demonstrated that the length of the time lag can influence the cross-lagged regression coefficients (Dormann & Griffin, Citation2015). As such, it cannot be excluded that the cross-lagged associations observed in the present study were somewhat underestimated. It is known that the stationarity assumption only holds with constant time between occasions, but as shown in the methods section, the average time between measurement occasions did vary somewhat in the current study. This implies that even though we showed that the constrained model, which assumed stationarity, provided similar fit as the unconstrained model, the presented cross-lagged estimates in Tables II and III may be somewhat biased. Despite this, the constrained model was preferred to maximize statistical power. It is also a question whether the temporal relationships obtained at the studied time lag of one or more weeks generalize to concrete episodes of social anxiety, in which causality works at very small time lags.
Our sample consisted of clients with symptoms of SAD, not clinically diagnosed, who received CBT, delivered through both individual therapy and psychoeducational groups, for a relatively short period of time. This may limit the generalizability of our findings as there might be other processes relevant for clients clinically diagnosed with SAD, for other treatment models, and for longer treatment periods. Although this is a limitation, it should be noted that the potential group of clients who could benefit from CBT treatment in primary care is assumed large (Hewlett & Moran, Citation2014), and as such are the findings from the present study highly relevant.
Finally, it should be noted that we could only study a few of the variables proposed by SAD models, and inclusion of other variables could influence the relationships we found. For instance, the cognitive model of SAD (Clark & Wells, Citation1995) proposes that a patient’s exposure (non-avoidance) will affect cognitions and social anxiety only to the extent that he or she shifts attention from self-focus to an external focus and drops in-situation safety behaviors.
Conclusion
This study found support for avoidance behavior being a unidirectional predictor of cognitions independent from stable between-person differences in a CBT context among clients with symptoms of social anxiety. Furthermore, avoidance behavior, but not cognitions predicted general anxiety. The effects remained significant after controlling for depression. The findings illustrate the importance of separating within- and between-person effects. Targeting avoidance behavior for primary care clients that report symptoms of SAD may thus be vital for optimal effect of CBT for this group, and should be explored further in future randomized controlled trials. Notably, as the study was conducted in a real-life primary care setting and included a heterogeneous study population, the results might not be specific to SAD, but more general to individuals experiencing anxious distress, or even multiple anxiety disorders.
| Abbreviations | ||
| AB | = | avoidance behavior |
| AIC | = | Aiken information criterion |
| BIC | = | Bayesian information criterion |
| CBT | = | cognitive behavioral therapy |
| CFI | = | comparative fit index |
| COG | = | cognitions |
| CLPM | = | cross-lagged panel model |
| ECV | = | explained common variance |
| GAD-7 | = | Generalized Anxiety Disorder Scale-7 |
| IAPT | = | improving access to psychological therapies |
| LCM-SR | = | latent curve model with structured residuals |
| MAR | = | missing at random |
| MNAR | = | missing not at random |
| PMHC | = | prompt mental health care |
| RCT | = | randomized control trial |
| RI-CLPM | = | random intercept cross-lagged panel model |
| RMSEA | = | the root mean square error of approximation |
| SAD | = | social anxiety disorder |
| SPCQ | = | social probability and cost questionnaire |
| SD | = | standard deviation |
| SPIN | = | social phobia inventory |
| SRMR | = | standardized root mean square residual |
| TAU | = | treatment as usual |
Availability of Data and Material
The datasets generated and/or analyzed during the current study are not publicly available due to ethical restrictions and personal data protection but are available from the corresponding author on reasonable request.
Ethics Approval and Consent to Participate
The study was approved by the Regional Ethics Committee for Western Norway, which falls under the Norwegian Ministry of education and research (REK-vest no. 2015/885). All participants have signed an informed consent scheme.
Supplemental Material
Download MS Word (685.7 KB)Acknowledgements
We would like to thank the participants for taking part in the study. We also gratefully acknowledge the contribution from all therapists at the two sites for completing therapy documentation.
Supplemental Data
Supplemental data for this article can be accessed https://doi.org/10.1080/10503307.2021.1930243.
Additional information
Funding
References
- Aderka, I. M., McLean, C. P., Huppert, J. D., Davidson, J. R. T., & Foa, E. B. (2013). Fear, avoidance and physiological symptoms during cognitive-behavioral therapy for social anxiety disorder. Behaviour Research and Therapy, 51(7), 352–358. https://doi.org/https://doi.org/10.1016/j.brat.2013.03.007
- American Psychiatric Association. (2013). Diagnostic and Statistical Manual of Mental Disorders: Diagnostic and Statistical Manual of Mental Disorders (Fifth Edition). Arlington, VA: American Psychiatric Association.
- Antony, M. M., Coons, M. J., McCabe, R. E., Ashbaugh, A., & Swinson, R. P. (2006). Psychometric properties of the social phobia inventory: Further evaluation. Behaviour Research and Therapy, 44(8), 1177–1185. https://doi.org/https://doi.org/10.1016/j.brat.2005.08.013
- Barzeva, S. A., Richards, J. S., Meeus, W. H. J., & Oldehinkel, A. J. (2019). Social Withdrawal in Adolescence andEarly Adulthood: Measurement Issues, Normative Development, and DistinctTrajectories. J Abnorm Child Psychol, 47(5), 865–879.
- Browne, M. W., & Cudeck, R. (1993). Alternative ways of assessing model fit. In K. A. Bollen, & J. S. Long (Eds.), Testing structural equation models (pp. 136–162). Newbury Park, CA: Sage.
- Carpenter, J. K., Andrews, L. A., Witcraft, S. M., Powers, M. B., Smits, J. A. J., & Hofmann, S. G. (2018). Cognitive behavioral therapy for anxiety and related disorders: A meta-analysis of randomized placebo-controlled trials. Depression and Anxiety, 35(6), 502–514. https://doi.org/https://doi.org/10.1002/da.22728
- Chen, F. F. (2007). Sensitivity of goodness of fit indexes to lack of measurement invariance. Structural Equation Modeling: A Multidisciplinary Journal, 14(3), 464–504. https://doi.org/https://doi.org/10.1080/10705510701301834
- Clark, D. M., Layard, R., Smithies, R., Richards, D. A., Suckling, R., & Wright, B. (2009). Improving access to psychological therapy: Initial evaluation of two UK demonstration sites. Behaviour Research and Therapy, 47(11), 910–920. https://doi.org/https://doi.org/10.1016/j.brat.2009.07.010
- Clark, D. M., & Wells, A. (1995). A cognitive model of social phobia. In G. Heimberg, M. R. Liebowitz, D. A. Hope, & F. A. Schneier (Eds.), Social phobia: Diagnosis, assessment, and treatment (pp. 69–93). The Guilford Press.
- Connor, K. M., Davidson, J. R., Churchill, L. E., Sherwood, A., Foa, E., & Weisler, R. H. (2000). Psychometric properties of the Social Phobia Inventory (SPIN). New self-rating scale. British Journal of Psychiatry, 176(4), 379–386. https://doi.org/https://doi.org/10.1192/bjp.176.4.379
- Dormann, C., & Griffin, M. A. (2015). Optimal time lags in panel studies. Psychological Methods, 20(4), 489–505. https://doi.org/https://doi.org/10.1037/met0000041
- Eid, M., Geiser, C., Koch, T., & Heene, M. (2017). Anomalous results in G-factor models: Explanations and alternatives. Psychological Methods, 22(3), 541–562. https://doi.org/https://doi.org/10.1037/met0000083
- Enders, C. K. (2010). Applied missing data analysis. Guilford Press.
- Folkehelseinstituttet. (2018). Helsetilstanden i Norge 2018. [Public Health in Norway 2018].
- Gregory, B., Wong, Q. J. J., Marker, C. D., & Peters, L. (2018). Maladaptive self-beliefs during cognitive behavioural therapy for social anxiety disorder: A test of temporal precedence. Cognitive Therapy and Research, 42(3), 261–272. https://doi.org/https://doi.org/10.1007/s10608-017-9882-5
- Hamaker, E. L., Kuiper, R. M., & Grasman, R. P. (2015). A critique of the cross-lagged panel model. Psychological Methods, 20(1), 102–116. https://doi.org/https://doi.org/10.1037/a0038889
- Hans, E., & Hiller, W. (2013). A meta-analysis of nonrandomized effectiveness studies on outpatient cognitive behavioral therapy for adult anxiety disorders. Clinical Psychology Review, 33(8), 954–964. https://doi.org/https://doi.org/10.1016/j.cpr.2013.07.003
- Hay, S. I., Abajobir, A. A., Abate, K. H., Abbafati, C., Abbas, K. M., Abd-Allah, F., Abdulkader, R. S., Abdulle, A. M., Abebo, T. A., Abera, S. F., Aboyans, V., Abu-Raddad, L. J., Ackerman, I. N., Adedeji, I. A., Adetokunboh, O., Afshin, A., Aggarwal, R., Agrawal, S., Agrawal, A., … Murray, C. J. L. (2017). Global, regional, and national disability-adjusted life-years (DALYs) for 333 diseases and injuries and healthy life expectancy (HALE) for 195 countries and territories, 1990–2016: A systematic analysis for the global burden of disease study 2016. The Lancet, 390(10100), 1260–1344. https://doi.org/https://doi.org/10.1016/S0140-6736(17)32130-X
- Hayes, A., Hope, D. A., & Hayes, S. (2007). Towards an understanding of the process and mechanisms of change in cognitive behavioral therapy: Linking innovative methodology with fundamental questions. Clinical Psychology Review, 27(6), 679–681. https://doi.org/https://doi.org/10.1016/j.cpr.2007.01.006
- Hewlett, E., & Moran, V. (2014). OECD health policy studies: Making mental health count: The social and economic costs of neglecting mental health care. OECD Publishing.
- Hoffart, A., Borge, F.-M., & Clark, D. M. (2016). Within-person process-outcome relationships in residential cognitive and interpersonal psychotherapy for social anxiety disorder: A reanalysis using disaggregated data. Journal of Experimental Psychopathology, 7(4), 671–683. https://doi.org/https://doi.org/10.5127/jep.056116
- Hoffart, A., Borge, F.-M., Sexton, H., & Clark, D. M. (2009). Change processes in residential cognitive and interpersonal psychotherapy for social phobia: A process-outcome study. Behavior Therapy, 40(1), 10–22. https://doi.org/https://doi.org/10.1016/j.beth.2007.12.003
- Hofmann, S. G., Asnaani, A., Vonk, I. J. J., Sawyer, A. T., & Fang, A. (2012). The efficacy of cognitive behavioral therapy: A review of meta-analyses. Cognitive Therapy and Research, 36(5), 427–440. https://doi.org/https://doi.org/10.1007/s10608-012-9476-1
- Hofmann, S. G., & Smits, J. A. (2008). Cognitive-behavioral therapy for adult anxiety disorders: A meta-analysis of randomized placebo-controlled trials. The Journal of Clinical Psychiatry, 69(4), 621–632. https://doi.org/https://doi.org/10.4088/JCP.v69n0415
- Hu, L. T., & Bentler, P. M. (1999). Cutoff criteria for fit indexes in covariance structure analysis: Conventional criteria versus new alternatives. Structural Equation Modeling: A Multidisciplinary Journal, 6(1), 1–55. https://doi.org/https://doi.org/10.1080/10705519909540118
- Huppert, J. D., Kivity, Y., Cohen, L., Strauss, A. Y., Elizur, Y., & Weiss, M. (2018). A pilot randomized clinical trial of cognitive behavioral therapy versus attentional bias modification for social anxiety disorder: An examination of outcomes and theory-based mechanisms. Journal of Anxiety Disorders, 59, 1–9. https://doi.org/https://doi.org/10.1016/j.janxdis.2018.08.002
- The IAPT data handbook version 2. (2011). NA: Department of Health.
- Johnson, S. U., Hoffart, A., Nordahl, H. M., Ulvenes, P. G., Vrabel, K., & Wampold, B. E. (2018). Metacognition and cognition in inpatient MCT and CBT for comorbid anxiety disorders: A study of within-person effects. Journal of Counseling Psychology, 65(1), 86–97. https://doi.org/https://doi.org/10.1037/cou0000226
- Johnson, S. U., Hoffart, A., Nordahl, H. M., & Wampold, B. E. (2017). Metacognitive therapy versus disorder-specific CBT for comorbid anxiety disorders: A randomized controlled trial. Journal of Anxiety Disorders, 50, 103–112. https://doi.org/https://doi.org/10.1016/j.janxdis.2017.06.004
- Kass, R. E., & Raftery, A. E. (1995). Bayes factors. Journal of the American Statistical Association, 90(430), 773–795. https://doi.org/https://doi.org/10.1080/01621459.1995.10476572
- Knapstad, M., Lervik, L. V., Saether, S. M. M., Aaro, L. E., & Smith, O. R. F. (2020). Effectiveness of prompt mental health care, the Norwegian version of improving access to psychological therapies: A randomized controlled trial. Psychotherapy and Psychosomatics, 89(2), 90–105. https://doi.org/https://doi.org/10.1159/000504453
- Knapstad, M., Nordgreen, T., & Smith, O. R. F. (2018). Prompt mental health care, the Norwegian version of IAPT: Clinical outcomes and predictors of change in a multicenter cohort study. BMC Psychiatry, 18(1), Article 260. https://doi.org/https://doi.org/10.1186/s12888-018-1838-0
- Kroenke, K., Spitzer, R. L., & Williams, J. B. (2001). The PHQ-9: Validity of a brief depression severity measure. Journal of General Internal Medicine, 16(9), 606–613. https://doi.org/https://doi.org/10.1046/j.1525-1497.2001.016009606.x
- Kroenke, K., Spitzer, R. L., Williams, J. B., & Lowe, B. (2010). The patient Health Questionnaire somatic, anxiety, and depressive symptom scales: A systematic review. General Hospital Psychiatry, 32(4), 345–359. https://doi.org/https://doi.org/10.1016/j.genhosppsych.2010.03.006
- Kroenke, K., Spitzer, R. L., Williams, J. B., Monahan, P. O., & Löwe, B. (2007). Anxiety disorders in primary care: Prevalence, impairment, comorbidity, and detection. Annals of Internal Medicine, 146(5), 317–325. https://doi.org/https://doi.org/10.7326/0003-4819-146-5-200703060-00004
- Kroenke, K., Wu, J., Yu, Z., Bair, M. J., Kean, J., Stump, T., & Monahan, P. O. (2016). Patient Health Questionnaire anxiety and depression scale: Initial validation in three clinical trials. Psychosomatic Medicine, 78(6), 716–727. https://doi.org/https://doi.org/10.1097/PSY.0000000000000322
- Kröger, H., Hoffmann, R., & Pakpahan, E. (2016). Consequences of measurement error for inference in cross-lagged panel design—the example of the reciprocal causal relationship between subjective health and socio-economic status. Journal of the Royal Statistical Society: Series A (Statistics in Society), 179(2), 607–628. https://doi.org/https://doi.org/10.1111/rssa.12129
- Lervik, L. V., Knapstad, M., & Smith, O. R. F. (2020). Process evaluation of Prompt Mental Health Care (PMHC): The Norwegian version of improving access to psychological therapies. BMC Health Services Research, 20(1), Article 437. https://doi.org/https://doi.org/10.1186/s12913-020-05311-5
- Longmore, R. J., & Worrell, M. (2007). Do we need to challenge thoughts in cognitive behavior therapy? Clinical Psychology Review, 27(2), 173–187. https://doi.org/https://doi.org/10.1016/j.cpr.2006.08.001
- Masselink, M., Van Roekel, E., Hankin, B. L., Keijsers, L., Lodder, G. M. A., Vanhalst, J., Verhagen, M., Young, J. F., & Oldehinkel, A. J. (2018). The longitudinal association between self-esteem and depressive symptoms in adolescents: Separating between-person effects from within-person effects. European Journal of Personality, 32(6), 653–671. https://doi.org/https://doi.org/10.1002/per.2179
- McManus, F., Clark, D. M., & Hackmann, A. (2000). Specificity of cognitive biases in social phobia and their role in recovery. Behavioural and Cognitive Psychotherapy, 28(3), 201–209. https://doi.org/https://doi.org/10.1017/S1352465800003015
- Moscovitch, D. A., Hofmann, S. G., Suvak, M. K., & In-Albon, T. (2005). Mediation of changes in anxiety and depression during treatment of social phobia. Journal of Consulting and Clinical Psychology, 73(5), 945–952. https://doi.org/https://doi.org/10.1037/0022-006X.73.5.945
- Norton, P. J., & Price, E. C. (2007). A meta-analytic review of adult cognitive-behavioral treatment outcome across the anxiety disorders. Journal of Nervous & Mental Disease, 195(6), 521–531. https://doi.org/https://doi.org/10.1097/01.nmd.0000253843.70149.9a
- Ougrin, D. (2011). Efficacy of exposure versus cognitive therapy in anxiety disorders: Systematic review and meta-analysis. BMC Psychiatry, 11(1), Article 200. https://doi.org/https://doi.org/10.1186/1471-244X-11-200
- Podina, I. R., Visla, A., Fodor, L. A., & Fluckiger, C. (2019). Is there a sleeper effect of exposure-based vs. cognitive-only intervention for anxiety disorders? A longitudinal multilevel meta-analysis. Clinical Psychology Review, 73, Article 101774. https://doi.org/https://doi.org/10.1016/j.cpr.2019.101774
- Powers, M. B., de Kleine, R. A., & Smits, J. A. (2017). Core mechanisms of cognitive behavioral therapy for anxiety and depression: A review. Psychiatric Clinics of North America, 40(4), 611–623.
- Remes, O., Brayne, C., van der Linde, R., & Lafortune, L. (2016). A systematic review of reviews on the prevalence of anxiety disorders in adult populations. Brain and Behavior, 6(7), Article e00497. https://doi.org/https://doi.org/10.1002/brb3.497
- Rodriguez, A., Reise, S. P., & Haviland, M. G. (2016). Evaluating bifactor models: Calculating and interpreting statistical indices. Psychological Methods, 21(2), 137–150. https://doi.org/https://doi.org/10.1037/met0000045
- Rubin, D. B. (1974). Estimating causal effects of treatments in randomized and nonrandomized studies. Journal of Educational Psychology, 66(5), 688–701. https://doi.org/https://doi.org/10.1037/h0037350
- Santoft, F., Salomonsson, S., Hesser, H., Lindsäter, E., Ljótsson, B., Lekander, M., Kecklund, G., Öst, L.-G., & Hedman-Lagerlöf, E. (2019). Processes in cognitive behavior therapy for social anxiety disorder: Predicting subsequent symptom change. Journal of Anxiety Disorders, 67, Article 102118. https://doi.org/https://doi.org/10.1016/j.janxdis.2019.102118
- Schuurman, N. K., Ferrer, E., de Boer-Sonnenschein, M., & Hamaker, E. L. (2016). How to compare cross-lagged associations in a multilevel autoregressive model. Psychological Methods, 21(2), 206–221. https://doi.org/https://doi.org/10.1037/met0000062
- Smits, J. A. J., Julian, K., Rosenfield, D., & Powers, M. B. (2012). Threat reappraisal as a mediator of symptom change in cognitive-behavioral treatment of anxiety disorders: A systematic review. Journal of Consulting and Clinical Psychology, 80(4), 624–635. https://doi.org/https://doi.org/10.1037/a0028957
- Spitzer, R. L., Kroenke, K., Williams, J. B., & Löwe, B. (2006). A brief measure for assessing generalized anxiety disorder: The GAD-7. Archives of Internal Medicine, 166(10), 1092–1097. https://doi.org/https://doi.org/10.1001/archinte.166.10.1092
- Stein, D. J., Lim, C. C. W., Roest, A. M., de Jonge, P., Aguilar-Gaxiola, S., Al-Hamzawi, A., Alonso, J., Benjet, C., Bromet, E. J., Bruffaerts, R., de Girolamo, G., Florescu, S., Gureje, O., Haro, J. M., Harris, M. G., He, Y., Hinkov, H., Horiguchi, I., Hu, C., … Scott, K. M. (2017). The cross-national epidemiology of social anxiety disorder: Data from the world mental health survey initiative. BMC Medicine, 15(1), Article 143. https://doi.org/https://doi.org/10.1186/s12916-017-0889-2
- Stuhldreher, N., Leibing, E., Leichsenring, F., Beutel, M. E., Herpertz, S., Hoyer, J., Konnopka, A., Salzer, S., Strauss, B., Wiltink, J., & Konig, H. H. (2014). The costs of social anxiety disorder: The role of symptom severity and comorbidities. Journal of Affective Disorders, 165, 87–94. https://doi.org/https://doi.org/10.1016/j.jad.2014.04.039
- Usami, S., Murayama, K., & Hamaker, E. L. (2019). A unified framework of longitudinal models to examine reciprocal relations. Psychological Methods, 24(5), 637–657. https://doi.org/https://doi.org/10.1037/met0000210