
Abstract
Objective: There are considerable differences in how eating disorder (ED) patients respond to treatment. This study aimed to identify change trajectories of mental health during treatment. Method: Longitudinal data of 442 patients was used with five time points during a year of outpatient treatment. ED psychopathology and well-being were used as primary measures. A series of latent growth mixture models were applied to model trajectories of change. Results: Three latent classes were found for ED psychopathology and well-being. For ED psychopathology, a high baseline severity and slow recovery class (55.9% of the patients), a high baseline severity followed by a substantial recovery class (19.9%) and a moderate baseline severity and no significant recovery class (24.2%) were found. For well-being, a low baseline followed by a slow growth class (44.6%), a low baseline and substantial growth class (9.5%) and a moderate and stable well-being class (45.9%) was found. General psychopathology, early symptom change, hope for recovery, intrinsic motivation and the ED type were predictive of class membership in either ED psychopathology or well-being. Conclusions: This study shows variability in ED psychopathology and well-being change trajectories, modelled in meaningful latent recovery classes. These results may have clinical implications, such as adjusting patients’ treatment based on change trajectories.
Clinical or methodological significance of this article: This study shows that data modelling can help distinguish common change trajectories and related background characteristics between patients during treatment. Providing data models in daily practice may help clinicians intervene or adjust treatment during the early phases.
Psychological therapies are strongly recommended in the treatment of eating disorders (EDs) (Hay et al., Citation2014). However, a substantial portion of patients does not benefit from treatments (Linardon et al., Citation2017; Murray et al., Citation2018). Patients who receive treatment respond differently in terms of symptom changes (Melchior et al., Citation2016). It is highly relevant to detect these different change trajectories because they are related to treatment outcomes (Castonguay et al., Citation2013; Melchior et al., Citation2016). Change trajectories can be investigated by defining (a priori) classifications or by exploratory modelling of the data. A disadvantage of defining classifications a priori is that it may unintentionally discount other response patterns relevant to treatment outcomes (Espel-Huynh et al., Citation2020). Methods for exploratory modelling of change allow distinguishing classes of patients with similar change trajectories during treatment, which may help identify and improve treatments for specific subgroups of patients (Muthén & Muthén, Citation2000; Preacher et al., Citation2008; Uher et al., Citation2010). Studies show clinically relevant patterns of change in body weight in AN (Berona et al., Citation2018; Jennings et al., Citation2017; Makhzoumi et al., Citation2017), binge eating in BED (Hilbert et al., Citation2019), and overall ED pathology in a transdiagnostic sample (Espel-Huynh et al., Citation2020). In a study by Espel-Huyn and colleagues (2020), ED pathology change trajectories during outpatient treatment were modelled. Three latent classes emerged; a gradual response, a rapid response and a static response class with different baseline levels. They also found differences in clinical characteristics between the classes. It is not clear whether meaningful change trajectories of overall ED pathology can also be modelled in outpatient settings, which most ED patients follow. In addition, researchers have suggested that the assessment of treatment response should include symptomatology and levels of well-being (Fava & Guidi, Citation2020; Trompetter et al., Citation2017). Well-being is considered an essential aspect of mental health (Bohlmeijer et al., Citation2012; Deci & Ryan, Citation2008; Jahoda, Citation1958; Keyes, Citation2002; Ryff & Keyes, Citation1995; Ryff & Singer, Citation1996; World Health Organization, Citation2005). An additional argument to consider well-being as a measure of treatment response comes from the patient perspective on recovery (de Vos et al., Citation2017; Pettersen & Rosenvinge, Citation2002; Slof-Op ‘t Landt et al., Citation2019; Wetzler et al., Citation2020). A systematic review and qualitative meta-analysis showed that individuals who have recovered from an ED indicate several well-being dimensions, such as self-acceptance, positive relationships with others, autonomy and personal growth, as necessary for recovery as symptom remission (de Vos et al., Citation2017), and patients with EDs report lower levels compared to the general population (de Vos et al., Citation2018). Also, the correlation between ED psychopathology and well-being was weak in a representative sample of ED patients, further substantiating the need to measure both separately as aspects of mental health (de Vos et al., Citation2018).
To conclude, exploratory modelling provides knowledge about change during treatment. Studies show the potential value of exploring interindividual change and associated patient characteristics. Building on Espel-Huyn and colleagues (Citation2020) work, this study aimed to identify latent classes of recovery trajectories for ED psychopathology and well-being during ED outpatient treatment in a transdiagnostic sample. The following research questions were addressed: 1) which latent classes for ED psychopathology and well-being can be identified with exploratory modelling of observational data, and 2) are patient characteristics associated with class membership?
Method
Design and Participants
A naturalistic longitudinal study design was used. Data from 12 months of outpatient treatment were collected in a specialized ED treatment centre in the Netherlands. Questionnaires were administered at baseline and subsequently every three months, resulting in five measurements. The data collection took place between March 2015 and August 2018. Outpatient treatment was given in weekly sessions consisting of psycho-education, food management, cognitive behavioural therapy and insight-oriented psychotherapy. For patients with AN, weight improvement was also part of the treatment, and weight management for patients BED with morbid obesity. Relationships and family functioning were also addressed in therapy. There was no pre-fixed time frame for the treatment duration. Treatment progress was evaluated by a multidisciplinary team consisting of a psychiatrist, psychologist, dietician, and family therapist. The decision to end treatment was made by the clinician in collaboration with the patient and the multidisciplinary team. The average treatment duration within this treatment centre was in the last years around two years, mainly also because many patients have been treated before without meaningful improvements. Treatments were fully imbursed by the Dutch national health insurers conform to the obligatory health care system.
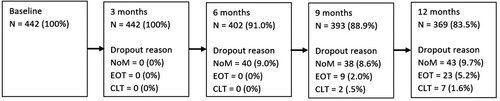
The inclusion criteria for this study were patients with a) a minimum age of 16 years, b) a DSM5 ED diagnosis at the start of treatment diagnosed by a psychiatrist, c) a minimum of 6 months of treatment, d) at least the baseline measurement and two of the other four measurements were filled out. Patients were informed about the aims of this study and signed an informed consent stating that they could at any point terminate the possibility of including their data in this study. This study was part of a comprehensive study investigating psychopathology and well-being in eating disorder patients from different perspectives, see, for instance (de Vos et al., Citation2018). The Ethics Committee of the University of Twente approved the study protocol (registration number BCE15484). In total, 679 patients who started treatment were screened, and 442 patients were included in the study. Two-hundred-and-thirty-seven patients were excluded due to not signing the informed consent, missing the baseline measure, or two or more post-baseline data points. The dropout at each time point was 0% at T2, 9% (N = 40) at T3, 11% (N = 49) at T4 and 17% (N = 73) at T5. Information about the dropout reasons at each time point can be found in . The end of treatment before 12 months was registered in 30 patients (6.8%).
Figure 1. Information about missing measurements and dropout of patients during the study.
Note: NoM = no measurement at time point, patient has not filled in the questionnaire; EOT = no measurement due to end of treatment occurring after the previous time point; CLT = patient was referred to clinical treatment and outpatient measurements were stopped.
Assessments
The following characteristics were collected during the intake assessment; ED duration, age at the start of the ED, BMI (kg/m2), treatment history, and co-morbidity. The original 36-item Eating Disorder Examination Questionnaire (EDE-Q) was used for the repeated measures (Fairburn & Beglin, Citation1994). The global scale has 22 items, is considered a valid index of the general level of ED psychopathology (EDP), and shows good psychometric properties (Aardoom et al., Citation2012). The frequency of symptoms in the last 28 days is rated, using a 7-point Likert scale ranging from 0 “not one day” to 6 “every day”. An example item is: “on how many of the past 28 days have you had a definite desire to have a totally flat stomach?”. The internal consistency at each time point was T1 = .92, T2 = .92, T3 = .94, T4 = .95, and T5 = .95. Lower scores indicate lower EDP. The Mental Health Continuum Short Form (MHC-SF) was used to measure well-being (WB). The MHC-SF measures emotional, psychological and social WB and gives an overall impression (Lamers et al., Citation2011). The MHC-SF has good convergent and discriminant validity and has 14 items, rated on a six-point Likert scale, ranging from 0 “never” to 5 “always”. An example item is: “during the past month, how often did you feel interested in life?”. The internal consistency at each time point for the total WB scale was T1 = .90. T2 = .91, T3 = .93, T4 = .93, T5 = .93. Higher scores indicate higher well-being. General psychopathology was measured with the Symptomatic Distress scale of the Outcome Questionnaire (OQ-45) (Jong et al., Citation2008). The internal consistency was .91. Lower scores are indicative of lower psychopathology.
After the first three months of treatment, clinicians were asked to reflect on several patient characteristics that may be associated with treatment response. A panel group consisting of three clinicians and three former patients found consensus on several characteristics. These questions were: intrinsic motivation for treatment and recovery, hope for recovery, capacity to solve problems, resilience, insight into the illness, constructive family functioning and meaningful daily functioning. The outcomes were used to develop a questionnaire with items rated on a four-point Likert scale, ranging from 0 “low” to 4 “high”. An example of a checklist item is “The (internal) motivation (willingness to change) of the patient is?” Early change in treatment was based on the reliable change score of the EDE-Q global score, measured as the score at three months minus the score at the start of treatment divided by the standard error of measurement, calculated with the internal consistency and SD of this sample (Jacobson & Truax, Citation1991).
Analysis
Pearson correlations between EDP and WB were −.35, p < .01 (start of treatment), −.42, p < .01 (3 months), −.46, p < .01 (6 months), −.53, p < .01 (9 months), and −.55, p < .01 (12 months). An overview of the number of patients assigned to a combination of the EDP and WB classes is provided in of the supplements.
Table 1. Model fit indices: Latent growth mixture modelling of eating disorder psychopathology and well-being trajectories.
Exploring for Latent Classes (Recovery Groups)
Analyses were conducted using MPlus version 8 (Muthén & Muthén, Citationn.d.). A series of latent growth mixture models (LGMM) were applied to model interindividual trajectories of change. LGMM assumes that patterns of observed change trajectories are based on underlying processes, which can be estimated as a series of growth parameters (Muthén & Muthén, Citationn.d.). Growth parameters, such as shape (linear, quadratic), baseline scores (intercept) and rate of change (slope), are specified to best approximate longitudinal patterns from the observed data. Other advantages are that LGMM permits missing data without causing complications, and no data imputation is needed. This leads to enhanced statistical power compared to traditional types of longitudinal analysis (Curran et al., Citation2010; Preacher et al., Citation2008). Basic LGMM requires assumptions, such as normally distributed scores, and missing values must be missing (completely) at random (Curran et al., Citation2010). The normal distribution was checked by assessing the skewness and kurtosis, and missingness was checked with Little’s MCAR test (Little, Citation1998). The longitudinal measures (i.e. mean scores on the EDE-Q and MHC-SF) were normally distributed (highest skewness value = −.62, EDE-Q at start treatment, highest kurtosis value = −.95 EDE-Q at T5). Little’s MCAR test suggests that data is missing (completely) at random for the longitudinal EDP χ²(24) 27.831, p > .05, and well-being measures χ²(24) 34.944, p > .05. In addition, robust maximum likelihood estimator (MLR) was used to address missing data (Byrne, Citation2012). MLR makes use of all available data points. The sample size in this study was adequate for detecting classes, with the last measurement (time point 5) showing the lowest sample size (N = 369), which was above the minimum suggested sample size of 200 (Byrne, Citation2012). Classes were tested with the following free growth parameters; mean and variance of the intercept, slope and the quadratic effect, the covariances and the residual variances of the measurement. First, baseline models with linear and quadratic effects were tested. Then we sequentially tested a new model (one more class) against the former model. The overall improvement of fit of each model was assessed by examining Akaike Information Criterion (AIC), Bayesian Information Criterion (BIC), the sample size-adjusted information criterion (aBIC), the log-likelihood and the entropy. The entropy is a measure of classification quality (values near .1 suggest optimal classification quality, while values near 0 suggest no classification quality) (Nylund et al., Citation2007). To decide on the final number of classes, the Vuong-Lo-Mendell-Rubin log-likelihood ratio test (VLMR LRT) and adjusted Lo-Mendell-Rubin log-likelihood ratio test (LMR LRT) were used (Asparouhov & Muthén, Citation2012; Nylund et al., Citation2007). A non-significant VLMR LRT and LMR LRT was considered the primary indicator for rejecting a class solution and accepting the most parsimonious model (Asparouhov & Muthén, Citation2012; Jung & Wickrama, Citation2008; Nylund et al., Citation2007). Class membership probability was estimated for each patient and averaged for each class. A class membership probability greater than .70 to .80 is considered an indicator that the class represents individuals with similar patterns of change and discriminates between individuals with distinct patterns of change (Andruff et al., Citation2009).
Patient Characteristics and Class Membership
Outliers and normality were tested via visual inspection of boxplots and histograms, and violations of the homogeneity of variances were tested with Levene’s test. ANOVA analysis with Tukey’s post hoc tests, or Welch’s ANOVA with Games-Howell post hoc tests when equal variances were not assumed, was used for continuous variables to examine differences in patient characteristics between the classes. For categorical variables, chi-square tests were used. Statistically significant findings suggest that specific patient characteristics are more present in certain classes and were included in a forward stepwise multivariate multinomial logistic regression model to assess the predictive value for class membership. Odds ratios (ORs) with 95% confidence intervals (CIs) were calculated. The linearity of the continuous predictor variables with the logit of the dependent variables was assessed with the Box-Tidwell procedure (Box & Tidwell, Citation1962). All continuous predictor variables were linearly related to the logit of the dependent variables, and there were no predictor variables with a correlation higher than .7 (multicollinearity). SPSS version 24.0 was used for all ANOVA and regression analyses (IBM Statistics).
Results
Of the 442 patients who participated in this study, 141 were diagnosed with AN (31.9%), 98 with BN (22.2%), 39 with BED (8.8%) and 164 with OSFED (37.1%). The average age was 27.01 years (SD = 9.71), and 98.6% (N = 436) were female. The average start age of the ED was 16.10 years (SD = 4.93), and the duration was 11.07 years (SD = 9.96). See for an overview of all patient characteristics.
Model Fit
The fit indices of the LGMMs for EDP and WB can be found in . First, baseline models with linear and non-linear effects were tested. The EDP model with a quadratic effect showed the lowest AIC, BIC and aBIC values compared to the linear model and was chosen as the baseline model for EDP. The WB baseline model with a linear effect showed a minor higher AIC, with the lowest BIC and aBIC value compared to the quadratic model. A linear model was therefore chosen as the baseline model for WB. Then we sequentially tested a new model (one more class) against the former model. A two-class solution improved all fit indices and significantly improved the log-likelihood tests compared to a one-class solution for EDP and WB. A three-class solution also improved all fit indices for EDP and WB and significantly improved the log-likelihood tests compared to a two-class solution. Most fit indices did not further improve between a three and four-class solution for EDP. There was no significant improvement on the log-likelihood difference tests with a four-class solution compared to three classes (VLMR LRT = 19.802 [4], p > .05, LMR LRT = 19.021 [4], p > .05). We, therefore, considered a three-class solution as the most parsimonious model explaining the observed data for EDP. For WB, also a three-class solution was considered the most parsimonious model with no significant differences on the log-likelihood test between a three and four-class solution (VLMR LRT = 13.774 [3], p > .05, LMR LRT = 13.060 [3], p > .05).
summarises the number of patients assigned to each class, the average class membership probability, the intercept, slope and quadratic effect. and provide an overview of the mean class change trajectories for EDP and WB compared to community norms ().
Figure 2. Estimated means with error bands of the eating disorder psychopathology classes.
Note. The cut-off score for the general population was based on the EDE-Q mean score of the Dutch general population (Aardoom et al., Citation2012) + 1 SD. Error bands are based on the SD.
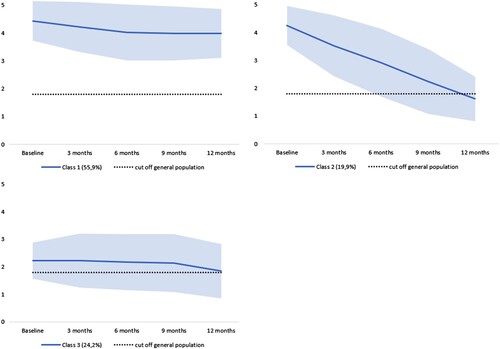
Figure 3. Estimated means and error bands of the well-being classes.
Note. The cut-off score for the general population was based on the MHC-SF mean score of the general population (Lamers et al., Citation2011). Error bands are based on the SD.
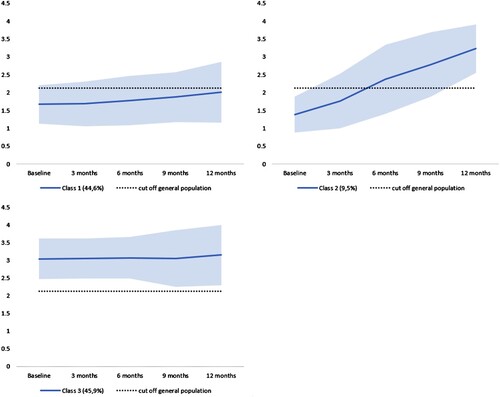
Table 2. Latent class characteristics for eating disorder psychopathology and well-being.
Change Trajectory Classes
All EDP classes showed adequate average class membership probability (>.8). The first class (55.9%) is labelled as the high baseline EDP, slow recovery class with a high level of EDP symptoms at the start of treatment (M = 4.43, SE = 0.07, p < .001), a low negative slope of change (M = −0.27, SE = 0.05, p < .001) and a quadratic effect (M = 0.04, SE = 0.01, p < .001). The second class (19.9%) is labeled as the high baseline EDP, substantial recovery class, with a high EDP baseline level (M = 4.25, SE = 0.14, p < .001), a steep slope of change (M = −0.70, SE = 0.13, p < .001) and no quadratic effect (M = 0.01, SE = 0.03, p = .78). The third class (24,2%) is labeled as the moderate baseline EDP, no recovery class, with a moderate EDP baseline level (M = 2.22, SE = 0.11, p < .001), no significant slope of change (M = 0.05, SE = 0.09, p = .59) and no quadratic effect (M = −0.04, SE = 0.02, p = .08). The WB average class probability was adequate (>.8) for class 1 and 3 and moderate (>.7) for class 2. Class 1 (44.6%) is labeled as the low baseline WB, slow growth class, with a low WB baseline level (M = 1.63, SE = .09, p < .001) and a low slope of change (M = .09, SE = .03, p < .001). Class 2 (9.5%) is labeled as the low baseline low baseline WB, substantial growth class with a low baseline level of WB (M = 1.35, SE = .13, p < .001) and a steep slope of change (M = .48, SE = .05, p < .001). The last class (45,9%) is labelled as the moderate baseline WB, stable over time class with a moderate level of baseline WB (M = 3.03, SE = .07, p < .001) scoring similar within community norms, and which remains stable over time (M = .03, SE = .02, p = .2).
Predicting Class Membership
Information about statistical significant differences in patient characteristics between the latent classes can be found in . The first classes (high baseline EDP, slow recovery and low baseline WB, slow growth) were used as the reference category for the multinomial regressions. Adding the predictors for EDP class membership to a model containing the intercept only significantly improved the fit between model and data, χ² (8, N = 332) = 94.69, Nagelkerke R2 = .29, p < .001. Early change on EDP (β = 1.26, SE = 0.36, p < .001, OR = 3.52, 95% CI [1.74, 7.15]) and hope for recovery (β = 0.84, SE = 0.23, p < .001, OR = 2.32, 95% CI [1.49, 3.61]) were unique contributions associated with a higher likelihood to be assigned to class 2 high baseline EDP, substantial recovery class membership. Not having BN (β = −1.00, SE = 0.45, p < .05, OR = 0.37, 95% CI [0.15, 0.89]) and lower levels of general psychopathology (β = −0.07, SE = 0.01, p < .001, OR = 0.93, 95% CI [0.91, 0.96]) were associated with a smaller likelihood to be assigned to class 3 low baseline EDP, no recovery. For WB, adding the predictors for class membership to a model containing the intercept only significantly improved the fit, χ² (6, N = 350) = 158.54, Nagelkerke R2 = .44, p < .001. Predictors with a unique contribution for the moderate WB, stable over time class membership were lower general psychopathology (β = −0.12, SE = 0.01, p < .001, OR = 0.88, 95% CI [0.86, 0.92]) and higher intrinsic motivation (β = 0.54, SE = 0.20, p < .01, OR = 1.71, 95% CI [1.15–2.55]). Higher intrinsic motivation also predicted the low baseline WB, substantial growth class membership (β = 0.68, SE = 0.31, p < .05, OR = 1.98, 95% CI [1.07–3.36]).
Table 3. Characteristics of patients overall and for each class.
Discussion
A central aim of psychotherapy research is to understand mental health change during treatment (Melchior et al., Citation2016). This study modelled intraindividual change trajectories of eating disorder psychopathology (EDP) and well-being (WB). Variability in change trajectories between patients during outpatient treatment could be explained with three distinct latent EDP and WB classes.
Understanding Change Trajectories of Eating Disorder Psychopathology
Most of the patients (55.9%) were assigned to the high baseline EDP, slow recovery group. These patients exhibited a modest treatment response and still reported high levels of EDP after a year of outpatient treatment. A relatively small group (19.9%) exhibited a substantial treatment response and benefited in terms of improving from a severe ED towards functioning comparable with community norms (Aardoom et al., Citation2012). The last class (24.2%) did not exhibit severe EDP levels but did not improve during treatment.
Espel-Huyn and colleagues (Citation2020) focused on trajectories of overall EDP change within a residential inpatient setting. They found three similar patterns of change, despite the different treatment setting and substantially shorter treatment duration. A class with a gradual response, a class with a rapid response, both with high baseline levels, and a class with moderate baseline levels and static response (Espel-Huynh et al., Citation2020). Also, the proportions of patients divided over the classes were nearly similar. This may suggest that EDP class membership, and subsequently, individual recovery trajectories, are not necessarily the result of a specific treatment approach or setting (inpatient, residential or outpatient).
Our results show clear variability in individual EDP change trajectories, which can be modelled in distinct classes. A substantial group of patients was assigned to the class with high baseline EDP symptoms and slow recovery. This corresponds with effectiveness studies showing only modest or no clinical improvements in a substantial proportion of patients (Linardon & Wade, Citation2018; Murray et al., Citation2018). Patients assigned to this class still report substantial symptom levels after 12 months of treatment. Do these patients need a longer treatment duration to promote further changes, or can the rate of change be enhanced with a different treatment setting or methodology? Considering the often similar outcomes across different treatment methods (Grenon et al., Citation2018) and comparing our results to Espel-Huyn and colleagues (Citation2020) study, different treatment settings or methods may arguably not lead to improved results. It is found that higher doses of ED inpatient and outpatient treatment or a longer duration do not lead to more favourable outcomes (Beintner & Jacobi, Citation2018; Bell et al., Citation2017). It has been noted that psychotherapy may not be simply reduced to a dose–response effect, and change may be substantially dependent on factors such as patient characteristics or other non-specific variables in treatment (Huibers & Cuijpers, Citation2015; Lambert & Asay, Citation1984; Wampold & Imel, Citation2015).
Patients assigned to the moderate baseline EDP and no recovery trajectory exhibit treatment resistance. Several reasons for treatment resistance have been postulated, such as neurobiological vulnerabilities, understanding EDs as coping mechanisms, the ego-syntonic nature of the disorder and the inability to see the dangers (Halmi, Citation2013). For instance, if ED symptoms are considered a coping strategy to regulate stress and emotions, it may lead to holding on to the coping behaviour. This may be particularly relevant for the moderate baseline EDP no recovery trajectory class because patients do not report severe ED levels and the detrimental effects of an ED may not (yet) weigh out the benefits in patients assigned to this class.
Predicting EDP Class Membership
Differences in patient characteristics further substantiated the validity of distinct latent classes of change trajectories. More specifically, not having BN and lower general psychopathology predicted assignment to the low baseline EDP, no recovery class. Early change and higher hope for recovery were predictive for assignment to the high baseline, substantial EDP recovery class, compared to the high baseline slow recovery class. These findings are in line with previous research showing that early change and general psychopathology are considered important predictors of treatment outcome (Chang et al., Citation2021; Hilbert et al., Citation2019; Linardon et al., Citation2016; Vall & Wade, Citation2015). This study also linked hope to EDP change, which aligns with previous qualitative research (Las Hayas et al., Citation2015).
Understanding Well-Being Change Trajectories
The WB change trajectories were also characterized by three classes with 1) a low baseline level, followed by a slow and gradual trajectory of growth, 2) a low baseline level, followed by a substantial and rapid trajectory of growth towards moderate WB, and 3) a moderate level of WB, which remained stable over time. For WB, only a small group with low levels at baseline (10%) improved well towards adequate well-being comparable with community norms (de Vos et al., Citation2018). Although treatment was not specifically focused on improving WB, these patients still benefited from treatment in terms of improved WB. Interestingly, most patients (46%) reported an adequate WB, comparable with community norms, which remained stable over time, despite having an ED. This may be explained by several mechanisms, such as patients not seeing the dangers, or assuming ED symptoms as coping mechanisms that enable patients to deal with stressors and emotions in daily life to experience adequate well-being (Halmi, Citation2013; Wagener & Much, Citation2010). Another large group (45%) reported low levels of WB with a slow growth trajectory. It may be warranted to focus on WB-related mental health domains for this group in treatment in addition to EDP. Transdiagnostic interventions focusing on WB have been developed and effectively improve well-being in a range of psychiatric disorders (Chakhssi et al., Citation2018; Fava et al., Citation2005).
Predicting Well-Being Class Membership
Lower general psychopathology was predictive for assignment to the moderate WB, stable over time class, compared to the low baseline WB slow growth class. Higher intrinsic motivation was predictive for assignment to the low baseline and substantial WB growth and the moderate WB, stable over time class. Interestingly, intrinsic motivation was not a predictor for EDP class membership, while it is considered an influential predictor for outcomes in the literature (Vall & Wade, Citation2015). Self-determination theory suggests it is promoted by focusing on universal needs, such as autonomy, competence and connection (Deci & Vansteenkiste, Citation2004). These universal needs are closely related to the concept of well-being. Vansteenkiste and colleagues (Citation2005) argue that the quality of motivation is reflected more by the degree of internalization of change rather than by the motivation to change and that interventions based on psychological need satisfaction may facilitate self-endorsed motivation in patients with EDs (Van Der Kaap-Deeder et al., Citation2014; Vansteenkiste et al., Citation2005).
Strengths and Limitations
A strength of this study was the adequate sample size to detect classes and the duration with repeated measures over a year of outpatient treatment in an ED sample. There were several limitations. This was a naturalistic study, meaning that the researchers had no control over the treatment setting, intensity and other differences which may have occurred during treatment, such as a change of therapist. These unknown factors may have influenced the results. In addition, 32 patients were already scoring below the cut-off of the general population at the start of treatment. Because they were referred for specialized treatment and diagnosed with an ED, we did not exclude these patients from the analyses as we could also have found classes with deteriorating trajectories of change. While the EDE-Q is considered a valid questionnaire for measuring ED pathology, it cannot substitute the Eating Disorder Examination (EDE) interview for determining a diagnosis (Wolk et al., Citation2005). For instance, it has been found that patients with AN may deny or distort the severity of their symptoms during intake (Wolk et al., Citation2005).
Although we tested for linear and quadratic (non-linear) effects, there are many ways in which non-linear patterns of change can be modelled (Grimm & Ram, Citation2009). There are novel methods that may be able to detect more complex non-linear effects that our model did not account for. It is therefore advised to cross-validate LGGM studies, which primarily deal with linear or quadratic effects, with other non-linear methods, such as cubic terms, the latent basis growth model, orthogonal polynomials or Sigmoid curves (Grimm & Ram, Citation2009; Mirman, Citation2016).
While a three-class solution was considered the most parsimonious, a four-class solution did perform slightly better on some metrics. The use of self-report instruments may have resulted in biases. Examining change with other measures in addition to self-report, such as clinician-reported, may further improve the validity of the results. Because we only included patients that have followed at least six months of treatment, results may not be generalizable to other ED patients, specifically who drop out of treatment early. At last, early change was measured after three months of treatment. However, in other studies, it is often measured within a shorter time frame, for instance, four weeks (Chang et al., Citation2021), and it may be argued whether our time frame can be considered a valid measure for early change.
Conclusions and Future Directions
Patients show differential trajectories of change during treatment, which can be explained in three distinct EDP and WB change classes. In addition, EDP and WB class membership was predicted by different patient characteristics. It is warranted to address both EDP and WB to promote overall mental health in treatment. Specific predictors for EDP class membership were ED type, general psychopathology, early change and hope for recovery. Predictors for WB class membership were general psychopathology and intrinsic motivation. Adjusting a treatment approach based on change trajectories and individual patient characteristics may foster recovery in patients with EDs and promote WB. However, adjusting individual treatments based on data modelling requires a high degree of model accuracy. Although predictive models for psychotherapy treatment progress are developing with novel machine learning techniques, they still lack adequate model accuracy to recommend clinicians in their treatment decisions (Taubitz et al., Citation2022). Therefore, repeating these kinds of (latent growth) studies and using more sophisticated (machine learning) methods to enhance early prediction accuracy is important. Also, validating these commonly found trajectories of change in other ED samples is warranted. On a practical note, however, clinicians may choose already to repeatedly measure EDP and WB (routine outcome monitoring) during outpatient treatment. If future research repeats and validates our model, clinicians may compare the change trajectories of their patients to common classes and related characteristics. This study shows, for instance, that when patients with high EDP baseline scores do not improve in the first three to six months, it becomes less probable that they will improve in the next three to six months during outpatient treatment. Clinicians may therefore monitor treatment regularly in practice to identify trajectories of change in individual patients to evaluate treatment progress and consider alternative strategies. New research should also examine the effects of applying personalized treatments and the predictive effects of EPD and WB class membership on (long-term) outcomes.
Supplemental Material
Download MS Word (14.3 KB)Disclosure Statement
No potential conflict of interest was reported by the author(s).
Data Availability
The data that support the findings of this study are available on request from the corresponding author. The data are not publicly available due to restrictions, e.g. containing information that could compromise the privacy of research participants.
Supplemental Data
Supplemental data for this article can be accessed online at https://doi.org/10.1080/10503307.2022.2139647.
References
- Aardoom, J. J., Dingemans, A. E., Slof Op’t Landt, M. C. T., & Van Furth, E. F. (2012). Norms and discriminative validity of the Eating Disorder Examination Questionnaire (EDE-Q). Eating Behaviors, 13(4), 305–309. https://doi.org/10.1016/j.eatbeh.2012.09.002
- Andruff, H., Carraro, N., Thompson, A., Gaudreau, P., & Louvet, B. (2009). Latent class growth modelling: A tutorial. Tutorials in Quantitative Methods for Psychology, 5(1), 11–24. https://doi.org/10.20982/tqmp.05.1.p011
- Asparouhov, T., & Muthén, B. O. (2012). Using Mplus TECH11 and TECH14 to test the number of latent classes. Mplus Web Notes, 14, 1–17.
- Beintner, I., & Jacobi, C. (2018). Are we overdosing treatment? Secondary findings from a study following women with bulimia nervosa after inpatient treatment. International Journal of Eating Disorders, 51(8), 899–905https://doi.org/10.1002/eat.22894.
- Bell, C., Waller, M. G., Shafran, R., & Delgadillo, J. (2017). Is there an optimal length of psychological treatment for eating disorder pathology? International Journal of Eating Disorders, 50(6), 687–692. https://doi.org/10.1002/eat.22660.
- Berona, J., Richmond, R., & Rienecke, R. D. (2018). Heterogeneous weight restoration trajectories during partial hospitalization treatment for anorexia nervosa. International Journal of Eating Disorders, 51(8), 914–920. https://doi.org/10.1002/eat.22922
- Bohlmeijer, E. T., Bolier, L., Westerhof, G. J., & Walburg, J. A. (2012). Handboek positieve psychologie [Handbook positive psychology]. Amsterdam: Uitgeverij Boom.
- Box, G. E. P., & Tidwell, P. W. (1962). Transformation of the independent variables. Technometrics, 4(4), 531–550. https://doi.org/10.1080/00401706.1962.10490038
- Byrne, B. M. (2012). Structural equation modeling with mplus: Basic concepts, applications, and programming. Taylor & Francis Group.
- Castonguay, L., Barkham, M., Lutz, W., & Mcaleavey, A. A. (2013). Practice-oriented research: Approaches and applications. In Bergin and Garfield's Handbook of Psychotherapy and Behavior change, 7th Edition (pp. 85 - 133). Hoboken: Wiley & Sons
- Chakhssi, F., Kraiss, J. T., Sommers-Spijkerman, M., & Bohlmeijer, E. T. (2018). The effect of positive psychology interventions on well-being and distress in clinical samples with psychiatric or somatic disorders: A systematic review and meta-analysis. BMC Psychiatry, 18(1), 211. https://doi.org/10.1186/s12888-018-1739-2.
- Chang, P. G. R. Y., Delgadillo, J., & Waller, G. (2021). Early response to psychological treatment for eating disorders: A systematic review and meta-analysis. Clinical Psychology Review, 86, 102032. https://doi.org/10.1016/j.cpr.2021.102032
- Curran, P. J., Obeidat, K., & Losardo, D. (2010). Twelve frequently asked questions about growth curve modeling. Journal of Cognition and Development, 11(2), 121–136. https://doi.org/10.1080/15248371003699969
- Deci, E. L., & Ryan, R. M. (2008). Hedonia, eudaimonia, and well-being: An introduction. Journal of Happiness Studies, 9(1), 1–11. https://doi.org/10.1007/s10902-006-9018-1
- Deci, E. L., & Vansteenkiste, M. (2004). Self-determination theory and basic need satisfaction: Understanding human development in positive psychology. Ricerche di Psicologia, Vol. 27, 17–34.
- de Vos, J. A., Lamarre, A., Radstaak, M., Bijkerk, C. A., Bohlmeijer, E. T., & Westerhof, G. J. (2017). Identifying fundamental criteria for eating disorder recovery: A systematic review and qualitative meta-analysis. Journal of Eating Disorders, 5(34), 1–14. https://doi.org/10.1186/s40337-017-0164-0
- de Vos, J. A., Radstaak, M., Bohlmeijer, E. T., & Westerhof, G. J. (2018). Having an Eating Disorder and still being able to flourish? Examination of pathological symptoms and well-being as two continua of mental health in a clinical sample. Frontiers in Psychology, 9(October), 2145. https://doi.org/10.3389/fpsyg.2018.02145
- Espel-Huynh, H. M., Zhang, F., Boswell, J. F., Thomas, J. G., Thompson-Brenner, H., Juarascio, A. S., & Lowe, M. R. (2020, August). Latent trajectories of eating disorder treatment response among female patients in residential care. International Journal of Eating Disorders, 1647–1656. https://doi.org/10.1002/eat.23369
- Fairburn, C. G., & Beglin, S. J. (1994). Assessment of eating disorders: Interview or self-report questionnaire? International Journal of Eating Disorders, 16(4), 363–370. https://doi.org/10.1002/1098-108X(199412)16:4<363::AIDEAT2260160405>3.0.CO;2-#
- Fava, G. A., & Guidi, J. (2020). The pursuit of euthymia. World Psychiatry, 19(1), 40–50. https://doi.org/10.1002/wps.20698
- Fava, G. A., Ruini, C., Rafanelli, C., Finos, L., Salmaso, L., Mangelli, L., & Sirigatti, S. (2005). Well-being therapy of generalized anxiety disorder. Psychotherapy and Psychosomatics, 74(1), 26–30. https://doi.org/10.1159/000082023
- Grenon, R., Carlucci, S., Brugnera, A., Hammond, N., Ivanova, I., Mcquaid, N., Tasca, G. A., Grenon, R., Carlucci, S., Brugnera, A., Schwartze, D., Hammond, N., Ivanova, I., Mcquaid, N., Proulx, G., & Tasca, G. A. (2018). Psychotherapy for eating disorders: A meta-analysis of direct comparisons. Psychotherapy Research, 29(0), 833–845. https://doi.org/10.1080/10503307.2018.1489162
- Grimm, K. J., & Ram, N. (2009). Nonlinear Growth Models in Mplus and SAS. Structural Equation Modeling: A Multidisciplinary Journal, 16(4), 676–701. https://doi.org/10.1080/10705510903206055
- Halmi, K. A. (2013). Perplexities of treatment resistence in eating disorders. BMC Psychiatry, 13(1), https://doi.org/10.1186/1471-244X-13-292
- Hay, P. J., Chinn, D., Forbes, D., Madden, S., Newton, R., Sugenor, L., Touyz, S., & Ward, W. (2014). Royal Australian and New Zealand College of Psychiatrists clinical practice guidelines for the treatment of eating disorders. Australian & New Zealand Journal of Psychiatry, 48(11), 1–62.
- Hilbert, A., Herpertz, S., Zipfel, S., Tuschen-Caffier, B., Friederich, H. C., Mayr, A., Crosby, R. D., & de Zwaan, M. (2019). Early change trajectories in cognitive-behavioral therapy for binge-eating disorder. Behavior Therapy, 50(1), 115–125. https://doi.org/10.1016/j.beth.2018.03.013
- Huibers, M. J. H., & Cuijpers, P. (2015). Common (Nonspecific) Factors in Psychotherapy. In The Encyclopedia of Clinical Psychology (pp. 1-6) https://doi.org/10.1002/9781118625392.wbecp272
- Jacobson, N., & Truax, P. (1991). Clinical significance: A statistical approach to defining meaningful change in psychotherapy research. Journal of Consulting and Clinical Psychology, 59(1), 12–19. https://doi.org/10.1037/10109-042
- Jahoda, M. (1958). Current concepts of positive mental health. Joint commission on mental health and illness monograph series (Vol. 1). Basic Books.
- Jennings, K. M., Gregas, M., & Wolfe, B. (2017). Trajectories of change in body weight during inpatient treatment for anorexia nervosa. Journal of the American Psychiatric Nurses Association, 306–313. https://doi.org/10.1177/1078390317726142.
- Jong, K. D., Nugter, M., Lambert, M., & Burlingame, G. (2008). Handleiding voor afname en scoring van de Outcome Questionnaire (OQ− 45.2) [Manual for administering and scoring of the Outcome Questionnaire]. In Salt Lake City, UT: OQ (pp. 1–22).
- Jung, T., & Wickrama, K. A. S. (2008). An introduction to latent class growth analysis and growth mixture modeling. Social and Personality Psychology Compass, 2(1), 302–317. https://doi.org/10.1111/j.1751-9004.2007.00054.x
- Keyes, C. L. M. (2002). The mental health continuum: From languishing to flourishing in life. Journal of Health and Social Behavior, 43(2), 207–222. https://doi.org/10.2307/3090197
- Lambert, M. J., & Asay, T. P. (1984). Patient characteristics and their relationship to psychotherapy outcome. In M. Hersen, L. Michelson, & A. S. Bellack (Eds.), Issues in psychotherapy research. Applied clinical psychology. Springer. https://doi.org/10.1007/978-1-4899-2283-0_10
- Lamers, S. M. A., Westerhof, G. J., Bohlmeijer, E. T., Ten Klooster, P. P. M., & Keyes, C. L. M. (2011). Evaluating the psychometric properties of the mental health Continuum-Short Form (MHC-SF). Journal of Clinical Psychology, 67(1), 99–110. https://doi.org/10.1002/jclp.20741
- Las Hayas, C. P., Padierna, J. A. M., Munoz, P. M. P., Agirre, M., Gomez Del Barrio, A. M. P., Beato-Fernandez, L. M., Calvete, E. P., Aguirre, M. M., Gomez Del Barrio, A. M. P., Beato-Fernandez, L. M., & Calvete, E. P. (2015). Resilience in eating disorders: A qualitative study. Women & Health, 56(November), 576–594. https://doi.org/10.1080/03630242.2015.1101744
- Linardon, J., Brennan, L., & de la Piedad Garcia, X. (2016). Rapid response to eating disorder treatment: A systematic review and meta-analysis. International journal of eating disorders, 49(10), 905–919. https://doi.org/10.1002/eat.22595.
- Linardon, J., Wade, T., de la Piedad Garcia, X., & Brennan, L. (2017, July). Psychotherapy for bulimia nervosa on symptoms of depression: A meta-analysis of randomized controlled trials. International Journal of Eating Disorders, 1124–1136. https://doi.org/10.1002/eat.22763
- Linardon, J., & Wade, T. D. (2018). How many individuals achieve symptom abstinence following psychological treatments for bulimia nervosa? A meta-analytic review. International journal of eating disorders, 51(4), 287–294. https://doi.org/10.1002/eat.22838.
- Little, R. J. A. (1998). A test of missing completely at random for multivariate data with missing values. Journal of the American Statistical Association, 83(404), 1198–1202. https://doi.org/10.1080/01621459.1988.10478722
- Makhzoumi, S. H., Coughlin, J. W., Schreyer, C. C., Redgrave, G. W., Pitts, S. C., & Guarda, A. S. (2017). Weight gain trajectories in hospital-based treatment of anorexia nervosa. International Journal of Eating Disorders, 50(3), 266–274. https://doi.org/10.1002/eat.22679
- Melchior, H., Schulz, H., Kriston, L., Hergert, A., Hofreuter-Gätgens, K., Bergelt, C., Morfeld, M., Koch, U., & Watzke, B. (2016). Symptom change trajectories during inpatient psychotherapy in routine care and their associations with long-term outcomes. Psychiatry Research, 238, 228–235. https://doi.org/10.1016/j.psychres.2016.02.046
- Mirman, D. (2016). Growth curve analysis and visualization using R (1st ed.). New York: Taylor & Francis Group.
- Murray, S. B., Loeb, K. L., & Le Grange, D. (2018). Treatment outcome reporting in anorexia nervosa: Time for a paradigm shift? Journal of Eating Disorders, 6(1), 18–20. https://doi.org/10.1186/s40337-018-0195-1
- Muthén, B. O., & Muthén, L. K. (2000). Integrating person-centered and variable-centered analyses: Growth mixture modeling With latent trajectory classes. Alcoholism: Clinical and Experimental Research, 24(6), 882–891. https://doi.org/10.1111/j.1530-0277.2000.tb02070.x
- Muthén, L. K., & Muthén, B. O. (n.d.). Muthén, & Muthén (Eds.), Mplus user’s guide (8th Ed.). Los Angeles, CA: Muthén & Muthén. https://doi.org/10.1111/j.1600-0447.2011.01711.x
- Nylund, K. L., Asparouhov, T., & Muthén, B. O. (2007). Deciding on the number of classes in latent class analysis and growth mixture modeling: A monte carlo simulation study. Structural Equation Modeling: A Multidisciplinary Journal, 14(4), 535–569. https://doi.org/10.1080/10705510701575396
- Pettersen, G., & Rosenvinge, J. H. (2002). Improvement and recovery from eating disorders: A patient perspective. Eating Disorders, 10(1), 61–71. https://doi.org/10.1002/erv.425
- Preacher, K. J., Wichman, A. L., MacCallum, R. C., & Briggs, N. E. (2008). Latent growth curve modeling. Thousand Oaks: Sage Publications.
- Ryff, C. D., & Keyes, C. L. M. (1995). The Structure of psychological well-being revisited. Journal of Personality and Social Psychology, 69(4), 719–727. https://doi.org/10.1037/0022-3514.69.4.719
- Ryff, C. D., & Singer, B. (1996). Psychological weil-being: Meaning, measurement, and implications for psychotherapy research. Psychotherapy and Psychosomatics, 65(1), 14–23. https://doi.org/10.1159/000289026
- Slof-Op ‘t Landt, M. C. T., Dingemans, A. E., de la Torre Y Rivas, J., & van Furth, E. F. (2019). Self-assessment of eating disorder recovery: Absence of eating disorder psychopathology is not essential. International Journal of Eating Disorders, 52(8), 956–961. https://doi.org/10.1002/eat.23091.
- Taubitz, F. S., Büdenbender, B., & Alpers, G. W. (2022). What the future holds: Machine learning to predict success in psychotherapy. Behaviour Research and Therapy, 156, 104116 https://doi.org/10.1016/j.brat.2022.104116.
- Trompetter, H. R., Lamers, S. M. A., Westerhof, G. J., Fledderus, M., & Bohlmeijer, E. T. (2017). Both positive mental health and psychopathology should be monitored in psychotherapy: Confirmation for the dual-factor model in acceptance and commitment therapy. Behaviour Research and Therapy, 91, 58–63. https://doi.org/10.1016/j.brat.2017.01.008
- Uher, R., Muthén, B. O., Souery, D., Mors, O., Jaracz, J., Placentino, A., Petrovic, A., Zobel, A., Henigsberg, N., Rietschel, M., Aitchison, K. J., Farmer, A., & McGuffin, P. (2010). Trajectories of change in depression severity during treatment with antidepressants. Psychological Medicine, 40(8), 1367–1377. https://doi.org/10.1017/S0033291709991528
- Vall, E., & Wade, T. D. (2015). Predictors of treatment outcome in individuals with eating disorders: A systematic review and meta-analysis. International Journal of Eating Disorders, 48(7), 946–971. https://doi.org/10.1002/eat.22411
- Van Der Kaap-Deeder, J., Vansteenkiste, M., Soenens, B., Verstuyf, J., Boone, L., & Smets, J. (2014). Fostering self-endorsed motivation to change in patients with an eating disorder: The role of perceived autonomy support and psychological need satisfaction. International Journal of Eating Disorders, 47(6), 585–600. https://doi.org/10.1002/eat.22266
- Vansteenkiste, M., Soenens, B., & Vandereycken, W. (2005). Motivation to change in eating disorder patients: A conceptual clarification on the basis of Self-Determination theory. International Journal of Eating Disorders, 37(3), 207–219. https://doi.org/10.1002/eat.20099
- Wagener, A. M., & Much, K. (2010). Eating disorders as coping mechanisms. Journal of College Student Psychotherapy, 24(3), 203–212. https://doi.org/10.1080/87568225.2010.486291
- Wampold, B. E., & Imel, Z. E. (2015). The great psychotherapy debate; The evidence for what makes psychotherapy work (second). New York: Routledge.
- Wetzler, S., Hackmann, C., Peryer, G., Clayman, K., Friedman, D., Saffran, K., Silver, J., Swarbrick, M., Magill, E., van Furth, E. F., & Pike, K. M. (2020). A framework to conceptualize personal recovery from eating disorders: A systematic review and qualitative meta-synthesis of perspectives from individuals with lived experience. International Journal of Eating Disorders, 53(8), 1188–1203. https://doi.org/10.1002/eat.23260
- Wolk, S. L., Loeb, K. L., & Walsh, B. T. (2005). Assessment of patients with anorexia nervosa: Interview versus self-report. International Journal of Eating Disorders, 37(2), 92–99. https://doi.org/10.1002/eat.20076
- World Health Organization. (2005). Promoting mental health: Concepts, emerging evidence, practice. WHO. https://doi.org/10.1111/j.1466-7657.2004.00268.x