
 ?Mathematical formulae have been encoded as MathML and are displayed in this HTML version using MathJax in order to improve their display. Uncheck the box to turn MathJax off. This feature requires Javascript. Click on a formula to zoom.
Abstract
Objective: The occurrence of dropout from psychological interventions is associated with poor treatment outcome and high health, societal and economic costs. Recently, machine learning (ML) algorithms have been tested in psychotherapy outcome research. Dropout predictions are usually limited by imbalanced datasets and the size of the sample. This paper aims to improve dropout prediction by comparing ML algorithms, sample sizes and resampling methods. Method: Twenty ML algorithms were examined in twelve subsamples (drawn from a sample of N = 49,602) using four resampling methods in comparison to the absence of resampling and to each other. Prediction accuracy was evaluated in an independent holdout dataset using the F1-Measure. Results: Resampling methods improved the performance of ML algorithms and down-sampling can be recommended, as it was the fastest method and as accurate as the other methods. For the highest mean F1-Score of .51 a minimum sample size of N = 300 was necessary. No specific algorithm or algorithm group can be recommended. Conclusion: Resampling methods could improve the accuracy of predicting dropout in psychological interventions. Down-sampling is recommended as it is the least computationally taxing method. The training sample should contain at least 300 cases.
Clinical or methodological significance of this article: This paper aims at improving the prediction of the occurrence of dropout in psychological interventions in a naturalistic setting and providing evidence-based guidelines to set a standard for, support researchers in modelling dropout, and increase comparability of findings. To achieve this the performance of 20 machine learning (ML) algorithms is compared in twelve differently sized subsamples under the influence of four different resampling methods as well as without resampling. The results of this paper can support future research on dropout prediction by providing empirically supported parameters for sample size recommendation and the selection of suitable algorithms. Improved dropout predictions at the beginning of treatment could be integrated into feedback systems for psychotherapists and could result in a more accurate clinical prognosis, enhanced case conceptualization and clinical decision-making. This could enable therapists to assess the risk of dropout for individual patients and apply clinical techniques to improve motivation, alliance, or treatment expectations, thus potentially reducing dropout.
Introduction
Dropout or the premature discontinuation of psychological therapies is an important topic in mental health practice and research. Fortunately, dropout of psychotherapy is a relatively rare event. The meta-analysis of Swift et al. (Citation2017) reported an average of 21.9% of clients ending therapy prematurely. It is, however, a very costly event, as it is associated with poor treatment outcomes, higher hospitalization rates for individual patients, and high health, societal and economic costs (e.g., Barrett et al., Citation2008; Delgadillo et al., Citation2014; Druss & Rosenheck, Citation1999; Karterud et al., Citation2003; Sainsbury Centre for Mental Health, Citation2003). However, the definition of dropout is heterogeneous. Previously applied definitions included for example patients ending treatment against the advice of the therapist, a predefined treatment length, the completion of a treatment protocol or missing two consecutive sessions (e.g., Beckham, Citation1992; Hatchett et al., Citation2002; Horner & Diamond, Citation1996; Kolb et al., Citation1985; Maher et al., Citation2010).
From a methodological standpoint, dropout prediction is comparable to cancer screenings. Cancer is also a rare occurrence that is associated with high costs (Sung et al., Citation2021). The goal is to identify as many of the rare events as possible. Not identifying a patient with cancer (false negative) is associated with very high costs and should be avoided. Identifying a healthy patient as having cancer (false positive) is associated with decisively lower costs. Which ratios are deemed important depends on the content of the classification problem. In an interview process to select a candidate for example a lower false positive rate is desired.
Regarding precision mental health care, the same is true for the prediction of the occurrence of dropout in a routine care setting. Not identifying a possible dropout case (false negative) is associated with higher costs than falsely identifying a non-risk case as a potential dropout case (false positive; e.g., Lutz et al., Citation2019). Alerting a therapist at the beginning of the therapy of a patient’s increased risk of dropping out of therapy could enable the therapist to intervene and, for example, increase the focus on the therapeutic alliance or therapy motivation. Although, a good therapeutic alliance and therapy motivation is important for all patients, therapists are limited in their resources and need to allocate those as best as possible. Patients at risk of dropping out of therapy might need a more motivation-oriented strategy. Some patients, however, might profit more from early problem-solving (Lutz, Deisenhofer, et al., Citation2021).
Patient-specific predictors of dropout have been identified in several studies. Male sex, young age, low education level, personality disorders, low initial global functioning, and high initial distress have been found to be associated with dropout (Bower et al., Citation2013; Karterud et al., Citation2003; McMurran et al., Citation2010; Swift & Greenberg, Citation2012; Zimmermann et al., Citation2017). However, findings on predictors of dropout are heterogeneous, most studies used small samples, applied heterogeneous methods, and their statistical precision needs further improvement.
Recently, machine learning (ML) algorithms have been introduced in psychotherapy outcome research. Larger datasets and a steady increase in computational power have led to ML techniques being discussed as an option to improve prediction models in psychotherapy (Aafjes-van Doorn et al., Citation2020; Delgadillo & Lutz, Citation2020). ML refers to approaches combining statistics and computer science, and these algorithms can be grouped by the similarity of their function (Figure S1; Brownlee, Citation2019; Gillan & Whelan, Citation2017; Iniesta et al., Citation2016). Different ML approaches have been used to predict treatment outcomes, such as elastic net, random forest, k nearest neighbours, ensembles, etc. (Dinga et al., Citation2018; Lutz et al., Citation2005; Pearson et al., Citation2019; Webb et al., Citation2020). Treatment selection models for individual patients have been developed by applying the Personalized Advantage Index and different ML approaches (e.g., Cohen et al., Citation2020; Cohen & DeRubeis, Citation2018; Deisenhofer et al., Citation2018; Delgadillo & Gonzalez Salas Duhne, Citation2020; DeRubeis et al., Citation2014; Huibers et al., Citation2015; Kessler et al., Citation2019; Lorenzo-Luaces & DeRubeis, Citation2018; Schwartz et al., Citation2020). Furthermore, ML has been used to predict the risk of dropout for individual patients based on their intake variables (Lutz et al., Citation2019) and ambulatory assessments before initiating treatment (Lutz et al., Citation2018). Machine learning is a potentially useful tool to improve prediction on an individual patient-level, as it can model linear as well as non-linear and complex relationships (i.e., interactions) between variables (Makridakis et al., Citation2018).
In contrast to the prediction of continuous outcomes, predictions of treatment dropout are based on imbalanced datasets (i.e., a disproportionate ratio of observations), with the rare class being the one of interest. Ignoring class imbalance may lead to adverse consequences regarding model estimation and the evaluation of the model’s accuracy, as classification methods tend to favour the majority class and neglect the minority class (Hand & Vinciotti, Citation2003; Japkowicz & Stephen, Citation2002; Menardi & Torelli, Citation2014). This holds true for different kinds of classifiers, such as logistic regression, linear discriminant analysis, classification trees, k nearest neighbours, neural networks or support vector machines (Akbani et al., Citation2004; Chawla, Citation2003; Cieslak & Chawla, Citation2008; Cramer, Citation1999; Hand & Vinciotti, Citation2003; King & Ryan, Citation2002; King & Zeng, Citation2001; Kubat & Matwin, Citation1997; Lawrence et al., Citation1998; Owen, Citation2007). Imbalanced data can be addressed either by data pre-processing (e.g., resampling methods, feature selection and extraction, cost-sensitive weighting) or algorithm centred approaches (e.g., cost-sensitive learning or one-class learning) as well as hybrid methods combining data pre-processing and algorithm centred approaches (Kaur et al., Citation2020). This paper addresses solutions on the data level referred to as resampling methods, which aim to generate two classes of equal size, as well as feature selection via least absolute shrinkage and selection operator (LASSO) regression (Guo et al., Citation2015).
Apart from class imbalance, the predictive power of a classifier depends largely on the size and quality of the training sample (Cohen et al., Citation2020; Dobbin et al., Citation2008; Kalayeh & Landgrebe, Citation1983; Kim, Citation2009; Mukherjee et al., Citation2003; Nigam et al., Citation2000; Tam et al., Citation2006). However, how large a training sample has to be to achieve good predictions is still a matter of methodological debate (Balki et al., Citation2019). In psychotherapy research, most studies on dropout prediction are limited by relatively small samples. Therefore, evaluating the performance of ML algorithms in differently sized samples is an important task to advance dropout prediction in psychotherapy research.
This methodological paper aims at improving the prediction of dropout from psychological interventions by comparing the performance of 20 different ML algorithms in twelve differently sized subsamples under the influence of four different resampling methods as well as without resampling. The results can act as an evidence-based guideline to set a standard for, support researchers in modelling dropout predictions, and increase comparability of findings.
Method
Setting and Interventions
This study was conducted using multi-service archival data from sixteen psychological therapy teams covering a geographically and socioeconomically diverse clinical sample across England (London, Cambridge, Cheshire & Wirral, Bury, Heywood, Middleton, Rochdale, Oldham, Stockport, Tameside & Glossop, Trafford, Barnsley, and East Riding). The London - City & East NHS Research Ethics Committee (06/01/2016, Ref: 15/LO/2200) approved the assembly and analysis of a fully anonymised dataset. Verbal consent was obtained from patients and documented in their clinical records. The data was collected for all patients who accessed the participating services within a three-year data collection period (2014–2017).
The participating psychological services were part of the Improving Access to Psychological Therapies (IAPT) programme, a national treatment system offering time-limited and evidence-based psychological interventions for depression and anxiety that are delivered in a stepped care model (Clark, Citation2011; NICE, Citation2011). Initially, most patients access low intensity cognitive behavioural therapy (LiCBT), which consists of a short (up to eight sessions) guided self-help intervention based on CBT principles. LiCBT is highly structured and follows treatment protocols based on a national training curriculum (National IAPT Team, Citation2015). LiCBT is delivered by qualified practitioners under the weekly supervision from senior practitioners and psychotherapists. In the present sample, 88% of LiCBT interventions involved individual support, ∼10% were delivered in groups, and ∼2% were delivered by blended care (online CBT and telephone support).
More severe and complex cases, or patients who do not respond to LiCBT, are offered more intensive and costly psychotherapies that can last up to 20 sessions, such as formal CBT, person-centred experiential counselling, and interpersonal psychotherapy, and is based on evidence-based protocols recommended by national clinical guidelines (National Institute for Health and Care Excellence, Citation2011).
In this study, only cases receiving LiCBT were examined as it was the larger sample (80.5% of patients accessed LiCBT) and to exclude treatment intensity as a possible confounder. To obtain a sample that most clearly represents LiCBT, only patients who started and ended with LiCBT and had at least one session of LiCBT were included.
Measures
IAPT services collect three validated patient-reported measures on a session-to-session basis as part of routine outcome monitoring (Clark, Citation2011). The Patient Health Questionnaire-9 (PHQ-9; Kroenke et al., Citation2001) measures depression symptoms, with nine items rated from 0 to 3, resulting in an overall severity score ranging between 0 and 27. The GAD-7 (Kroenke et al., Citation2007) is a measure of anxiety disorder, with seven items rated from 0 to 3, resulting in an overall severity score ranging between 0 and 21. The Work and Social Adjustment Scale (WSAS; Mundt et al., Citation2002) rates functional impairment across five domains on a scale from 0 to 8: work, home management, social life, private leisure activities, and family relationships. Additional demographic data included age, gender, employment status, diagnosis, and the Index of Multiple Deprivation (IMD; Table S1). The IMD is a measure of socioeconomic deprivation for neighbourhoods in England (Department for Communities and Local Government, Citation2015), aggregated into decile groups where 1 = most deprived and 10 = least deprived areas.
Dropout Definition
Dropout (vs. treatment completion) was determined by the therapist and documented in routine clinical records for all patients. It was defined as the one-sided decision of the patient to end therapy before the end of the scheduled treatment. However, patients that dropped out of therapy in the IAPT services might have sought help in other services, though this is beyond the information available from clinical records. Patients who fell in other categories denoting reasons for the end of treatment which did not fit with either “completion” or “dropout” were excluded from the sample. This refers to patients that were for example unsuitable for treatment in IAPT services (i.e., acute suicidality, psychosis, or organizational reasons), patients that moved away or died.
Statistical Analyses
Sample Selection. The complete procedure of sample selection is illustrated in Figure S2 in the supplementary material. From the 157,946 cases in the full dataset, 25,369 had to be removed either because of missing data in the dependent variable, no clear way of categorizing cases to dropout or completer cases, or more than 50% missing values. To maintain comparability, high intensity psychotherapy cases were excluded, and all analyses were run exclusively on the LiCBT sample (n = 49,602).
These cases were split into a holdout sample (30%, n = 14,881) and a training sample (70%; n = 34,721). Twelve subsamples were selected randomly from the training sample, ranging from 50 to 10,000 cases, with a finer-grained spacing between smaller samples (i.e., 50; 75; and 100) than larger samples (i.e., 2,500; 5,000; and 10,000). All reported results are based on the complete holdout sample, to compare the performance of different ML algorithms in new data and to improve generalizability.
Missing Data. Missing data points in the potential predictor variables were imputed separately for the training (n = 34,721) and holdout sample (n = 14,881) via the R package missForest version 1.4 (Stekhoven & Bühlmann, Citation2012) to analyse the whole sample of patients seeking treatment in LiCBT instead of only the highly committed subsample of patients who completed all questionnaires. MissForest uses random forest to impute missing values and can handle continuous and categorical data in addition to nonlinear associations and interactions. As simulation studies have shown that missForest performs well for up to 30% of missing values, variables with more than 30% missing values and cases with more than 50% of missing values were excluded from the analysis (Stekhoven & Bühlmann, Citation2012).
Predictor Transformation and Selection. All continuous predictors were standardized, and categorical predictors were dichotomized. All 14 available predictors (Table S1) were entered into a LASSO regression (Guo et al., Citation2015) to select relevant features. This was done using the R-Package glmnet (Friedman et al., Citation2010) with a ten-fold cross-validation. Glmnet chooses the hyperparameter lambda empirically. Predictor selection was performed on the complete training sample (n = 34,721) and not for each subsample separately as this paper aimed at examining the performance of the prediction models in the different sample sizes and not the influence of varying predictors. The LASSO approach is considered to be a parsimonious and conservative method for variable selection, which prioritizes out-of-sample generalizability and is robust to multicollinearity (Tibshirani, Citation1996).
Resampling Methods. The analyses were run with five different approaches: [1] no resampling, [2] up-sampling, [3] down-sampling, [4] synthetic minority oversampling technique (SMOTE), and [5] random oversampling examples (ROSE). Up-sampling of the minority class seeks to equalise class imbalance by randomly duplicating cases in the minority class (e.g., patients that dropped out of therapy). It may lead to overfitting by copying the same information and greatly increases the computational effort. Down-sampling consists of randomly excluding cases from the majority class (e.g., patients that completed treatment). It reduces the sample size and may lead to a loss of information, which raises the potential for underfitting and poor generalization to the holdout sample (Estabrooks et al., Citation2004; Japkowicz & Stephen, Citation2002; McCarthy et al., Citation2005). SMOTE and ROSE are hybrid methods combining up and down sampling. SMOTE generates new examples for each rare training observation using a nearest neighbours modelling approach (Chawla et al., Citation2002). ROSE creates artificially balanced samples generated with a smoothed bootstrap approach (Lunardon et al., Citation2014).
ML Algorithms. Guided by the SMART Mental Health Prediction Tournament (Cohen et al., Citation2018) we selected a total of 20 machine learning algorithms (Figure S1). All algorithms applied repeated cross-validation with ten splits and five repeats. All models were run using the R package caret, which tunes parameters and selects the optimal model autonomously (Kuhn, Citation2008). ML algorithms were trained in the training samples and validated in the holdout sample. For the sake of brevity, we provide only a short overview of each of the applied ML algorithm groups (regression, Bayesian, decision tree, instance-based, regularization, artificial neural networks, dimensionality reduction, and ensemble), grouped by their function.
Regression algorithms are modelling the relationship between variables and are iteratively refined by using a measure of error in the models’ predictions. The algorithms Generalized linear model (glm) and support vector machine (svmLinear2) were applied from this group. Bayesian algorithms apply Bayes theorem of probability for classification or regression problems. From this group Naïve Bayes (naivebayes) and Bayesian Generalized Linear Model (bayesglm) were applied. Decision Tree algorithms construct models of decisions based on the values of features in the data. Decisions branch out in tree-like structures until a prediction is made. They can be used for classification and regression problems and are often fast and fairly accurate. The algorithm Conditional Inference Trees (ctree2) was used in the analysis. Instance-based algorithms base predictions on the best match to a given case by using similarity measures. From this group the algorithm k-nearest neighbours (knn) was used. Regularization algorithms penalize models based on their complexity and favour simpler, more generalizable models. Elastic net (glmnet) was applied from this group. Artificial Neural networks are influenced by the function and/or structure of biological neural networks. Three neural networks were used: feed-forward neural network (Nnet), model averaged neural network (avNNet), and monotone multi-layer perceptron (monmlp). Dimensionality reduction algorithms explore and exploit the structure of the data. From this group linear discriminant analysis (LDA) was applied. Ensemble algorithms are comprised of multiple, independently trained models and make overall predictions based on the combination of these models. This is the largest category of algorithms with nine different algorithms: Bayesian additive regression trees (BartMachine), boosted generalized linear model (glmboost), boosted classification tress (ada), bagged CART (treebag), bagged MARS (bagEarth), random forest (rf), extreme gradient boosting (xgbTree), boosted logistic regression (LogitBoost), and stochastic gradient boosting (gbm; Brownlee, Citation2019).
Evaluation Measure. The selection of the appropriate evaluation metric depends on the classification problem and no metric can generally be considered the best. However, when evaluating imbalanced data Brier score, accuracy and area under the curve (AUC) have recently been criticised as values for selecting the best performing algorithm (He & Garcia, Citation2009; Menardi & Torelli, Citation2014; Weiss, Citation2004; Weiss & Provost, Citation2001). Overall the Brier score may show a good calibration, but might perform poorly in the classification of the rare class (Wallace & Dahabreh, Citation2014). Algorithm performance may gain the best overall accuracy by classifying each case in the majority group. If the minority class represents only 1% of the data and the algorithm classifies every case in the majority class, the overall accuracy would be .99. In a simulation study Jeni et al. (Citation2013) suggest that the receiver operating characteristics (ROC) curves may mask poor algorithm performance and ROC curves do not take class distribution and different misclassification costs into account (Menardi & Torelli, Citation2014).
Overcoming the problems of these evaluation measures, the F1-Score measures the accuracy of a binary classification by weighting precision and recall equally:
with precision describing the sum of true positives divided by the sum of predicted positives and recall describing the sum of true positives divided by the sum of actual positives. The F1-Score ranges from 0 to 1, with 1 indicating a perfect precision and a perfect recall. It is commonly used when learning from imbalanced datasets (Weiss, Citation2013) and in fields with similar objectives such as cancer research (e.g., Jiao et al., Citation2020; Li et al., Citation2018; Mohammed et al., Citation2021).
With a base rate of dropout in the holdout sample of .33, and assuming a chance level of .50, the threshold for a model performing better than chance was an F1-Score of . Additionally, other common indices of performance were also computed, including Brier scores, AUC, sensitivity, and specificity.
Results
For simplicity, the focus of the results is placed on the F1-Scores as the primary performance index. Further information regarding other performance measures (AUC, accuracy, balanced accuracy, sensitivity, specificity, true positive, true negative, false positive, and false negative values) are only reported in brevity and more detail is contained in the supplementary materials. Seven predictors of dropout were selected by LASSO regression: Age (younger patients), ethnicity (ethnic minority), unemployment, IMD (more socioeconomically deprived neighbourhoods), and higher baseline severity on the PHQ-9, the GAD-7, and WSAS ().
Table I. Sample characteristics of the predictors selected by LASSO regression for the complete sample, the training sample, and the holdout sample.
The average F1-Scores across all algorithms and subsamples for each resampling method ranged from .32 to .46. The highest mean F1-Score of .46 was achieved with the down-sampling method, followed by the up-sampling method with a mean F1-Score of .45. The smote resampling method reached a mean F1-Score of .44 and the ROSE method reached a mean F1-Score of .43. Using no resampling methods resulted in a mean F1-Score of .32 (Table S2; ).
Figure 1. Mean F1-scores across all algorithms and sample size for the different resampling methods.
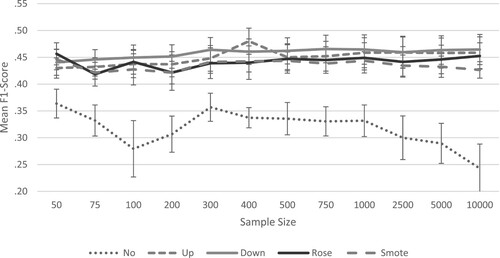
The average true positive values (i.e., correctly identified dropout cases) across all algorithms and subsamples for each method ranged from 1377 to 2773 cases. The highest mean true positive value of 2773 cases was achieved by the down-sampling method, followed by the up-sampling method with a mean true positive value of 2642 cases. The smote resampling method reached a mean true positive value of 2494 cases, and the ROSE method reached a mean true positive value of 2585 cases. The lowest mean true positive value of 1377 was reached when no resampling method was applied (Tables S9–S12; Figures S9–S12).
Within the resampling methods, the threshold of a mean F1-Score of .40 was exceeded in all subsamples. The highest F1-Score of .47 was reached in the subsample of 750 cases using the down-sampling method. All subsequent results presented are restricted to those observed in the algorithms using the down-sampling method ().
Table II. F1-scores of all algorithms in each sample size using the down sampling method.
The three best and worst performing algorithms in each subsample using the down-sampling method are depicted in and highlighted in bold and italic in . The best performing algorithm groups were linear algorithms, artificial neural networks, ensemble algorithms, decision trees and dimensionality reduction. Among the three best performing algorithms per subsample, linear algorithms (generalized linear model; mean F1-Score = .48, Bayesian generalized linear model, support vector machine, elastic net; mean F1-Score = .49) were selected 28 times, artificial neural networks (feed-forward neural network; mean F1-Score = .48, model averaged neural network, monotone multi-layer perceptron; mean F1-Score = .47) 9 times, and ensembles algorithms (stochastic gradient boosting, extreme gradient boosting, Bayesian additive regression trees; mean F1-Score = .48, boosted generalized linear model; mean F1-Score = .49; boosted logistic regression, bagged CART; mean F1-Score = .45) 13 times. Additionally, there were three standalone algorithms that were not grouped with other algorithms. The decision tree algorithm conditional inference trees (mean F1-Score = .46) was selected three times, the dimensionality reduction algorithm linear discriminant analysis (mean F1-Score = .49) was selected seven times and random forest (mean F1-Score = .47) was selected once.
Figure 2. Best and worst performing algorithms in each sample size using the down-sampling method.
Note: The F1-Scores are centred at the threshold of .40 and the deviation from the threshold is shown in the bars. If multiple algorithms reached the same F1-Score, they were all selected and grouped together.
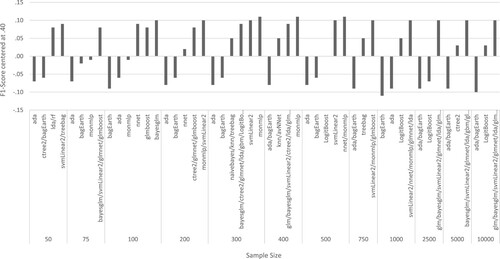
The algorithms with the highest mean F1-Scores across all subsamples were naïve Bayes, support vector machine, elastic net, linear discriminant analysis and boosted generalized linear model with a mean F1-Score of .49 each. The algorithm naïve Bayes was selected in seven samples (75; 100; 300; 400; 2,500; 5,000; and 10,000), the support vector machine was selected in eleven samples (all samples except for 100), and the algorithm elastic net was selected in seven samples (75; 200; 300; 1,000; 2,500; 5,000; and 10,000) as one of the best algorithms. The dimensionality reduction algorithm linear discriminant analysis was selected in seven samples (50; 300; 400; 1,000; 2,500; 5,000; and 10,000) and the ensemble algorithm boosted generalized linear model was selected in eight samples (75; 100; 200; 400; 750; 2,500; 5,000; and 10,000) as one of the best algorithms ().
Secondary outcomes are depicted in the supplementary material, containing the full results for the Brier Score (Table S3; Figure S3), the accuracy (Table S4; Figure S4), the AUC (Table S5; Figure S5), the sensitivity (Table S6; Figure S6), the specificity (Table S7; Figure S7), and the balanced accuracy (Table S8; Figure S8). Additionally, a confusion matrix (Figure S9) illustrates the calculation methods of the different indices.
In the following results of some secondary outcome measures are reported. The mean Brier scores (Table S3; Figure S3) for predictions made without using resampling methods was slightly lower (mean = .24) than the mean Brier score across all resampling methods (mean = .26). The mean accuracy (Table S4; Figure S4) of the predictions made without resampling methods was higher (mean = .62) than the mean accuracy across all resampling methods (mean = .57). The balanced accuracy (Table S8; Figure S8) for predictions made without resampling methods was lower (mean = .53) than the mean accuracy across all resampling methods (mean = .56). The mean AUC scores (Table S5; Figure S5) for predictions made with or without resampling were identical (mean = .60). The mean sensitivity (Table S6; Figure S6) for predictions made without resampling was lower (mean = .28) than for predictions made with resampling (mean = .54). The mean specificity (Table S7; Figure S7) for predictions made without resampling was higher (mean = .79) than for predictions made with resampling methods (mean = .58).
Discussion
This paper examined the influence of resampling methods and sample size on the prediction of the occurrence of dropout in psychological treatment using several state-of-the-art ML algorithms. To our knowledge, no previous study has compared algorithm performance in dropout prediction using different resampling methods and varying sample sizes.
Main Findings
Resampling methods improved the averaged F1-Scores across all algorithms and samples. Therefore, we recommend employing resampling when developing ML models for dropout prediction. Between the four resampling methods, however, no method can be identified as being the best method, as the confidence intervals are overlapping. Nevertheless, the resampling methods differ in their requirement of computational power and time consumption, with the down-sampling method being the least computationally taxing and the fastest method among the examined methods. When dealing with large data sets or when computational power is limited, we recommend applying the down-sampling method.
Increasing the sample size slightly improved the predictive power when using resampling methods and remained stable in samples containing 300 cases or more. Accurate predictions, therefore, can be achieved in samples as small as N = 300. This finding represents an empirically-based threshold for sample sizes when predicting treatment dropout using ML algorithms, and it adds to the ongoing debate on sample size recommendations for classifiers (Balki et al., Citation2019). It is in line with recommendations by Luedtke et al. (Citation2019) who recommend a minimum sample size of n = 300 patients per treatment arm for treatment selection models.
To identify the models that are best suited for dropout prediction, 20 different ML approaches were compared in the present study. Although linear methods and artificial neural networks performed slightly better than other methods, the differences between the algorithms are not substantial enough to justify a recommendation for specific algorithm groups or individual algorithms.
The Brier score (Table S3; Figure S3) was slightly lower when not using resampling methods, which implies a better prediction. This however may be due to a systematic underestimation of the minority class, i.e., the dropout cases (Wallace & Dahabreh, Citation2014). The accuracy (Table S4; Figure S4) is higher when not using resampling methods. This is most likely due to the data imbalance and the correct classification of completer cases (He & Garcia, Citation2009; Menardi & Torelli, Citation2014; Weiss, Citation2004; Weiss & Provost, Citation2001). The balanced accuracy (Table S10, Figure S10) seems to confirm this, as the predictions made with resampling methods performed better than prediction without resampling. The AUC is not influenced by the use or the absence of resampling methods. This is likely due to the fact that the AUC does not take different misclassification costs or class distribution into account (Menardi & Torelli, Citation2014). The sensitivity (Table S6, Figure S6) is higher when using resampling methods, indicating that more dropout cases were identified correctly when using resampling methods. Conversely the specificity (Table S7, Figure S7) is higher when not using resampling methods, indicating that more completer cases were identified correctly when not using resampling methods. This is mostly due to the fact that sensitivity and specificity are one-dimensional performance metrics and are therefore not subjected to the bias of data imbalance (Luque et al., Citation2019). The mean true positive values (i.e., actual dropout = predicted dropout) are higher when using resampling methods, while the mean true negative values (i.e., actual completer = predicted completer) are higher when not using resampling methods (Tables S9 – S10; Figures S9 – S10).
Limitations and Future Directions
Methodological limitations of this study are related to the selection of the predictors, the sample selection, the selection of the algorithms, and the structure of the data. First, predictor selection for dropout via LASSO regression was done on the complete training sample to avoid different predictors in different subsamples impairing the comparability of performance across different algorithms (Guo et al., Citation2015). Nevertheless, we acknowledge that a different subset of predictors may have been derived by different approaches to variable selection, though a comparison of variable selection techniques was outside of the scope of the present study and keeping predictors stable across all calculations was paramount to make a comparison. Preselecting relevant features leads to more parsimonious models and reduces the requirements for computational power.
Second, each sample size was selected only once. A repeated selecting of the subsamples would improve the stability of the F1-Scores, especially in the smaller samples. This was done for computational reasons, as this study already required a large computational power, even without repeated sample selection.
Third, we selected 20 algorithms that represent different families of ML approaches, but there are many more algorithms available. Therefore, the possibility that there might be other algorithms better suited to predict dropout cannot be excluded. However, the results suggest that there is not one best algorithm to predict dropout from this IAPT dataset. Furthermore, the default calibration settings for algorithms provided by the R package caret (Kuhn, Citation2008) were applied. Caret tunes the algorithm parameters automatically, but manual fine-tuning might have improved the predictions.
Finally, the study is limited by the structure of the data, as potentially relevant predictors of dropout, such as personality styles or disorder as well as education level, were not available (Karterud et al., Citation2003; McMurran et al., Citation2010; Swift & Greenberg, Citation2012), dropout was determined exclusively by the treating therapist and there were cases that could not definitively be categorized into dropout, such as patients deemed not suitable for the IAPT system. Dropout from psychological interventions is a complex subject and identified predictors of dropout are heterogeneous, therefore, dropout prediction still proves to be difficult.
Further research is needed to improve dropout predictions via ML. The high prevalence of dropout in psychological interventions and its high costs for the patients’ health, the society at large, and the economy make the improvement of dropout prediction a highly important research topic (e.g., Barrett et al., Citation2008; Delgadillo et al., Citation2014; Druss & Rosenheck, Citation1999; Karterud et al., Citation2003; Sainsbury Centre for Mental Health, Citation2003). A reliable dropout prediction for individual patients could have important practical implications for clinicians and improve the personalization of psychological interventions. Including a dropout prediction for individual patients based on their intake variables in a feedback system can alert therapists to a risk of premature termination of treatment (Lutz et al., Citation2019). However, such prediction tools will only be useful or acceptable to clinical services if they are accurate. Therefore, this paper makes an important contribution to guide the field on how to train accurate models. Similar to cancer screenings, a false positive alert of a potential dropout can be seen as less detrimental as missing a dropout case. An alert can, however, lead to further clinical exploration through the therapist. Additionally to integrating dropout prediction in a feedback system for therapists, prospective studies are important to determine the reliability of the predictions in a clinical setting (Lutz, Deisenhofer, et al., Citation2021).
Conclusions
Despite the above-mentioned limitations, the present findings can support future research on dropout prediction by providing empirically supported parameters for sample size recommendation and for the selection of ML algorithms. Results suggest that a minimum of 300 patients might be necessary to build accurate prediction models and that the predictive accuracy of a model is improved when using resampling methods to handle imbalanced data. The down-sampling method can be recommended as it is the least computationally taxing and the fastest method. When integrated into a feedback system for therapists improved dropout predictions could result in a more accurate clinical prognosis, enhance case conceptualization and clinical decision-making (Cohen et al., Citation2018; Delgadillo & Lutz, Citation2020; Lutz et al., Citation2015, Citation2019; Lutz, Schwartz, et al., Citation2021). Identifying patients at risk for dropout reliably and early in treatment, or even before the start of treatment, might enable therapists to consider this risk and to apply clinical techniques to improve motivation, alliance or treatment expectations, thus potentially reducing dropout and thereby enhancing treatment outcomes and limiting negative consequences of premature treatment termination. However, we acknowledge that further research into the accuracy of dropout prediction and their potential real-life benefits are required. Prospective studies where dropout predictions are integrated into a feedback system are necessary to evaluate the usefulness in reducing dropout from psychological interventions.
Data Sharing and Data Accessibility
The data that support the findings of this study are available on request from the corresponding author. The data are not publicly available due to privacy or ethical restrictions.
tpsr-2022-0102-File004
Download MS Word (221.6 KB)Disclosure Statement
No potential conflict of interest was reported by the author(s).
Supplemental data
Supplemental data for this article can be accessed https://dx.doi.org/10.1080/10503307.2022.2161432.
References
- Aafjes-van Doorn, K., Kamsteeg, C., Bate, J., & Aafjes, M. (2020). A scoping review of machine learning in psychotherapy research. Psychotherapy Research, 31(1), 92–116. https://doi.org/10.1080/10503307.2020.1808729
- Akbani, R., Kwek, S., & Japkowicz, N. (2004). Applying support vector machines to unbalanced datasets. In Boulicaut, J. F., Esposito, F., Giannotti, F., Pedreschi, D. (Eds.), Lecture Notes in Computer Science, Proceed-Ings of 15th European Conference on Machine Learning, ECML, Springer, Pisa (3201, pp. 39–50).
- Balki, I., Amirabadi, A., Levman, J., Martel, A. L., Emersic, Z., Meden, B., Garcia-Pedrero, A., Ramirez, S. C., Kong, D., Moody, A. R., & Tyrrell, P. N. (2019). Sample-size determination methodologies for machine learning in medical imaging research: A systematic review. Canadian Association of Radiologists Journal, 70(4), 344–353. https://doi.org/10.1016/j.carj.2019.06.002
- Barrett, M. S., Chua, W.-J., Crits-Christoph, P., Gibbons, M. B., Casiano, D., & Thompson, D. (2008). Early withdrawal from mental health treatment: Implications for psychotherapy practice. Psychotherapy: Theory, Research, Practice, Training, 45(2), 247–267. https://doi.org/10.1037/0033-3204.45.2.247
- Beckham, E. E. (1992). Predicting patient dropout in psychotherapy. Psychotherapy: Theory, Research, Practice, Training, 29(2), 177–182. https://doi.org/10.1037/0033-3204.29.2.177
- Bower, P., Kontopantelis, E., Sutton, A., Kendrick, T., Richards, D. A., Gilbody, S., Knowles, S., Cuijpers, P., Andersson, G., Christensen, H., Meyer, B., Huibers, M., Smit, F., van Straten, A., Warmerdam, L., Barkham, M., Bilich, L., Lovell, K., & Liu, E. T.-H. (2013). Influence of initial severity of depression on effectiveness of low intensity interventions: Meta-analysis of individual patient data. BMJ (Clinical Research Ed.), 346, f540. https://doi.org/10.1136/bmj.f540
- Brownlee, J. (2019, August 12). A tour of machine learning algorithms: A tour of machine learning algorithms. Machine Learning Mastery. https://machinelearningmastery.com/a-tour-of-machine-learning-algorithms/
- Chawla, N. V. (2003). C4.5 and imbalanced data sets: Investigating the effect of sampling method, probabilistic estimate, and decision tree structure. Procceedings of the ICML ‘03 Workshop on Class Imbalance.
- Chawla, N. V., Bowyer, K. W., Hall, L. O., & Kegelmeyer, W. P. (2002). SMOTE: Synthetic minority over-sampling technique. Journal of Artificial Intelligence Research, 16, 321–357. https://doi.org/10.1613/jair.953
- Cieslak, D. A., & Chawla, N. V. (2008). Learning Decision Trees for Unbalanced Data, 5211, 241–256. https://doi.org/10.1007/978-3-540-87479-9_34
- Clark, D. M. (2011). Implementing NICE guidelines for the psychological treatment of depression and anxiety disorders: The IAPT experience. International Review of Psychiatry, 23(4), 318–327. https://doi.org/10.3109/09540261.2011.606803
- Cohen, Z. D., & DeRubeis, R. J. (2018). Treatment selection in depression. Annual Review of Clinical Psychology, 14(1), 209–236. https://doi.org/10.1146/annurev-clinpsy-050817-084746
- Cohen, Z. D., Kim, T. T., Van, H. L., Dekker, J. J. M., & Driessen, E. (2020). A demonstration of a multi-method variable selection approach for treatment selection: Recommending cognitive-behavioral versus psychodynamic therapy for mild to moderate adult depression. Psychotherapy Research, 30(2), 137–150. https://doi.org/10.1080/10503307.2018.1563312
- Cohen, Z. D., Wiley, J. F., Lutz, W., Fisher, A. J., Kim, T., Saunders, R., & Buckman, J. E. J. (2018). SMART Mental Health Prediction Tournament. osf.io/wxgzu
- Cramer, J. S. (1999). Predictive performance of the binary logit model in unbalanced samples. Journal of the Royal Statistical Society: Series D (the Statistician), 48(1), 85–94. https://doi.org/10.1111/1467-9884.00173
- Deisenhofer, A.-K., Delgadillo, J., Rubel, J. A., Böhnke, J. R., Zimmermann, D., Schwartz, B., & Lutz, W. (2018). Individual treatment selection for patients with posttraumatic stress disorder. Depression and Anxiety, 35(6), 541–550. https://doi.org/10.1002/da.22755
- Delgadillo, J., & Gonzalez Salas Duhne, P. (2020). Targeted prescription of cognitive-behavioral therapy versus person-centered counseling for depression using a machine learning approach. Journal of Consulting and Clinical Psychology, 88(1), 14–24. https://doi.org/10.1037/ccp0000476
- Delgadillo, J., & Lutz, W. (2020). A development pathway towards precision mental health care. JAMA Psychiatry, 77(9), 889–890. https://doi.org/10.1001/jamapsychiatry.2020.1048
- Delgadillo, J., McMillan, D., Lucock, M., Leach, C., Ali, S., & Gilbody, S. (2014). Early changes, attrition, and dose-response in low intensity psychological interventions. The British Journal of Clinical Psychology, 53(1), 114–130. https://doi.org/10.1111/bjc.12031
- Department for Communities and Local Government. (2015). English indices of deprivation. https://www.gov.uk/government/statistics/english-indices-of-deprivation-2015
- DeRubeis, R. J., Cohen, Z. D., Forand, N. R., Fournier, J. C., Gelfand, L. A., & Lorenzo-Luaces, L. (2014). The personalized advantage index: Translating research on prediction into individualized treatment recommendations: A demonstration. PloS One, 9(1), e83875. https://doi.org/10.1371/journal.pone.0083875
- Dinga, R., Marquand, A. F., Veltman, D. J., Beekman, A. T. F., Schoevers, R. A., van Hemert, A. M., Penninx, B. W. J. H., & Schmaal, L. (2018). Predicting the naturalistic course of depression from a wide range of clinical, psychological, and biological data: A machine learning approach. Translational Psychiatry, 8(1), 241. https://doi.org/10.1038/s41398-018-0289-1
- Dobbin, K. K., Zhao, Y., & Simon, R. M. (2008). How large a training set is needed to develop a classifier for microarray data? Clinical Cancer Research, 14(1), 108–114. https://doi.org/10.1158/1078-0432.CCR-07-0443
- Druss, B. G., & Rosenheck, R. A. (1999). Patterns of health care costs associated with depression and substance abuse in a national sample. Psychiatric Services, 50(2), 214–218. https://doi.org/10.1176/ps.50.2.214
- Estabrooks, A., Jo, T., & Japkowicz, N. (2004). A multiple resampling method for learning from imbalanced data sets. Computational Intelligence, 20(1), 18–36. https://doi.org/10.1111/j.0824-7935.2004.t01-1-00228.x
- Friedman, J., Hastie, T., & Tibshirani, R. (2010). Regularization paths for generalized linear models via coordinate descent. Journal of Statistical Software, 33(1). https://doi.org/10.18637/jss.v033.i01
- Gillan, C. M., & Whelan, R. (2017). What big data can do for treatment in psychiatry. Current Opinion in Behavioral Sciences, 18, 34–42. https://doi.org/10.1016/j.cobeha.2017.07.003
- Guo, P., Zeng, F., Hu, X., Zhang, D., Zhu, S., Deng, Y., & Hao, Y. (2015). Improved variable selection algorithm using a LASSO-type penalty, with an application to assessing hepatitis B infection relevant factors in community residents. PloS One, 10(7), e0134151. https://doi.org/10.1371/journal.pone.0134151
- Hand, D. J., & Vinciotti, V. (2003). Local versus global models for classification problems. The American Statistician, 57(2), 124–131. https://doi.org/10.1198/0003130031423
- Hatchett, G. T., Han, K., & Cooker, P. G. (2002). Predicting premature termination from counseling using the Butcher Treatment Planning Inventory. Assessment, 9(2), 156–163. https://doi.org/10.1177/10791102009002006
- He, H., & Garcia, E. A. (2009). Learning from imbalanced data. IEEE Transactions on Knowledge and Data Engineering, 21(9), 1263–1284. https://doi.org/10.1109/TKDE.2008.239
- Horner, M. S., & Diamond, D. (1996). Object relations development and psychotherapy dropout in borderline outpatients. Psychoanalytic Psychology, 13(2), 205–223. https://doi.org/10.1037/h0079648
- Huibers, M. J. H., Cohen, Z. D., Lemmens, L. H. J. M., Arntz, A., Peeters, F. P. M. L., Cuijpers, P., & DeRubeis, R. J. (2015). Predicting optimal outcomes in cognitive therapy or interpersonal psychotherapy for depressed individuals using the personalized advantage index approach. PloS One, 10(11), e0140771. https://doi.org/10.1371/journal.pone.0140771
- Iniesta, R., Stahl, D., & McGuffin, P. (2016). Machine learning, statistical learning and the future of biological research in psychiatry. Psychological Medicine, 46(12), 2455–2465. https://doi.org/10.1017/S0033291716001367
- Japkowicz, N., & Stephen, S. (2002). The class imbalance problem: A systematic study1. Intelligent Data Analysis, 6(5), 429–449. https://doi.org/10.3233/IDA-2002-6504
- Jeni, L. A., Cohn, J. F., & La Torre, F. D. (2013). Facing imbalanced data recommendations for the use of performance metrics. International Conference on Affective Computing and Intelligent Interaction and Workshops: [proceedings]. ACII (Conference), 2013, 245–251. https://doi.org/10.1109/ACII.2013.47
- Jiao, W., Atwal, G., Polak, P., Karlic, R., Cuppen, E., Danyi, A., Ridder, J. D., van Herpen, C., Lolkema, M. P., Steeghs, N., Getz, G., Morris, Q., & Stein, L. D. (2020). A deep learning system accurately classifies primary and metastatic cancers using passenger mutation patterns. Nature Communications, 11(1), 728. https://doi.org/10.1038/s41467-019-13825-8
- Kalayeh, H. M., & Landgrebe, D. A. (1983). Predicting the required number of training samples. IEEE Transactions on Pattern Analysis and Machine Intelligence, 5(6), 664–667. https://doi.org/10.1109/TPAMI.1983.4767459
- Karterud, S., Pedersen, G., Bjordal, E., Brabrand, J., Friis, S., Haaseth, O., Haavaldsen, G., Irion, T., Leirvåg, H., Tørum, E., & Urnes, O. (2003). Day treatment of patients with personality disorders: Experiences from a Norwegian treatment research network. Journal of Personality Disorders, 17(3), 243–262. https://doi.org/10.1521/pedi.17.3.243.22151
- Kaur, H., Pannu, H. S., & Malhi, A. K. (2020). A systematic review on imbalanced data challenges in machine learning. ACM Computing Surveys, 52(4), 1–36. https://doi.org/10.1145/3343440
- Kessler, R. C., Bossarte, R. M., Luedtke, A., Zaslavsky, A. M., & Zubizarreta, J. R. (2019). Machine learning methods for developing precision treatment rules with observational data. Behaviour Research and Therapy, 120, 103412. https://doi.org/10.1016/j.brat.2019.103412
- Kim, S.-Y. (2009). Effects of sample size on robustness and prediction accuracy of a prognostic gene signature. BMC Bioinformatics, 10(1), 147. https://doi.org/10.1186/1471-2105-10-147
- King, E. N., & Ryan, T. P. (2002). A preliminary investigation of maximum likelihood logistic regression versus exact logistic regression. The American Statistician, 56(3), 163–170. https://doi.org/10.1198/00031300283
- King, G., & Zeng, L. (2001). Logistic regression in rare events data. Political Analysis, 9(2), 137–163. https://doi.org/10.1093/oxfordjournals.pan.a004868
- Kolb, D. L., Beutler, L. E., Davis, C. S., Crago, M., & Shanfield, S. B. (1985). Patient and therapy process variables relating to dropout and change in psychotherapy. Psychotherapy: Theory, Research, Practice, Training, 22(4), 702–710. https://doi.org/10.1037/h0085556
- Kroenke, K., Spitzer, R. L., & Williams, J. B. (2001). The PHQ-9: Validity of a brief depression severity measure. Journal of General Internal Medicine, 16(9), 606–613. https://doi.org/10.1046/j.1525-1497.2001.016009606.x
- Kroenke, K., Spitzer, R. L., Williams, J. B. W., Monahan, P. O., & Löwe, B. (2007). Anxiety disorders in primary care: Prevalence, impairment, comorbidity, and detection. Annals of Internal Medicine, 146(5), 317–325. https://doi.org/10.7326/0003-4819-146-5-200703060-00004
- Kubat, M., & Matwin, S. (1997). Addressing the curse of imbalanced training sets: OneSided selection. Proceedings of the 14th International Conference on Machine Learning, ICML, Nashville, TN, U.S.A, 179–186.
- Kuhn, M. (2008). Building predictive models in R using the caret package. Journal of Statistical Software, 28(5). https://doi.org/10.18637/jss.v028.i05
- Lawrence, S., Burns, I., Back, A., Tsoi, A. C., & Giles, C. L. (1998). Neural Network Classification and Prior Class Probabilities, 1998, 299–313. https://doi.org/10.1007/3-540-49430-8_15
- Li, Z.-C., Bai, H., Sun, Q., Zhao, Y., Lv, Y., Zhou, J., Liang, C., Chen, Y., Liang, D., & Zheng, H. (2018). Multiregional radiomics profiling from multiparametric MRI: Identifying an imaging predictor of IDH1 mutation status in glioblastoma. Cancer Medicine, 7(12), 5999–6009. https://doi.org/10.1002/cam4.1863
- Lorenzo-Luaces, L., & DeRubeis, R. J. (2018). Miles to go before we sleep: Advancing the understanding of psychotherapy by modeling complex processes. Cognitive Therapy and Research, 42(2), 212–217. https://doi.org/10.1007/s10608-018-9893-x
- Luedtke, A., Sadikova, E., & Kessler, R. C. (2019). Sample size requirements for multivariate models to predict between-patient differences in best treatments of major depressive disorder. Clinical Psychological Science, 7(3), 445–461. https://doi.org/10.1177/2167702618815466
- Lunardon, N., Menardi, G., & Torelli, N. (2014). ROSE: A package for binary imbalanced learning. The R Journal, 6(1), 79. https://doi.org/10.32614/RJ-2014-008
- Luque, A., Carrasco, A., Martín, A., & las Heras, A. D. (2019). The impact of class imbalance in classification performance metrics based on the binary confusion matrix. Pattern Recognition, 91, 216–231. https://doi.org/10.1016/j.patcog.2019.02.023
- Lutz, W., Deisenhofer, A.-K., Rubel, J., Bennemann, B., Giesemann, J., Poster, K., & Schwartz, B. (2021). Prospective evaluation of a clinical decision support system in psychological therapy. Journal of Consulting and Clinical Psychology, 90(1), 90–106. https://doi.org/10.1037/ccp0000642
- Lutz, W., Jong, K. D., & Rubel, J. (2015). Patient-focused and feedback research in psychotherapy: Where are we and where do we want to go? Psychotherapy Research, 25(6), 625–632. https://doi.org/10.1080/10503307.2015.1079661
- Lutz, W., Leach, C., Barkham, M., Lucock, M., Stiles, W. B., Evans, C., Noble, R., & Iveson, S. (2005). Predicting change for individual psychotherapy clients on the basis of their nearest neighbors. Journal of Consulting and Clinical Psychology, 73(5), 904–913. https://doi.org/10.1037/0022-006X.73.5.904
- Lutz, W., Rubel, J. A., Schwartz, B., Schilling, V., & Deisenhofer, A.-K. (2019). Towards integrating personalized feedback research into clinical practice: Development of the Trier Treatment Navigator (TTN). Behaviour Research and Therapy, 120, 103438. https://doi.org/10.1016/j.brat.2019.103438
- Lutz, W., Schwartz, B., & Delgadillo, J. (2021). Measurement-based and data-informed psychological therapy. Annual Review of Clinical Psychology, 18(1), 71–98. https://doi.org/10.1146/annurev-clinpsy-071720-014821
- Lutz, W., Schwartz, B., Hofmann, S. G., Fisher, A. J., Husen, K., & Rubel, J. A. (2018). Using network analysis for the prediction of treatment dropout in patients with mood and anxiety disorders: A methodological proof-of-concept study. Scientific Reports, 8(1), 7819. https://doi.org/10.1038/s41598-018-25953-0
- Maher, M. J., Huppert, J. D., Chen, H., Duan, N., Foa, E. B., Liebowitz, M. R., & Simpson, H. B. (2010). Moderators and predictors of response to cognitive-behavioral therapy augmentation of pharmacotherapy in obsessive-compulsive disorder. Psychological Medicine, 40(12), 2013–2023. https://doi.org/10.1017/S0033291710000620
- Makridakis, S., Spiliotis, E., & Assimakopoulos, V. (2018). Statistical and machine learning forecasting methods: Concerns and ways forward. PloS One, 13(3), e0194889. https://doi.org/10.1371/journal.pone.0194889
- McCarthy, K., Zabar, B., & Weiss, G. (2005). Does cost-sensitive learning beat sampling for classifying rare classes?, 69–77. https://doi.org/10.1145/1089827.1089836
- McMurran, M., Huband, N., & Overton, E. (2010). Non-completion of personality disorder treatments: A systematic review of correlates, consequences, and interventions. Clinical Psychology Review, 30(3), 277–287. https://doi.org/10.1016/j.cpr.2009.12.002
- Menardi, G., & Torelli, N. (2014). Training and assessing classification rules with imbalanced data. Data Mining and Knowledge Discovery, 28(1), 92–122. https://doi.org/10.1007/s10618-012-0295-5
- Mohammed, M., Mwambi, H., Mboya, I. B., Elbashir, M. K., & Omolo, B. (2021). A stacking ensemble deep learning approach to cancer type classification based on TCGA data. Scientific Reports, 11(1), 15626. https://doi.org/10.1038/s41598-021-95128-x
- Mukherjee, S., Tamayo, P., Rogers, S., Rifkin, R., Engle, A., Campbell, C., Golub, T. R., & Mesirov, J. P. (2003). Estimating dataset size requirements for classifying DNA microarray data. Journal of Computational Biology, 10(2), 119–142. https://doi.org/10.1089/106652703321825928
- Mundt, J. C., Marks, I. M., Shear, M. K., & Greist, J. H. (2002). The work and social adjustment scale: A simple measure of impairment in functioning. British Journal of Psychiatry, 180(5), 461–464. https://doi.org/10.1192/bjp.180.5.461
- National IAPT Team. (2015). National curriculum for the education of psychological wellbeing practitioners (Third edition). NHS England/Department of Health.
- NICE. (2011). Common mental health disorders: Identification and pathways to care. CG123. National Institute for Health and Care Excellence. Int Rev Psychiatry.
- Nigam, K., Mccallum, A. K., Thrun, S., & Mitchell, T. (2000). Text classification from labeled and unlabeled documents using EM. Machine Learning, 39(2/3), 103–134. https://doi.org/10.1023/A:1007692713085
- Owen, A. B. (2007). Infinitely imbalanced logistic regression. Journal of Machine Learning Research, 2007(8), 761–773.
- Pearson, R., Pisner, D., Meyer, B., Shumake, J., & Beevers, C. G. (2019). A machine learning ensemble to predict treatment outcomes following an Internet intervention for depression. Psychological Medicine, 49(14), 2330–2341. https://doi.org/10.1017/S003329171800315X
- Sainsbury Centre for Mental Health. (2003). The economic andsocial costsof mental illness. Sainsbury Centre for Mental Health.
- Schwartz, B., Cohen, Z. D., Rubel, J. A., Zimmermann, D., Wittmann, W. W., & Lutz, W. (2020). Personalized treatment selection in routine care: Integrating machine learning and statistical algorithms to recommend cognitive behavioral or psychodynamic therapy. Psychotherapy Research, 31(1), 33–51. https://doi.org/10.1080/10503307.2020.1769219
- Stekhoven, D. J., & Bühlmann, P. (2012). Missforest–non-parametric missing value imputation for mixed-type data. Bioinformatics (Oxford, England), 28(1), 112–118. https://doi.org/10.1093/bioinformatics/btr597
- Sung, H., Ferlay, J., Siegel, R. L., Laversanne, M., Soerjomataram, I., Jemal, A., & Bray, F. (2021). Global cancer statistics 2020: Globocan estimates of incidence and mortality worldwide for 36 cancers in 185 countries. CA: A Cancer Journal for Clinicians, 71(3), 209–249. https://doi.org/10.3322/caac.21660
- Swift, J. K., & Greenberg, R. P. (2012). Premature discontinuation in adult psychotherapy: A meta-analysis. Journal of Consulting and Clinical Psychology, 80(4), 547–559. https://doi.org/10.1037/a0028226
- Swift, J. K., Greenberg, R. P., Tompkins, K. A., & Parkin, S. R. (2017). Treatment refusal and premature termination in psychotherapy, pharmacotherapy, and their combination: A meta-analysis of head-to-head comparisons. Psychotherapy (Chicago, Ill.), 54(1), 47–57. https://doi.org/10.1037/pst0000104
- Tam, V. H., Kabbara, S., Yeh, R. F., & Leary, R. H. (2006). Impact of sample size on the performance of multiple-model pharmacokinetic simulations. Antimicrobial Agents and Chemotherapy, 50(11), 3950–3952. https://doi.org/10.1128/aac.00337-06
- Tibshirani, R. (1996). Regression shrinkage and selection via the lasso. Journal of the Royal Statistical Society: Series B (Methodological), 58(1), 267–288. https://doi.org/10.1111/j.2517-6161.1996.tb02080.x
- Wallace, B. C., & Dahabreh, I. J. (2014). Improving class probability estimates for imbalanced data. Knowledge and Information Systems, 41(1), 33–52. https://doi.org/10.1007/s10115-013-0670-6
- Webb, C. A., Cohen, Z. D., Beard, C., Forgeard, M., Peckham, A. D., & Björgvinsson, T. (2020). Personalized prognostic prediction of treatment outcome for depressed patients in a naturalistic psychiatric hospital setting: A comparison of machine learning approaches. Journal of Consulting and Clinical Psychology, 88(1), 25–38. https://doi.org/10.1037/ccp0000451
- Weiss, G. M. (2004). Mining with rarity: A unifying framework. ACM SIGKDD Explorations Newsletter, 6(1), 7–19. https://doi.org/10.1145/1007730.1007734
- Weiss, G. M. (2013). Foundations of imbalanced learning. In H. He & Y. Ma (Eds.), Imbalanced learning: Foundations, algorithms, and applications (pp. 13–42). Wiley IEEE Press.
- Weiss, G. M., & Provost, F. (2001). The effect of class distribution on classifier learning: an empirical study. Technical Report, ML-TR-44, Department of Computer Science, Rutgers University, New Jersey.
- Zimmermann, D., Rubel, J., Page, A. C., & Lutz, W. (2017). Therapist effects on and predictors of non-consensual dropout in psychotherapy. Clinical Psychology & Psychotherapy, 24(2), 312–321. https://doi.org/10.1002/cpp.2022