
 ?Mathematical formulae have been encoded as MathML and are displayed in this HTML version using MathJax in order to improve their display. Uncheck the box to turn MathJax off. This feature requires Javascript. Click on a formula to zoom.
ABSTRACT
Across most Western societies, trends towards increased ethnic intermarriage have been observed across the second half of the twentieth century. Whether such trends hold across the multi-ethnic society of Russia is not known. We analyze Russian census data and describe levels and trends in ethnic intermarriage in four highly different Russian cities. We find no change in ethnic intermarriage in Moscow, but more intermarriage in younger cohorts in the other three cities where the populations are more ethnically heterogeneous. Levels and trends in ethnic intermarriage vary substantially throughout Russia by locality and ethnic group. Our study highlights how trends in intermarriage can vary within a society, and how the local, historical context may play an important role.
Introduction
Who marries whom is a classic issue in the study of ethnic relations; intermarriage rates are seen as important indicators of the social distance between groups, of the interactions between groups, and also of the strength of ethnic boundaries or identities more generally (Drachsler Citation1921; Gordon Citation1964; Kalmijn and Van Tubergen Citation2010). Some relations have received lots of attention such as Black-White marriage in the US (Schwartz Citation2013), or, more recently, intermarriage of “natives” and migrant groups in Western Europe (Hannemann et al. Citation2018; Drouhot and Nee Citation2019). A central idea in this literature is that with modernization, especially in the form of educational expansion and urbanization, ethnic groups tend to open up and boundaries become less rigid (Schwartz Citation2013; Alba and Foner Citation2015; Drouhot and Nee Citation2019). Hence, intermarriage rates go up, both in absolute and relative terms. In other words, if one were to predict trends in ethnic intermarriage, overall one would expect a tendency towards openness, for most groups, in most places, across the last half century.
Does this expectation hold for Russia? Intermarriage in Russia has not received much attention recently. During Soviet times a number of studies published in Russian examined changes in marriage rates between groups. While much of this was driven by Soviet ideology – the communist ideal where ethnicity was no longer relevant and the mixing of the different peoples in the Soviet Union that stretched beyond the Russian Federation – Russia is an inherently interesting case for ethnic intermarriage as it has long been a multi-ethnic state. Within this large federal state, we find variations in the relations between ethnic Russians, the Russian state, and other ethnic groups. Does the seemingly universal trend towards more intermarriage hold across Russia too, or does it depend on the local context? We address this question by analyzing census data from four highly distinct cities in Russia.
Ethnic intermarriage in Russia
According to the latest Russian census (2010), Russia is populated by almost 200 ethnic groups; 41 of them number over 100,000 people. However, ethnic intermarriage in Russia has received surprisingly little attention in the recent literature. Part of the reason for this is data availability. Research on intermarriage requires large sample sizes, and in fact, the main data source for high-quality research in this area is census data or surveys with very large samples. Getting access to and working with these data is possible, but it is less straightforward than with traditional survey data and requires more effort.
The first census after WWII was conducted in the USSR in 1959, followed by the censuses in 1970, 1979, and 1989. Except for 1989, primary data from these censuses have never been available to researchers outside of the Soviet statistical office (USSR State Committee on Statistics). Soviet demographers published several studies of ethnic intermarriage, mainly reporting the percentages of mixed marriages in the USSR as a whole and separately in Soviet republics (Susokolov Citation1987; Volkov Citation[1989] 2014; see Gorenburg Citation2006 for a comprehensive review). The main finding was an increase in ethnic intermarriage. In the Russian Federation, in 1959 8.3% of all households were ethnically mixed; in 1970 this number increased to 10.7%, in 1979 to 12%, and in 1989 to 14.7% (Volkov Citation[1989] 2014; Botev Citation2002).Footnote1 Some of these early analyses also looked at gender asymmetry in intermarriage across ethnic groups, stated ethnicity of children in ethnically mixed families, and ethnic intermarriage as a measure of social distance between ethnic groups (Volkov Citation[1989] 2014).
Botev (Citation2002) analyzed the 5% sample from the 1989 census using log-linear models, a method that is common in the intermarriage literature and that allows researchers to account for the ethnic population structure and model joint distributions of intermarriage by ethnic group and several other predictors.Footnote2 Ethnic Russians were the least endogamous group, while Chechens, Jews, and Bashkirs were most endogamous. Intermarriage varied across four macro-regions, which is not surprising given geographical differences in the ethnic population structure and historical legacies. Endogamy decreased over time, with the younger people most likely to intermarry, although this trend was less consistent in Western Russia (mostly including ethnic Russian heartlands with a predominantly ethnic Russian population) compared to other macro-regions.
In post-Soviet Russia, there were two censuses, in 2002 and 2010, with the next one scheduled for 2021. The data were available to researchers mostly in official publications as cross-tabulations at the national and regional levels; data on intermarriage were not published. However, recently the Russian statistical office (the Federal State Statistics Service) provided access to individual-level census data (see details below in the data section), making the analysis of ethnic intermarriage possible. We are aware of only one publication that used this opportunity (Soroko Citation2014; also see Soroko Citation2018). In this paper, Soroko provided data on the percentage of ethnically mixed marriages in Russia as a whole and separately by ethnic group. In 2010, 12% of all marriages in Russia were ethnically mixed. Note a decrease in this percentage compared to 1989 (14.7%), although the 1989 data refer to ethnically mixed households rather than couples and the numbers are not directly comparable. He also looked at gender asymmetry in intermarriage across ethnic groups and calculated a matrix of distances between ethnic groups, based on the differences between the observed frequencies in the contingency table of marital partners’ ethnicities and the frequencies expected under the condition of independence. Time trends in intermarriage and the differences across cohorts were not analyzed.
A number of studies examined ethnic intermarriage in the former Soviet states that during the Soviet period experienced high in-migration of ethnic Russians. In post-Soviet Latvia, intermarriage between ethnic Russians and Latvians increased (Monden and Smits Citation2005; also see Kronenfeld Citation2005), while in Estonia the intermarriage rates between ethnic Russians and Estonians remained constant (Van Ham and Tammaru Citation2011; Puur et al. Citation2018). Kozlov (Citation2017) analyzed distances between ethnic groups in Kazakhstan and Estonia, but not time trends in intermarriage. While the findings in these states cannot be extended to Russia, the difference in trends between Latvia and Estonia suggests that local and historical context may have a significant impact.
Research design
One of the central questions in the intermarriage literature is to what extent a decrease in ethnic endogamy can be explained by structural factors (such as migration or urbanization that increase contact between members of different ethnic groups) and by changing preferences of marital partners (Kalmijn Citation1998). It is difficult to separate these factors empirically and even conceptually. More frequent contact between ethnic groups may contribute to the change in preferences (this is the central argument of Allport’s contact hypothesis),Footnote3 whereas changing preferences may trigger higher migration.
The studies of intermarriage in Russia mostly looked at the country as a whole or split it into several macro-regions. This is problematic because many ethnic groups are very unevenly spread across Russia. Chechens constitute 95% of Chechnya’s population, and their opportunities for interethnic contact are much more limited there compared to Chechens living in other Russia’s regions. Using Russia’s federal regions as units of analysis hardly solves this problem. For example, in the Republic of Tatarstan, the population in some areas in the north is over 90% ethnically Tatar, whereas in some southern areas ethnic Russians are a majority. Thus, the analysis of intermarriage at the aggregated regional level would confuse the effects of opportunities for interethnic contact and preferences of marital partners from particular ethnic groups.
To address this problem, we look at intermarriage trends at the city level. Arguably, people living in the same city have a higher probability of contact, although this is also affected by ethnic residential segregation and the ethnic structure of social networks. Even given these limitations, we argue that trends of intermarriage at the city level better reflect changes in preferences of marital partners rather than simply opportunities for interethnic contact. To exclude immigrant couples (who made their marital choice in a different context), we include in the sample only locally born women.
Four cities, four distinct cases
We focus on four cities – Moscow, Kazan, Makhachkala, and Vladikavkaz – that represent four distinct cases. Moscow is a mostly ethnically Russian city, the capital of the Russian Federation located in the ethnic Russian heartland. We compare it with three cities in the titular ethnic republics: Kazan (Tatarstan; Muslim indigenous population, contentious relations with the Russian state going back to the sixteenth century), Makhachkala (Dagestan; Muslim indigenous population, more recent contentious relations with the Russian state starting in the eighteenth and nineteenth centuries), and Vladikavkaz (North Ossetia; mostly Orthodox Christian indigenous population, more amicable relations with the Russian state). Below we provide brief information about each case to justify their selection.
Moscow
Moscow (population 12.6 million, 2019) is not only Russia’s capital and the largest city but also historically the founding city of the Russian state. It is located in the ethnic Russian heartland (as opposed to colonized territories) and is mostly populated by ethnic Russians. According to the 2010 census, 92% of the city’s population is Russian. However, this number is probably overestimated and Moscow is also home to many other ethnic groups, some of them of recent immigrant origin and poorly accounted in the census data. The largest ethnic minorities are Tatars and Ukrainians, as well as ethnic groups from Central Asia and the Caucasus.
Kazan
Kazan (population 1.2 million, 2019) is the capital of the Republic of Tatarstan in the Volga region. In the Middle Ages, it was the center of the Kazan khanate, conquered by the Russian state in the sixteenth century. At that time, Kazan was populated by mostly Muslim ethnic groups of Turkic and Finno-Ugric origin (Romaniello Citation2012). After the initial slaughter of the conquered city, the Russian state started colonizing the region, and by the end of the nineteenth century, the population was more or less equally divided between ethnic Russians and Tatars. According to the 1897 census, 74% of Kazans population spoke Russian and 22% spoke Tatar as their mother tongue. The proportion of Tatars in the city’s population increased during the Soviet period, mostly because of migration from the countryside, and in the 2010 census, 49% of the population self-identified as ethnic Russian and 48% as Tatar. Most Tatars are Muslim, although many do not practice religion actively (Lehmann Citation1997) and adhere to a more “tolerant” Tatar version of Islam (Yusupova Citation2016).
Makhachkala
Makhachkala (population 0.6 million, 2019) is the capital of the Republic of Dagestan in the North Caucasus, bordering Azerbaijan and Georgia. Dagestan is a uniquely ethnically and linguistically diverse region. It is home to over 30 different ethnic groups, each with their own language (Comrie Citation2008). About half of Daghestan’s territory is mountainous, populated since early Neolithic time by ethnic groups from the Nakh-Daghestanian linguistic family. According to genetic research, these groups (Avars, Dargins, Lezgins, Laks, etc.), although descending from a common origin about 6,000 years ago, have been genetically isolated from each other for a very long time and have a very low level of within- and a high level of between-population genetic diversity (Karafet et al. Citation2016). The plains in the north of Dagestan are home to Kumyks and Nogais, two Turkic ethnic groups who emerged in Dagestan in the Middle Ages. Dagestan also has communities of Azeris, Chechens, ethnic Russians, and Mountain Jews (who moved to the region in the early Middle Ages from Persia).
The Russian state conquered Dagestan in the nineteenth century, overcoming fierce resistance of the locals in a military campaign that lasted for almost 50 years. Makhachkala was founded as a Russian fortress called Petrovsk in 1844 and was renamed Makhachkala in 1921 (Ware and Kisriev Citation2014). Originally the city’s population was mostly ethnically Russian; but the proportion of ethnic Russians has been decreasing since the 1960s as the city population increased. In 1959, 51% of Makhachkala’s population were ethnic Russians, compared to 38% in 1970, 21% in 1989, and 5% in 2010. Over the same period, the population of the city grew from 120,000 in 1959 to 600,000 in 2019, both because of high birth rates and migration from the villages in the mountains that intensified during the post-Soviet period (Eldarov et al. Citation2007). The main ethnic groups in the city’s population now are Avars, Kumyks, Dargins, Lezgins, and Laks. The majority of Dagestanis are Sunni Muslims, and Islam generally plays a greater role in Makhachkala than in Kazan (Ware and Kisriev Citation2014).
Traditionally, Dagestani ethnic groups are characterised by very high endogamy. Karafet et al. (Citation2016) note that the high levels of genetic isolation of native ethnic groups can only be explained by many generations of endogamous marriages, usually concluded within the same clan and village. In an early study of ethnic intermarriage in Makhachkala, Evstigneev (Citation1972) showed some increase in ethnic intermarriage in the 1950 s and 1960 s, albeit from a very low base. In 1940, not a single woman from indigenous Dagestani groups in Makhachkala entered an ethnically mixed marriage.
Vladikavkaz
Vladikavkaz (population 0.3 million, 2019) is another city in the North Caucasus and the capital of the Republic of North Ossetia.Footnote4 The Ossetians are descendants of the Alans, an Iranian speaking people who began to settle in the Caucasus around the first century BC (Nasidze et al. Citation2004; Forsyth Citation2013). Unlike most peoples in the North Caucasus who are Muslim, most Ossetians are Orthodox Christians.Footnote5 Perhaps as a consequence of belonging to the same religion, Ossetians were treated favorably by the Russian imperial administration and in the late eighteenth century many Ossetian communities willingly swore allegiance to Russia (Forsyth Citation2013). Vladikavkaz was founded in 1784 as a Russian military outpost. North Ossetia was the only part of the North Caucasus where a system of Russian-language schools was established by the early twentieth century; currently, many Ossetians speak Russian as their first language. According to an expert assessment, North Ossetia is “the most favourable place for Russians in the North Caucasus” (Galyapina and Lebedeva Citation2016, 24).
Similar to Makhachkala, originally ethnic Russians were the majority in Vladikavkaz, while most Ossetians lived in the countryside and in smaller towns. According to the 1897 census, 66% of the population of Vladikavkaz were Russian speakers. In 1959 the proportion of ethnic Russians was 59%. By 1970 their share in the population of Vladikavkaz decreased to 49%, further dropping to 36% in 1989, 28% in 2002, and 25% in 2010. The share of Ossetians in 2010 was 64%. Between 1959 and 2019, the population of the city roughly doubled.
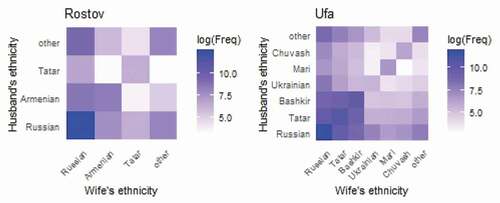
In the online Appendix, we present data and analysis for two more cities: Rostov (a mostly ethnically Russian city with trends in intermarriage similar to Moscow) and Ufa (the capital of the Republic of Bashkortostan with a mixed Russian/Tatar/Bashkir population and with trends similar to Kazan). These two cities have been excluded from the main text to simplify the narrative.
Data
Our data come from the most recent Russian census, conducted in 2010.Footnote6 We made use of access to individual-level census data provided by Russia’s the Federal State Statistics Service via a web API.Footnote7 The data include complete records from the census; a small number of observations were randomly added to the cells of generated contingency tables for anonymization purposes. Theoretically, researchers could request any number of variables, but in practice, the IT system could not handle requests for large data volumes. Therefore, we limited our requests to three variables for each city: the ethnicity of wives and husbands and the age of wives.
The census question on ethnicity was based on self-identification and was open-ended so that people who were interviewed could provide any response. Our data include both married and cohabiting couples. The data do not distinguish marriages from cohabitations, and for the sake of brevity we use the term “marriage” for both. We limited the data to the couples in which wives (but not necessarily husbands) were born locally. The justification for this was excluding immigrant couples who got married elsewhere, thus focussing the study on local marriage markets. Following this logic, we kept in the data immigrant men married to locally born women.
Russian census data have some known biases, such as undercounting of newborn children, double counting of internal migrants, etc. (Andreev Citation2012). Data collection was organized as face-to-face interviews at the place of residence, and non-response rates were high, especially in Moscow. When interviewers could not obtain a response, they were allowed to enter information from housing registration data. The result of this was undercounting of recent immigrants (mostly from Ukraine and Central Asian states), many of whom were not registered. For example, the 2010 census counted about 300,000 Uzbeks and 200,000 Tajiks in Russia, while police data concerning the number of foreign passport-holders for December 2012 (based on migration cards completed while crossing the Russian border) included 2.3 million Uzbek nationals and 1.1 million Tajik nationals (Bessudnov Citation2016). This problem was likely to be more severe in Moscow, where immigrants constituted a larger share of the population, and less severe in other regions, for ethnic groups that were indigenous or represented earlier immigration waves, and for older cohorts.
For each city, we have a contingency table with three variables: the ethnicities of husband and wife, and wife’s age. We keep as separate categories the ethnic groups that numbered over 3,000 locally born women in Moscow and over 1,000 women in the other three cities, recoding the remaining ethnic groups as “other.” Wife’s age is a categorical variable with three levels: 16 to 35 years, 36 to 50 years, and over 50 years.
The main purpose of this paper is to study trends in ethnic intermarriage, and we use wife’s age to approximate marriages and cohabitations started in different periods. This is a rough proxy, and incidence measures of intermarriage (i.e. registration data by year) would be preferred to prevalence measures (based on the current stock of marriages) (Kalmijn Citation1998). However, incidence data are not available for Russia, and prevalence data from the census are the only data source available to study ethnic intermarriage in Russia, especially at the local level. The sample sizes in household surveys such as the Russian Longitudinal Monitoring Survey are not large enough for this purpose. As usual, prevalence data introduce some bias to the study of intermarriage, such as selective divorce. It is possible that the probability of divorce is higher for ethnically heterogeneous than ethnically endogenous couples. We discuss later how these limitations could affect our findings.
Measures and statistical modeling
As a measure of ethnic endogamy, we report both the percentages of people married within their ethnic group and logged odds ratios, a measure that is independent from the population shares of ethnic groups (Kalmijn Citation1998). Odds ratios can be calculated for the chances of a member of an ethnic group marrying within the group rather than outside the group; larger odds ratios indicate stronger endogamy.
We can also calculate the odds ratio for two specific groups (for example, of an ethnically Russian man marrying a Russian rather than a Ukrainian woman, as compared to the odds of a Ukrainian man marrying a Russian rather than a Ukrainian woman). In this case, larger odds ratios indicate less intermarriage and more social distance between two groups.
For two ethnic groups A and B, the odds ratio is
i.e. the product of the numbers of ethnically homogeneous marriages divided by the product of the numbers of ethnically heterogeneous marriages between two groups. Since odds ratios for intermarriage can be quite large, it is easier to use logged odds ratios.
To introduce the third variable in the analysis, wife’s age, we apply log-linear models. To model whether the association between wife’s and husband’s ethnicities is independent from wife’s age, we fit the constant intermarriage model:
where W is wife’s ethnicity, H is husband’s ethnicity, and A is wife’s age.
To test whether there is a time trend in intermarriage, we apply unidiff models, originally developed for social mobility research (Goldthorpe and Erikson Citation1992; Xie Citation1992). These models assume that the strength of the association between marital partners’ ethnicities changes over time, but the change between two periods can be described by one parameter (in other words, the pattern of association remains stable over time, but the strength of the association changes uniformly across all cells of the contingency table). The unidiff model takes the following form:
where the parameter is the unidiff coefficient for wife’s age A.
When selecting between different specifications of log-linear and log-multiplicative (such as unidiff) models it is customary to test whether the difference in the fit across two models is statistically significant according to a likelihood-ratio test. This approach does not work well with census data with a large number of observations, as even minor and trivial improvements in the model fit will be statistically significant. The Bayesian Information Criterion (BIC) that partially solves this problem by penalizing for adding extra parameters in the model has several shortcomings (Weakliem Citation1999) and, perhaps more importantly, does not have an intuitively clear interpretation. We report these criteria, but our preferred tool for model selection is the dissimilarity index (Δ), a measure that varies from 0 to 1 and represents the proportion of cases that need to be moved to a different cell for the model to fit perfectly. The dissimilarity index is a measure of practical rather than statistical significance, and “with huge samples, it is better to focus on estimation rather than hypothesis testing” (Agresti Citation2013, 352). With population data, this statement is even more relevant.
We analyze the data for each city separately.
Results
Ethnic endogamy and intermarriage
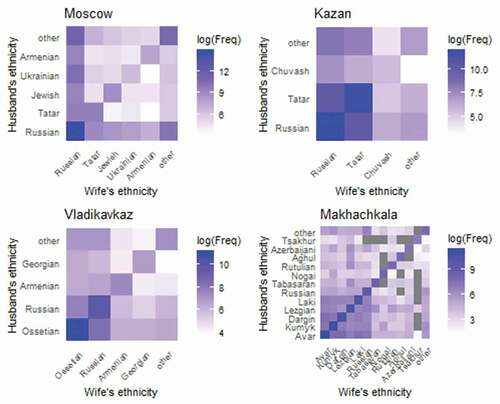
We begin by presenting the distribution of marriages by ethnic group in four cities as heat maps in . The heat maps also help us visualize the ethnic structure of the cities’ populations. In Moscow, endogamous marriages between ethnic Russians are by far most frequent. In Kazan, where the population is split about equally between ethnic Russians and Tatars, most people marry within their ethnic groups (cases on the main diagonal), but intermarriages between ethnic Russians and Tatars are also numerous. In Vladikavkaz, we observe a similar pattern for Ossetians and ethnic Russians, although ethnic intermarriages seem to be less frequent compared to Kazan. Finally, in Makhachkala, the heat map is dominated by the cases on the main diagonal, indicating a very high propensity for ethnic endogamy.
Figure 1. Distribution of marriages by ethnic group in the four cities
In we report the percentages married within their ethnic group, separately for men and women, and the odds ratios for ethnic endogamy (calculated as the ratio of the odds to marry within the ethnic group vs. all other groups).
Table 1. Percentages of endogamous marriages and odds ratios for ethnic endogamy
In Moscow over 90% of ethnic Russians married endogamously, which is not surprising given that they are by far the largest ethnic group. However, when we look at the odds ratio for ethnic endogamy, a measure that is independent from the ethnic population structure, we see that ethnic Russians in Moscow had a lower propensity for ethnic endogamy than Tatars, Jews, or Armenians, although a higher propensity compared to Ukrainians (only 2% of Ukrainian men and 17% of Moscow-born Ukrainian women were married to other Ukrainians).
In Kazan, about 20% of the ethnic Russian and Tatar populations are intermarried, and the odds ratios for endogamy are lower in Kazan than in Moscow for both ethnic groups. We also observe considerable intermarriage between Ossetians and ethnic Russians in Vladikavkaz, although the odds ratios for endogamy are higher there than in Kazan. Finally, in Makhachkala, despite the ethnic diversity of the city’s population, for most ethnic groups around 90% of all marriages are endogamous. As an extreme example of ethnic endogamy, Tsakhur women only constitute around 0.3% of Makhachkala’s population, and yet 95% of them are married to Tsakhur men.
also shows gender asymmetry in intermarriage across ethnics groups. But these results are difficult to interpret substantively, as our data exclude couples where women were not born locally.
In the online Appendix, we report pairwise symmetric odds ratios between all ethnic groups in all the cities. These data can be interpreted as a measure of social distance between the groups.
Change in ethnic endogamy over time
Next, we explore how ethnic endogamy changed over time. There are two approaches to how this task can be implemented. In we look at how the percentages of men and women in endogamous marriages changed across the three birth cohorts (for women aged 16 to 35, 36 to 50, and over 50 at the time of the 2010 census). The assumption is that marriages and cohabitations for these three cohorts started in different periods. Of course, there are many deviations from this assumption. Younger cohorts may have started cohabiting later than older cohorts. Some women from the older cohorts married more recently, and divorce rates could vary for endogamous and interethnic couples. However, even given all these limitations and sources of potential bias, large changes in the odds ratios across the three cohorts are highly likely to reflect time trends in intermarriage.
Table 2. Percentage of endogamous marriages by age of wife (selected ethnic groups)
We can see that in Moscow the percenatage of ethnic Russians married to other ethnic Russians remained stable (94% for women and 98% for men in our data set). In Kazan this percentage changed from 87% in the oldest cohort to 76% in the youngest cohort for women and from 88% to 79% for men. Looking at the percentages for ethnic Russians and Ossettians in Vladikavkaz we can also observe a trend towards greater intermarriage. Ethnic endogamy remains very high in Makhachkala across all birth cohorts, but the percentage of exogamous marriages is somewhat higher in the youngest cohort for the largest ethnic groups.
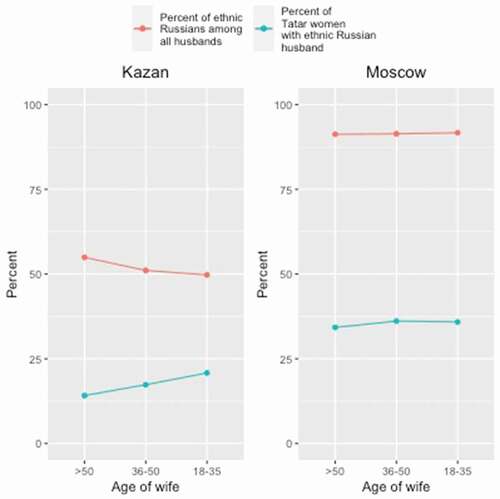
However, this approach can be misleading as the percentage of endogamous marriages strongly depends on the share of an ethnic group in the population, and this can be changing across cohorts. illustrates this issue using an example of Tatar–Russian intermarriage in Moscow and Kazan. Tatar women of all ages who live in Moscow have a higher probability of being married to an ethnic Russian man, but the share of ethnic Russians in Moscow is much higher than in Kazan. In Kazan, the proportion of Tatar women with ethnic Russian husbands increased in the youngest cohort compared to the older cohorts, but at the same time the share of ethnic Russians in the population decreased. Had this share remained stable, the proportion of intermarriaed Tatar women in the youngest group would have been even higher.
Figure 2. Percentage of Tatar women with ethnic Russian husbands in Moscow and Kazan
To overcome this problem with interpretation, we also employ another measure of intermarriage and look at the odds ratios for ethnic endogamy. shows log odds ratios for ethnic endogamy for three cohorts. The trends in odds ratios vary across four cities. In Moscow, the odds ratios are constant for ethnic Russians, slightly decreased in younger cohorts for Tatars, and increased over time for Jews and Armenians. For these two groups (and for a lesser extent, for Ukrainians) the chances of intermarrying decreased over time.
Figure 3. Change in ethnic endogamy across three birth cohorts. Log odds ratios are shown with 95% confidence intervals
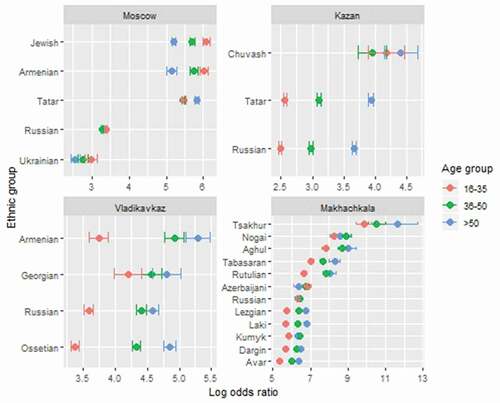
Contrary to this, in Kazan and Vladikavkaz, we observe a strong trend towards more intermarriage in younger cohorts. Both for ethnic Russians and Tatars in Kazan, and for ethnic Russians and Ossetians in Vladikavkaz, the chances of marrying outside their own group increased over time. In Makhachkala the trend is similar. Younger people are relatively more likely to be married outside their own group, although ethnic endogamy remains very high even in younger cohorts. However, the trend towards greater intermarriage applies only to the indigenous Dagestani ethnic groups, and not to ethnic Russians, for whom the odds ratios for endogamy are the same across all three cohorts.
To test this more formally, we applied log-linear and log-multiplicative models, as described in the previous section. We show the results in . For each city, we fitted two models: the constant intermarriage model that implies no change in the odds of intermarriage across three cohorts and the unidiff model that allows for change across the cohorts, but implies a uniform pattern of change in the local odds ratios that is described by a single parameter for each cohort. We then report deviance (G2), BIC, and dissimilarity index for each model, and the deviance and p-values coming from the likelihood-ratio tests comparing the unidiff vs. constant intermarriage models.
Table 3. Log-linear and log-multiplicative models for intermarriage
As already noted, working with the census data means that all statistical tests are likely to return statistically significant results, and parsimonious models will be rejected. Indeed, according to both the likelihood ratio tests and BIC, the unidiff model shows a better fit for all four cities. The constant intermarriage model provides a reasonably good fit for Moscow, where it misclassifies only about 0.2% of the cases. The unidiff model improves the fit only marginally, further reducing the percentage of misclassified cases to 0.15%. Contrary to this, in the other three cities the constant intermarriage model does less well, misclassifying 3% of cases in Kazan and Vladikavkaz and 2% in Makhachkala, while the unidiff models improve the fit by reducing the proportion of misclassified cases to under 1%.
To illustrate this further, we show the coefficients from the unidiff models in . The oldest cohort is our reference group, and for Kazan, Vladikavkaz, and Makhachkala the strength of the association between men and women’s ethnicities decreases in younger cohorts. In Moscow, the pattern is different and the unidiff coefficients do not show a trend towards more intermarriage in younger cohorts.
Figure 4. Unidiff coefficients for the four cities
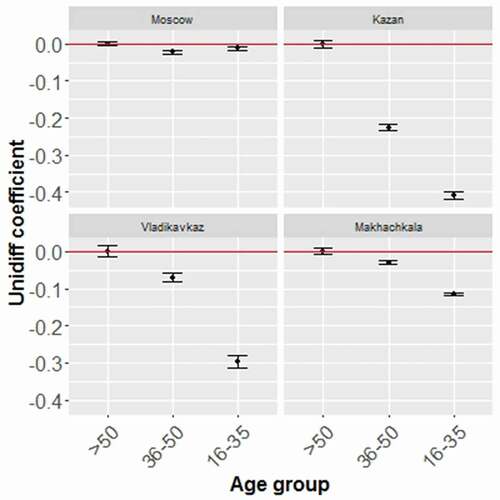
We conclude that in Moscow the constant intermarriage model describes the data well, while in the other three cities the unidiff model clearly provides a better fit.
Limitations
Some limitations of this study need to be acknowledged. First, there might be some bias from selective migration patterns. In particular, mixed couples in older cohorts could be more likely to leave ethnic republics between the 1960 s and 2010 s (especially in Makhachkala and Vladikavkaz), so that endogamy in older cohorts could be exaggerated. Second, the probability of divorce can be higher for intermarried couples, and that would introduce downward bias in estimating intermarriage in older cohorts. The divorce differential would have to be exceptionally high to produce these results. It would not explain the lack of a trend in Moscow. These two limitations are a consequence of using the prevalence data on intermarriage. Incidence measures of intermarriage would be preferred, but we are not aware of incidence data for Russia currently available for academic research.
In the Russian census people can only identify as having one particular ethnicity, even if their parents were a mixed couple. People may have mixed or hierarchical identities, and may change ethnic identity depending on the context. Defining a person as belonging to only one ethnic group potentially distorts the analysis when children from mixed marriages who identify as ethnic Russians (and there are more of them in the younger generations) get married to a non-ethnically Russian person (Gorenburg Citation2006). Members of some ethnic groups (such as Ukrainians) may be more likely to assimilate into ethnic Russians and self-identify as Russians; however, this would not constitute a limitation for our study if ethnicity is seen as a self-ascribed rather than inborn characteristic.
The absence in our data of recent labor migrants is another potential concern, in particular for Moscow. The 2010 Russian census poorly represented recent migration waves, mostly from Central Asia. There is no data at the moment to quantify the intermarriage between new immigrants and local residents, but it is unlikely to significantly affect the trends we documented (both in Moscow and in particular other cities where the scale of migration was much smaller).
Overall, while acknowledging these limitations, we believe that they are not strong enough to explain away the patterns we have documented.
Discussion and conclusion
In this paper we document trends in ethnic intermarriage in four Russian cities. Our general conclusion from this analysis is that there is no universal trend for ethnic intermarriage in Russia. We observe specific local trends in our four cases, driven by the ethnic composition of the populations, history of interethnic relations, and religious differences between ethnic groups.
When considering intermarriage, we need to take into account both the baseline odds ratios for endogamy and the trend. In Moscow, a mostly ethnically Russian city, ethnic Russians are relatively open to intermarriage, with the log odds ratio (OR) for endogamy of about 3.3. Although one needs to be careful when comparing odds ratios across different countries and ethnic groups, we can draw some international parallels, although at the national rather than city level. For Britain, Muttarak and Heath (Citation2010; calculated from Table AII) reported the log OR of 6.2 for White British with data aggregated for 1988–2006. In the United States, the log OR for endogamy for Whites was about 7 in 1980 and 4.5 in 2005 (Rosenfeld Citation2008, ). This comparison should come with a warning, however, as research on intermarriage in the USA and Britain involved data from multiple time points whereas our data are cross-sectional and we rely on a comparison across the birth cohorts to investigate time trends, with all the limitations that this approach involves.
In the USA, the increase in intermarriage reflects the erosion of racial barriers in the twentieth century, mostly starting from the 1960 s (Rosenfeld Citation2008). In Western Europe, it shows greater acceptance of (often non-White) immigrants from outside of Europe, especially in the second generation (Drouhot and Nee Citation2019). In Moscow, the non-ethnically Russian groups are mostly White and some of them (such as Ukrainians) are culturally close to ethnic Russians, often sharing the same language and religion. The main ethnic minorities (Armenians, Jews, Tatars, Ukrainians) originate either in other Russian regions or in former Soviet republics and have a long history of co-existence with ethnic Russians in the Russian Empire and the USSR. The Soviet state from its very origins promoted ethnic mixing (Gorenburg Citation2006). Moscow did experience mass immigration from perhaps more culturally distant Central Asian states in the late 2000 s and 2010 s, but this is not reflected in the 2010 census data we used. While the USA and Western Europe originally had low levels of intermarriage between White and non-White groups that have improved since the 1960 s, in Moscow, because of the lower social distance between ethnic Russians and other groups, odds ratios for endogamy for ethnic Russians have always been lower and there was only limited room for further change.
Another factor is the attitudes of ethnic Russians in Moscow towards other ethnic groups, which vary from more positive for the groups of European origin (such as Ashkenazi Jews or Ukrainians) to more negative for the groups of Southern origin (such as Armenians or Uzbeks) (Bessudnov Citation2016; Bessudnov and Shcherbak Citation2020). These factors explain both the relative openness of ethnic Russians in Moscow to intermarriage and the lack of a trend towards more intermarriage over time.
For Jews and Armenians in Moscow endogamy is fairly high, and it increased in younger generations. It is hard to interpret these findings without qualitative data, but perhaps we observe some strengthening in the ethnic and cultural identity of these groups in the post-Soviet period. Contrary to this, the endogamy for Ukrainians in Moscow is very low (even lower than for ethnic Russians), although with some tendency to increase slightly in younger generations. Given the cultural proximity between these two groups, it may indicate a greater probability of assimilation of Ukrainians who live in Russia into Russians. For Tatars, endogamy in Moscow is at about the same levels as for Jews and Armenians, with some decrease between the oldest (on the one hand) and the middle and youngest (on the other) generations.
Rostov, another mostly ethnically Russian city, shows results that are similar to Moscow (the data for Rostov are presented in the online Appendix). Ethnic Russians here have low endogamy (log OR = 3.1, about the same as in Moscow) that does not change across generations. The two largest minorities, Tatars and Armenians, have higher endogamy that has been stable for Armenians and decreased for Tatars in the youngest generation.
Other two cities, Kazan and Vladikavkaz, demonstrate different dynamics of ethnic intermarriage. Both cities are capitals of titular ethnic republics, with mixed ethnically Russian and non-Russian populations (Tatar in Kazan, Ossetian in Vladikavkaz). In both cases, we observe a decrease in endogamy both for ethnic Russians and titular ethnic groups across three generations. In Kazan, endogamy is lower than in Vladikavkaz, despite Tatars being Muslim (although many are non-practicing) and Ossetians Orthodox Christian. Having a less traditional society and a longer history of being part of the Russian state in Kazan (compared to Vladikavkaz) seems to be more important for intermarriage in the Russian context than religious differences. In Kazan in the youngest generation the log OR for endogamy both for ethnic Russians and Tatars is about 2.5 (in Vladikavkaz about 3.5 both for ethnic Russians and Ossetians). This can be compared with the Latvian case where intermarriage between Latvians and ethnic Russians increased in the post-Soviet period, with the log OR for Russian-Latvian marriages of about 2.7 in the early 2000 s (Monden and Smits Citation2005). The data for another capital of a titular ethnic republic, Ufa, confirm these findings (presented in the online Appendix). There we also observe a decrease in endogamy in younger generations, both for ethnic Russians and other ethnic groups (Tatars and Bashkirs).
Makhachkala, our fourth case, exhibits a different trend. The capital of Dagestan, an ethnic republic with a mostly Muslim population and often conservative social attitudes and customs, has traditionally had very high endogamy. There we do observe more intermarriage in younger cohorts as well, but mostly between indigenous Muslim ethnic groups, rather than with ethnic Russians. This may reflect the creation of a stronger pan-Dagestani (rather than ethnic) identity (Eldarov et al. Citation2007) that, however, may not necessarily include ethnic Russians.
More in-depth qualitative studies may be necessary to interpret these trends in intermarriage,Footnote8 and it is hard to do this having only the statistical data on trends. We need to know more about social mechanisms driving intermarriage in younger generations in Russia’s ethnic republics. Urbanization and the rapid increase in titular ethnic urban population in regions’ capitals may be an important factor, as well as the expansion of the educational system and the Russian language as the main language of communication for non-ethnically Russian groups.
What do these findings mean for inter-ethnic relations in Russia more generally? In the USA and Western Europe racial and ethnic intermarriage is seen as a measure of assimilation (Waters and Jiménez Citation2005; Drouhot and Nee Citation2019). The Russian context is clearly different. Unlike in the United States and Europe, the ethnic groups we considered in this study are not immigrants or their descendants, but have been part of the Russian state for centuries, often populating their titular regions where they either constitute a numerical majority or a signifcant minority and the rights to their language and culture are protected (at least to a certain extent). However, even in this context intermarriage can be seen as a measure of social and cultural distance between ethnic groups. We can hypothesize that increased intermarriage reduces the potential for ethnic conflict (Smits Citation2010).
The general conclusion to this paper is that no general conclusions that would apply to all ethnic groups in Russia are appropriate. Perhaps except for Ukrainians living in Russia (with their extremely high rates of intermarriage), there is no immediate threat of assimilation for any of the ethnic groups we considered. Even in Kazan and Vladikavkaz where we documented a trend towards greater intermarriage, in the younger generation 77% of Tatar women and 91% of Ossettian women are married endogamously. However, 23% of Tatar women in mixed marriages with ethnic Russians is a significant number, and the ethnic identity of their children deserves a separate study. It is not the aim of this paper to study the children born in ethnically mixed marriages, but they are probably more likely to speak Russian as their mother tongue, in some contexts identify as ethnic Russians, etc.
Makhachkala is very different: there remains a very strong barrier for the intermarriages between native Dagestanis and ethnic Russians. Our study does not include Grozny, the capital of Chechnya, but we can assume with a high degree of confidence that endogamy is even higher there, reflecting not only local tradition but also a greater social and cultural distance between Muslims from the North Caucasus and ethnic Russians.
Data availability
The data and replication code for this study are publicly available within the Open Science Framework (https://osf.io/jrft3/) and on Github (https://github.com/abessudnov/ruIntermarriagePublic).
Notes
1. Note that these data refer to the percentages of ethnically mixed households rather than couples.
2. Botev looked at four macro-regions in Russia, birth cohort, and settlement type.
3. See Allport (Citation1954) and Pettigrew and Tropp (Citation2006).
4. During much of the Soviet period the city was named Ordzhonikidze.
5. Christianity was adopted by the Alans in the tenth century and further re-introduced in the late eighteenth century by the Russian Orthodox Church.
6. The next census was originally scheduled for 2020, but was postponed until October 2021. Individual-level data will not be available to researchers until 2024 at the earliest.
7. See https://vpnmicrodata.gks.ru/webapi/; at the time of writing this paper, the website was undergoing technical maintenance.
8. See as an example a study of Kyrgyz–Russian marriages in rural Kyrgyzstan by Pelkmans and Umetbaeva (Citation2018).
References
- Agresti, Alan. 2013. Categorical Data Analysis. 3rd ed. Hoboken, NJ: John Wiley and Sons.
- Alba, Richard D., and Nancy Foner. 2015. Strangers No More: Immigration and the Challenges of Integration in North America and Western Europe. Princeton, NJ: Princeton University Press.
- Allport, Gordon W. 1954. The Nature of Prejudice. Cambridge, MA: Addison-Wesley Publishing Company.
- Andreev, Evgeny. 2012. “On the Precision of Russian Census Data and Trust to Different Data Sources.” Voprosy Statistiki 11: 21–35. (in Russian).
- Bessudnov, Alexey. 2016. “Ethnic Hierarchy and Public Attitudes Towards Immigrants in Russia.” European Sociological Review 32 (5): 567–580. doi:https://doi.org/10.1093/esr/jcw002.
- Bessudnov, Alexey, and Andrey Shcherbak. 2020. “Ethnic Discrimination in Multi-Ethnic Societies: Evidence from Russia.” European Sociological Review 36 (1): 104–120.
- Botev, Nikolai. 2002. “The Ethnic Composition of Families in Russia in 1989: Insights into the Soviet ‘Nationalities Policy.’.” Population and Development Review 28 (4): 681–706. doi:https://doi.org/10.1111/j.1728-4457.2002.00681.x.
- Comrie, Bernard. 2008. “Linguistic Diversity in the Caucasus.” Annual Review of Anthropology 37: 131–143. doi:https://doi.org/10.1146/annurev.anthro.35.081705.123248.
- Drachsler, Julius. 1921. Intermarriage in New York City : A Statistical Study of the Amalgamation of European Peoples. New York: Columbia University.
- Drouhot, Lucas G., and Victor Nee. 2019. “Assimilation and the Second Generation in Europe and America: Blending and Segregating Social Dynamics between Immigrants and Natives.” Annual Review of Sociology 45: 177–199. doi:https://doi.org/10.1146/annurev-soc-073117-041335.
- Eldarov, Eldar M., Edward C. Holland, Sharafudin M. Aliyev, Zaid M. Abdulagatov, and Zagir V. Atayev. 2007. “Resettlement and Migration in Post-Soviet Dagestan.” Eurasian Geography and Economics 48 (2): 226–248. doi:https://doi.org/10.2747/1538-7216.48.2.226.
- Evstigneev, Yu A. 1972. “Ethnically Mixed Marriages in Makhachkala.” Soviet Sociology 11 (3–4): 369–381. doi:https://doi.org/10.2753/SOR1061-0154110304369.
- Forsyth, James. 2013. The Caucasus: A History. Cambridge: Cambridge University Press.
- Galyapina, Victoria N., and Nadezhda M. Lebedeva. 2016. “Is Multiculturalism in Russia Possible? Intercultural Relations in North Ossetia-Alania.” Psychology in Russia: State of the Art 9 (1): 24–40.
- Goldthorpe, John, and Robert Erikson. 1992. The Constant Flux: A Study of Class Mobility in Industrial Societies. Oxford: Clarendon Press.
- Gordon, Milton Myron. 1964. Assimilation in American Life: The Role of Race, Religion, and National Origins. New York: Oxford University Press.
- Gorenburg, Dmitry. 2006. “Rethinking Interethnic Marriage in the Soviet Union.” Post-Soviet Affairs 22 (2): 145–165. doi:https://doi.org/10.2747/1060-586X.22.2.145.
- Hannemann, Tina, Hill Kulu, Leen Rahnu, Allan Puur, Mihaela Hărăguş, Ognjen Obućina, Amparo González-Ferrer, et al. 2018. “Co-ethnic Marriage versus Intermarriage among Immigrants and Their Descendants: A Comparison across Seven European Countries Using Event-History Analysis.” DemographicResearch 39 (September): 487–524.
- Kalmijn, Matthijs. 1998. “Intermarriage and Homogamy: Causes, Patterns, Trends.” Annual Review of Sociology 24: 395–421. doi:https://doi.org/10.1146/annurev.soc.24.1.395.
- Kalmijn, Matthijs, and Frank Van Tubergen. 2010. “A Comparative Perspective on Intermarriage: Explaining Differences among National-Origin Groups in the United States.” Demography 47 (2): 459–479. doi:https://doi.org/10.1353/dem.0.0103.
- Karafet, Tatiana M., Kazima B. Bulayeva, Johanna Nichols, Oleg A. Bulayev, Farida Gurgenova, Jamilia Omarova, Levon Yepiskoposyan, Olga V. Savina, Barry H. Rodrigue, and Michael F. Hammer. 2016. “Coevolution of Genes and Languages and High Levels of Population Structure among the Highland Populations of Daghestan.” Journal of Human Genetics 61 (3): 181–191. doi:https://doi.org/10.1038/jhg.2015.132.
- Kozlov, V.A. 2017. “Kazakhstan and Estonia: Evaluation of Preferences in Intermarriages.” Population and Economy 1 (1): 71–88. (in Russian). doi:https://doi.org/10.3897/popecon.1.e36033.
- Kronenfeld, Daniel A. 2005. “The Effects of Interethnic Contact on Ethnic Identity: Evidence from Latvia.” Post-Soviet Affairs 21 (3): 247–277. doi:https://doi.org/10.2747/1060-586X.21.3.247.
- Lehmann, Susan Goodrich. 1997. “Islam and Ethnicity in the Republics of Russia.” Post-Soviet Affairs 13 (1): 78–103. doi:https://doi.org/10.1080/1060586X.1997.10641433.
- Monden, Christiaan W.S., and Jeroen Smits. 2005. “Ethnic Intermarriage in Times of Social Change: The Case of Latvia.” Demography 42 (2): 323–345. doi:https://doi.org/10.1353/dem.2005.0015.
- Muttarak, Raya, and Anthony Heath. 2010. “Who Intermarries in Britain? Explaining Ethnic Diversity in Intermarriage Patterns.” The British Journal of Sociology 61 (2): 275–305. doi:https://doi.org/10.1111/j.1468-4446.2010.01313.x.
- Nasidze, Ivan, Dominique Quinque, Isabelle Dupanloup, Sergey Rychkov, Oksana Naumova, Olga Zhukova, and Mark Stoneking. 2004. “Genetic Evidence Concerning the Origins of South and North Ossetians.” Annals of Human Genetics 68 (6): 588–599. doi:https://doi.org/10.1046/j.1529-8817.2004.00131.x.
- Pelkmans, Mathijs, and Damira Umetbaeva. 2018. “Stuff of Boundaries? Kyrgyz–Russian Marriages and the Actualization of Ethnic Difference.” History and Anthropology 29 (5): 541–562. doi:https://doi.org/10.1080/02757206.2018.1555708.
- Pettigrew, Thomas F., and Linda R. Tropp. 2006. “A Meta-analytic Test of Intergroup Contact Theory.” Journal of Personality and Social Psychology 90 (5): 751–783. doi:https://doi.org/10.1037/0022-3514.90.5.751.
- Puur, Allan, Leen Rahnu, Luule Sakkeus, Martin Klesment, and Liili Abuladze. 2018. “The Formation of Ethnically Mixed Partnerships in Estonia: A Stalling Trend from A Two-Sided Perspective.” Demographic Research 38: 1111–1154. doi:https://doi.org/10.4054/DemRes.2018.38.38.
- Romaniello, Matthew P. 2012. The Elusive Empire: Kazan and the Creation of Russia, 1552–1671. Madison: University of Wisconsin Press.
- Rosenfeld, Michael J. 2008. “Racial, Educational, and Religious Endogamy in the United States: A Comparative Historical Perspective.” Social Forces 87 (1): 1–31. doi:https://doi.org/10.1353/sof.0.0077.
- Schwartz, Christine R. 2013. “Trends and Variation in Assortative Mating: Causes and Consequences.” Annual Review of Sociology 39: 451–470. doi:https://doi.org/10.1146/annurev-soc-071312-145544.
- Smits, Jeroen. 2010. “Ethnic Intermarriage and Social Cohesion. What Can We Learn from Yugoslavia?” Social Indicators Research 96 (3): 417–432. doi:https://doi.org/10.1007/s11205-009-9485-y.
- Soroko, Eugeny. 2014. “Ethnically Mixed Families in the Russian Federation.” Demographic Review 1 (4): 96–123. (in Russian).
- Soroko, Eugeny. 2018. “Ethnic Population Structure and Interethnic Marriages in Russia according to Census Data.” In Russia’s Population 2016.S.V.Zakharov(eds.)24th Annual Demographic Report, 160–185. Moscow: Higher School of Economics (in Russian).
- Susokolov, A.A. 1987. Interethnic Marriages in the USSR. Moscow: Mysl (in Russian).
- Van Ham, Maarten, and Tiit Tammaru. 2011. “Ethnic Minority–Majority Unions in Estonia.” European Journal of Population/Revue Européenne de Démographie 27 (3): 313–335. doi:https://doi.org/10.1007/s10680-011-9236-z.
- Volkov, A.G. [1989] 2014. Selected Papers on Demography. Moscow: Higher School of Economics (in Russian).
- Ware, Robert Bruce, and Enver Kisriev. 2014. Dagestan: Russian Hegemony and Islamic Resistance in the North Caucasus. London: M.E.Sharpe. .
- Waters, Mary C., and Tomás R. Jiménez. 2005. “Assessing Immigrant Assimilation: New Empirical and Theoretical Challenges.” Annual Review of Sociology 31: 105–125. doi:https://doi.org/10.1146/annurev.soc.29.010202.100026.
- Weakliem, David L. 1999. “A Critique of the Bayesian Information Criterion for Model Selection.” Sociological Methods & Research 27 (3): 359–397. doi:https://doi.org/10.1177/0049124199027003002.
- Xie, Yu. 1992. “The Log-Multiplicative Layer Effect Model for Comparing Mobility Tables.” American Sociological Review 57 (3): 380–395. doi:https://doi.org/10.2307/2096242.
- Yusupova, Guzel. 2016. “The Islamic Representation of Tatarstan as an Answer to the Equalization of the Russian Regions.” Nationalities Papers 44 (1): 38–54. doi:https://doi.org/10.1080/00905992.2015.1061983.
Appendix.
Data for Rostov and Ufa
In the appendix we present the data and analysis for two more cities, Rostov and Ufa.
Rostov. Rostov (population 1.1 million, 2019) is a city in the South of European Russia. Founded in 1749, it has mostly ethnically Russian population (90%). The largest minority group are Armenians who lived in the city since the late eighteenth century.
Ufa. Ufa (population 1.1. million, 2019) is the capital of the ethnic republic of Bashkortostan in the Volga region, next to the republic of Tatarstan. The titular ethnic group in Bashkortostan are Bashkirs, a Muslim group that in many respects is similar to Tatars. Unlike Tatars, however, historically Bashkirs were nomads; Ufa was founded in 1574 as a Russian fortress. Nowadays the population of the city includes ethnic Russians (49%), Tatars (28%), and Bashkirs (17%).
Figure A1. Distribution of marriages by ethnic group in Rostov and Ufa.
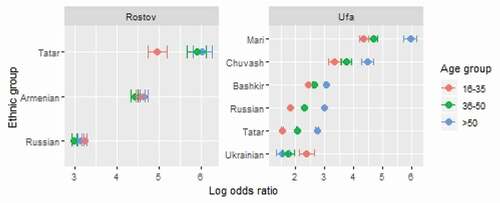
Figure A2. Change in ethnic endogamy across three birth cohorts in Rostov and Ufa. Log odds ratios shown with the 95% confidence intervals.
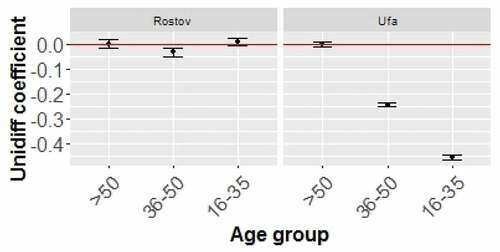
Figure A3. Unidiff coefficients for Rostov and Ufa.
Table A1. Percentages of endogamous marriages and odds ratios for ethnic endogamy in Rostov and Ufa
Table A2. Log-linear and log-multiplicative models for intermarriage in Rostov and Ufa
The analysis shows that in Rostov, similar to Moscow, there was no change in the propensity for ethnic intermarriage across three cohorts. Contrary to this, in Ufa, similar to Kazan, the probability of ethnic intermarriage significantly increased in younger cohorts.
Symmetric odds ratios for six cities
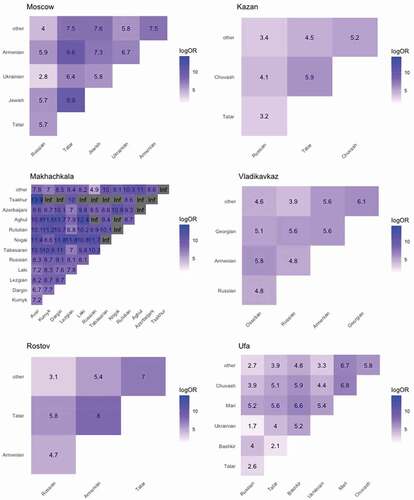
The plot below reports pairwise symmetric odds ratios for ethnic intermarriage in six cities. These odds ratios can be interpreted as a measure of social distance between the ethnic groups.
Moscow. We observe low social distance between ethnic Russians and Ukrainians. The highest social distance is between Tatars and Armenians, and Tatars and Jews.
Kazan’. The social distance between ethnic Russians and Tatars is relatively low, while Chuvashes are more endogamous.
Makhachkala. The odds ratios demonstrate a very high level of endogamy for all groups, and especially for smaller groups. Lezgians have relatively lower social distance with other groups from the South of Daghestan (Tabasaran, Rutul, Aghul, Azeri).
Vladikavkaz. The social distance between all four major ethnic groups (Ossetians, Russians, Armenians, and Georgians) is approximately the same, although Georgians seem to be somewhat more endogamous.
Rostov. The social distance between Russians and Armenians is lower than in Moscow.
Ufa. Note a very low social distance between Tatars and Bashkirs, and between Russians and Ukrainians. The odds ratio for the Russian/Tatar intermarriage is low (and much lower than in other cities, except Kazan’), but is higher for the Russian/Bashkir intermarriage. Chuvashes and especially Mari are more endogamous.
Figure B1. Pairwise symmetric odds ratios for ethnic intermarriage in six cities.