
Abstract
Nanoparticulate systems can passively target regional lymphatic vessels and lymph nodes (LNs) after interstitial administration. Highly sensitive non-invasive imaging techniques, such as magnetic resonance imaging (MRI), can take advantage from particles’ lymphotropic properties to provide a reliable tool to monitor lymphatic function and LN morphology with high spatial resolution. In this work, we developed and characterised a bioerodible nanosystem with MRI contrast properties, based on poly(ethylene glycol)-alendronate stabilised gadolinium calcium phosphate nanoparticles (NPs). After foot paw injection in mice, the particles exhibited a distinct pattern of gradual uptake into the local lymphatics and a localised deposition in the popliteal LN. Less variability in the onset of the signal, intensity and localisation was observed compared to the commercially available tracer gadobutrol, suggesting that these NPs could be useful to monitor physiological and dysfunctional lymphatic conditions. Moreover, dissolution of the particles indicated that they would be rapidly cleared from the body after imaging. Nevertheless, our findings call for an improvement of the system that includes reduction of gadolinium leakage from the NPs, and decrease in size of the latter to increase their selective uptake by the LN.
Introduction
The lymphatic system consists of a network of vessels and nodes that spreads throughout the whole body and plays an essential role in bodily fluids homeostasis and immune response. It is now well established that several pathological conditions, including infections, chronic inflammation and cancer, are associated with structural and functional alterations of this system. In particular, much attention has been recently focussed on tumour-promoted lymphangiogenesis, and the importance of lymphatic vasculature for the spreading of metastatic cancer cells [Citation1–3].
Considering the multiple implications of the lymphatic system in the body, various non-invasive methods have thus been developed to monitor the lymphatic vessels’ architecture and function under physiological and pathological states. Among them, magnetic resonance imaging (MRI) is a powerful and clinically validated technique that offers high sensitivity and spatial resolution for the structural and functional observation of soft tissues [Citation4,Citation5]. However, the currently used MRI probes, such as T1 contrast agents based on Gd(III) complexes, cannot easily access lymphatic vessels and lymph nodes (LNs) via the conventional intravenous administration. Interstitial injection, such as subcutaneous, intradermal or intraperitoneal, of MRI tracers represents an efficacious approach to specifically target both lymphatic vessels and LNs at a lower dose than the one required for IV infusion [Citation6]. Nevertheless, the major drawbacks of conventional MRI molecules are the rapid diffusion in tissues, the low retention into the lymphatic capillaries, the high leakage into the blood circulation and the fast renal excretion, resulting in low tissue-specificity and in inadequate sensitivity. Recent studies have pointed out the influence of particles size in controlling the rate of lymphatic passive targeting after local injection [Citation7,Citation8]. Draining lymphatic microvessels have indeed a distinct structure consisting of a highly permeable non-fenestrated single layer of endothelial cells with numerous pores and clefts, which favour lymphatic uptake and retention of nanoparticulate and macromolecular systems (generally larger than 10 nm in diameter) over penetration into blood capillaries [Citation9]. Consequently, several particulate systems have been developed in the last decades to address the lymphatics and improve LNs deposition of MRI tracers, including dendrimers [Citation10], liposomes [Citation11,Citation12], and organic and inorganic nanoparticles (NPs) [Citation13–15].
Calcium phosphate (CaP) NPs represent a unique class of biocompatible and bioresorbable inorganic carriers [Citation16]. Due to their high adsorptive capacity for charged molecules, a variety of molecular cargos have been encapsulated in colloidal CaP, ranging from genes to small molecules for therapeutic and imaging purposes [Citation17]. Functional MRI molecules, such as dimeglumine gadopentate (Gd-DTPA) were also successfully loaded in CaP nanocarriers, despite having few charged groups available for electrostatic interactions [Citation18–20]. More specifically, organic–inorganic hybrid CaP NPs incorporating Gd-DTPA were investigated as nanoscale MRI probes for tumour diagnosis [Citation18] and for neutron capture therapy [Citation19,Citation20]. In addition to tumour-specific accumulation, the particles showed a significant contrast enhancement compared to the free Gd-DTPA tracer. One of the most critical problems of CaP NPs is their physical instability that leads to rapid aggregation upon preparation and in biological environments [Citation21]. To overcome this issue, we reported that PEG-bisphosphonate conjugates can be used as stabilising agents to prevent particles growth and to obtain NPs with sizes of 100–150 nm [Citation22,Citation23].
In this work, we developed a novel nanoparticulate system based on PEG-alendronate (PEG-Ale) stabilised CaP NPs loaded with Gd-DTPA, for imaging of the LN passive targeting via magnetic resonance. The Gd-DTPA/CaP NPs were injected in the foot paw of mice, and their ability to visualise the popliteal LN was compared with that of a commercial solution of Gd-DTPA (gadobutrol, Gadovist®).
Materials and methods
Materials
Ale sodium trihydrate was purchased from Tokyo Chemical Industry Co., Ltd. (Tokyo, Japan). Cobalt thiocyanate was obtained from Siegfried (Zofingen, Switzerland). Gadobutrol (Gadovist®, 1.0 mmol mL−1) was purchased from Bayer HealthCare Pharmaceuticals (Whippany, NJ). All other chemicals were obtained from Sigma-Aldrich (Buchs, Switzerland). Sephadex G-25 PD 10 desalting columns were from GE Healthcare life science (Chalfont St. Giles, UK). J774.2 murine macrophages were purchased from America Type Culture Collection (ATCC, Manassas, VA). Dulbecco’s modified Eagle medium (DMEM) with GlutaMAX™ (high glucose), phenol red-free DMEM, foetal bovine serum (FBS), penicillin/streptomycin stock solution (10,000 units mL−1 penicillin and 10,000 µg mL−1 streptomycin) and phosphate buffered saline (PBS) for cell culture were obtained from Life Technologies (Carlsbad, CA). CellTiter 96 AQueous One Non-Radioactive Cell Proliferation Assay based on 3-(4,5-dimethylthiazol-2-yl)-5-(3-carboxymethoxyphenyl)-2-(4-sulfophenyl)-2H-tetrazolium (MTS) was from Promega (Dübendorf, Switzerland). Male CD1 mice (8 weeks, 30–35 g) were purchased from Charles River (Wilmington, MA).
Synthesis and characterisation of PEG-Ale coating agent
The synthesis of the PEG-Ale derivative was adapted from Miron and Wilchek [Citation24]. Briefly, N,N′-disuccinimidyl carbonate (93.9 mg, 0.37 mmol, 3 eq.) was suspended in 15 mL dichloromethane, followed by dropwise addition of methoxy-PEG (mPEG-OH, Mn ≈ 5000 g/mol, 610.9 mg, 0.12 mmol, 1 eq.) in DCM (2 mL). Triethylamine (51.4 µL, 0.37 mmol, 3 eq.) was added to the reaction mixture under nitrogen atmosphere. The suspension quickly dissolved into a pale yellow solution, and the reaction mixture was stirred at room temperature (RT) for 24 h. The solvents were then evaporated under reduced pressure and the crude product was purified by precipitation in diethyl ether (three times). The white solid was collected by precipitation and dried under vacuum for 3 d, to obtain the intermediate mPEG-succinimidyl carbonate (mPEG-SC, 505.4 mg, 81.8%). Proton nuclear magnetic resonance (1H NMR) spectra were acquired on a Bruker Av400 spectrometer (Bruker BioSpin, Fällanden, Switzerland) operating at 400 MHz. 1H NMR (400 MHz; CDCl3): δ 4.44 (m, 2H), 3.81–3.44 (m, 450H), 3.36 (s, 3H), 2.82 (s, 4H).
Ale sodium trihydrate (250 mg) was dissolved in 800 µL NaOH 1 M, followed by addition of 1 mL ultrapure water, and the pH was adjusted to 9 with 1 N HCl. mPEG-SC (50 mg, 9.7 µmol) was dissolved in 200 µL ultrapure water and added dropwise to the Ale solution. The reaction mixture was stirred for 1 h on ice and for 1 h at RT, and the final product was purified from free Ale by size exclusion chromatography using a Sephadex G-25 PD 10 desalting column and ultrapure water as eluent. Cobalt thiocyanate staining was used to identify the PEG-containing fractions, as described previously [Citation22]. The fractions containing PEG-Ale only were combined and freeze-dried to obtain the final product (41.9 mg, 81.4%). 1H NMR (400 MHz; D2O): δ 4.13 (m, 2H), 3.82–3.43 (m, 450H), 3.31 (s, 3H), 3.07 (m, 2H), 1.94–1.69 (m, 4H). Matrix-assisted laser desorption/ionisation mass spectrometry (MALDI-TOF MS) was performed using Bruker’s UltraFlex II system with Compass 1.5 control software. MALDI-TOF-MS: Calculated for mPEG5000-Ale monosodium salt m/z = 5304.97, found: 5165.15.
Preparation of Gd-DTPA/CaP NPs
Gd-DTPA-loaded CaP NPs were prepared following a previously described co-precipitation method [Citation23]. One volume of a 250-mM CaCl2 solution in 10 mM TRIS buffer was quickly mixed with an equivalent volume of 140 mM NaCl, 1.5 mM Na2HPO4 and 50 mM HEPES containing 4 mM Gd-DTPA, under vigorous stirring. Immediately after particles formation, one volume of a 40 µM solution of PEG-Ale was added to stabilise the particles, and the mixture was stirred for additional 15 s. The particle suspension was hydrothermally treated (HT) at 120 °C for 20 min in an autoclave, under a pressure of 200 kPa. Purification from free Gd-DTPA and excess of Ca2+ was performed via dialysis with a Float-A-Lyzer G2 unit (5 mL, 8 kDa MWCO, Sigma-Aldrich, Buchs, Switzerland) against 100x sample volume of 25 mM HEPES (containing 2 mM CaCl2, 140 mM NaCl, pH 7.4, to mimic the electrolytes composition of interstitial fluid) for 30 h, with three buffer changes. An aliquot of 4 mL of particles was then concentrated via ultrafiltration using an Amicon device (4 mL, 4 kDa MWCO, Merck Millipore, Darmstadt, Germany) to a volume of 500 µL, and subsequently freeze-dried. For in vivo studies, the particles were resuspended in ultrapure water to minimise hypertonicity that can occur as the NPs start to dissolve. CaP NPs prepared without Gd-DTPA with HT were also used as control, as well as Gd-DTPA loaded CaP NPs without HT.
Characterisation of Gd-DTPA/CaP NPs
The particle hydrodynamic diameter and zeta potential were determined by dynamic light scattering (DLS) and laser Doppler anemometry, respectively, using a DelsaNano C particle analyser (Beckman Coulter, Krefeld, Germany). All size measurements were carried out at a fixed scattering angle of 165°. The cumulant method was used to report the measured particle size. The influence of different PEG-Ale (40, 100 and 500 µM) and NaH2PO4 concentrations (1.5, 3 and 6 mM) on the size of Gd-DTPA/CaP NPs prepared as described above was measured by DLS at 25 °C. For all the next studies, Gd-DTPA/CaP NPs were formulated with a feeding amount of 40 µM PEG-Ale and 1.5 mM H2PO4−. Changes in particles size and polidispersity index (PDI) during the whole purification process following particles fabrication was monitored by DLS at 25 °C. The degree of crystallinity of purified Gd-DTPA/CaP NPs was investigated via X-ray diffraction (XRD) analysis performed in transmission mode with the dried sample dispersed between two mylar foils, on a Stoe&Cie STADI P Powder diffractometer. A Cu Kα1 radiation was used, with a focussing Ge-Monochromator, equipped with a Dectris Mythen silicon strip detector (Dectris AG, Baden, Switzerland). To evaluate the encapsulation efficiency (EE) of Gd-DTPA in CaP NPs, freeze-dried samples were dissolved in 1% (w/v) nitric acid and the amount of Gd was measured by ICP-AES with a ICPE-9000 from Shimadzu (Kyoto, Japan). The EE was calculated according to the following equation: EE% = (Wt/Wi) × 100, where Wt is the total mass of the incorporated Gd-DTPA and Wi is the initial mass of Gd-DTPA. The Gd-DTPA loading was calculated according to the following equation: Loading% = (Wt/Wn) × 100, where Wt is the mass of the incorporated Gd-DTPA and Wn is the total mass of the NPs.
The structure and surface morphology of Gd-DTPA/CaP NPs was assessed via transmission electron microscopy (TEM), high-angle annular dark-field imaging scanning transmission electron microscopy (HAADF-STEM) and scanning electron microscopy (SEM), while the chemical composition of Gd-DTPA/CaP NPs was assessed by energy-dispersive X-ray spectroscopy (EDS). TEM and HAADF-STEM experiments were conducted on a FEI Talos F200X equipped with an X-FEG (FEI, Hillsboro, OR). An aliquot of 3 µL of the NPs suspension was loaded for 1 min on a carbon-coated copper grid that was previously negatively charged for 30 s in a glow-discharger; excess of liquid was then blotted using filter paper, the grid was rinsed twice with ultrapure water and dried on a filter paper. Images were acquired at 200 kV with a FEI CETA, 16 MP CMOS camera (FEI). For EDS elemental analysis, a Super-X EDS, 4-detector configuration (FEI) was used. For the SEM experiments, the sample was prepared in the same way as for TEM/STEM analysis, and subsequently sputter-coated with 3 nm of Pt-Pd (80%/20%) in a Bal-Tec SCD50 sputter coater (Bal-TEC, Balzers, Liechtenstein). InLens images were recorded at 5 kV on a Leo 1530 FEG SEM with a Gemini column (Zeiss, Oberkochen, Germany).
Spin–lattice (T1) relaxation times of Gd-DTPA/CaP NPs were acquired with a 7 T MRI imaging system (Pharmascan®, Bruker BioSpin, Billerica, MA). Gd-DTPA/CaP NPs resuspended in ultrapure water or equal volume of solutions of gadobutrol was placed in PCR conical tubes at Gd-DTPA concentrations of 0.1, 0.2, 0.3 and 0.4 mM. T1 measurements were performed using a Saturation Recovery sequence, with echo time (TE) of 10 ms and eight different repetition time (TR): 8000, 4000, 2000, 1200, 800, 600, 400 and 200 ms. The molecular relaxivity r1 of the paramagnetic species was calculated from the T1 (s) values according to the following equation: r1 = (1/T1)/[Gd], where 1/T1 (s−1) is the longitudinal relaxation rate in the presence of the paramagnetic species and [Gd] is the concentration of the paramagnetic compound (mM).
Physicochemical stability of Gd-DTPA/CaP NPs
The stability of Gd-DTPA/CaP NPs reconstituted in ultrapure water and stored at room temperature was measured by DLS at defined time intervals up to 30 d. In addition, particles stability in the presence of FBS-containing media was monitored by DLS for 6 h at 37 °C. For the latter, size and distribution of the particles was evaluated after dilution (1:18, v/v to a final Gd-DTPA concentration of 100 µM) in cell culture medium (DMEM with GlutaMAX™, 10% v/v FBS, 1% v/v penicillin-streptomycin solution) and in PBS/FBS (1:1, v/v).
The amount of Gd-DTPA released from Gd-DTPA/CaP NPs was measured by a standard dialysis method [Citation25]. An amount of 10 mg of freeze-dried particles were resuspended in 80 µL ultrapure water and placed in a Slide-A-Lyzer MINI Dialysis Device, 7 K MWCO (Thermo Fisher Scientific, Waltham, MA). The dialysis device was allocated inside a conical tube containing 1.5 mL of the release medium (10 mM HEPES, 140 mM NaCl, pH 7.4), and the formulation was dialysed at 37 °C on an orbital agitator (≈ 200 rpm). At regular intervals up to 24 h, 20 µL of the outer solution were sampled and replaced with fresh buffer. The aliquots were diluted in 1% (w/v) nitric acid and the concentration of Gd was measured by ICP-MS with an 8900 ICP-MS Triple Quad from Agilent Technologies (Santa Clara, CA).
Cell culture
J774.2 macrophages were cultured in DMEM with GlutaMAX™ (high glucose) supplemented with 10% v/v FBS, 100 IU/mL of penicillin and 100 µg/mL streptomycin, at 37 °C and 5% CO2. Cells were regularly tested for mycoplasma contamination and subculturing was performed twice per week by scraping the cells off the vial surface; cells were used until passage 20.
Cytotoxicity studies
The viability of cells after incubation with Gd-DTPA/CaP NPs was assessed by the MTS assay. Briefly, J774.2 cells were seeded in a 96-well plate at a density of 7000 cells/well in 100 µL complete growth medium, and were allowed to adhere for 24 h at 37 °C in a humidified atmosphere containing 5% CO2. The medium was then replaced with 100 µL of fresh growth medium containing Gd-DTPA at concentrations between 10 and 500 µM, formulated as Gd-DTPA/CaP NPs or as a saline solution (50 mM HEPES, 140 mM NaCl, pH 7.4). After 24 h incubation, the medium was removed and 120 µL of DMEM without phenol red containing the MTS reagent in the ratio 6:1 (v/v) were added. After 1 h incubation at 37 °C, the absorbance of the wells was measured at 490 nm with a plate reader (Infinite M-200, Tecan, Männedorf, Switzerland). Cell viability was determined according to the following equation: cell viability (%) = (OD490 sample/OD490 control) × 100, where OD490 sample represents the optical density of the wells treated with Gd-DTPA/CaP NPs or Gd-DTPA saline solution, and OD490 control represents the wells treated with growth medium only. Then, 1 mM H2O2 was used as positive control and wells containing only reaction mixture but no cells were used as blank.
In vivo MRI experiments
Eight-week male CD1 mice were used for the MRI experiments. The in vivo study was approved by the Italian Ministry of Health (study protocol n° 994/2016-PR of 18/10/2016) and all procedures were performed in strict compliance with European Economic Community (EEC) and Italian Guidelines for Laboratory Animal Welfare. Mice were anaesthetised under isoflurane anaesthesia (3% v/v in 1 mL/min oxygen flow) and 20 µL of Gd-DTPA/CaP NPs were injected subcutaneously in the ventral aspect of the left rear foot paw, at a concentration of 2.5 µmol Gd-DTPA equivalent/kg, using a 31 G syringe needle. As a control, gadobutrol was used at the same concentration. For the experiments, the mice were kept under long-term anaesthesia with isoflurane (0.5–1% v/v in 0.5–0.8 mL/min oxygen flow). In order to monitor the influence of anaesthesia on the lymphatic uptake, two different sets of experiments were devised, each one consisting of five animals per group. For the first condition (Groups 1 and 2), the acquisition of the MRI images was started 30 s after administration of the tracer. For the second condition (Groups 3 and 4), the injection site in paw was massaged for 15 s after administration of the MRI probe, to stimulate lymphatic vessel uptake under anaesthetic conditions [Citation26]. T1-weighted MR in vivo images were acquired using a 7 T MRI imaging system (Pharmascan®, Bruker BioSpin, Billerica, MA) with the animal positioned prone in the animal bed and inserted in the radiofrequency coil (38 mm inner diameter) inside the magnet. The following parameters were used: spin-echo method (MSME), TR = 300 ms, echo time (TE) = 11 ms, field of view (FOW) = 5×5 cm, matrix size: 256 × 128, 9 slides of 0.6 mm thickness and acquisition time of 3 min and 50 s. Images of living mice were acquired in coronal configuration and fat suppression mode. After the completion of imaging experiments, the mice were euthanised with an overdose of anaesthesia followed by cervical dislocation.
Image analysis
ParaVision version 4.0 software from Bruker (Billerica, MA) was used for the quantification of the magnetic resonance signal from the popliteal LN. For each scan, the analysis was performed on the slice that was positioned in the central part of the draining LN. Precontrast slices were individually analysed for each mouse to identify and manually delineate the region of interest (ROI) defining the popliteal fossa. Semi-quantitative analysis of the intensity of the T1-weighted signal after administration of the Gd-DTPA/CaP particles or gadobutrol was performed to evaluate the change in magnetic resonance in the whole LN over time. A ROI including the popliteal LN (ROILN) was defined and normalised to a defined ROI in the muscle (ROIm), containing 26–30 pixels. For each post contrast time point, the contrast enhancement was calculated according to the following equation: Contrast enhancement (%) = (ROILN/ROIm – PRE)/PRE ×100, where ROILN/ROIm is the ratio between the mean of the intensity values of ROILN divided by the mean of the intensity values of ROIm and PRE is the value of ROILN/ROIm of the precontrast acquisition. The resulting contrast enhancement was then plotted as a function of imaging time.
Statistical analysis
Data were presented as mean ± standard deviation of at least three independent experiments. GraphPad Prism software version 7 (La Jolla, CA) was used to perform statistical analysis. Student’s t test was used for all statistical analyses of experiments involving only two groups, while the one-way ANOVA test followed by Tukey’s post hoc significance test was used for the pairwise comparison between multiple groups. p< .05 was considered statistically significant in all analyses.
Results and discussion
Synthesis of the PEGylated chelator PEG-Ale
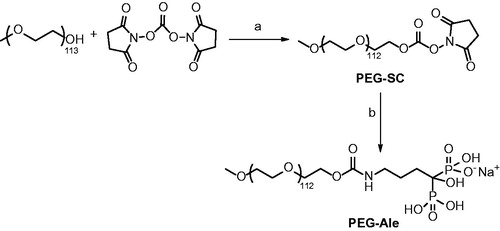
The 5-kDa PEG-Ale conjugate used to stabilise the CaP NPs was obtained by a two-step reaction involving the formation of a stable carbamate linker (. The PEG chain was activated to the succinidyl carbonate derivative through disuccinimidyl carbonate, followed by conjugation with Ale, to give the final PEG-Ale. Both the intermediate and PEG-Ale were characterised via 1H NMR spectroscopy (Figures S1 and S2, respectively), and the molar mass of PEG-Ale was confirmed by MALDI-TOF (Figure S3).
Figure 1. Synthesis scheme of PEG-Ale. Reagents and conditions: triethylamine, dichloromethane, 24 h, RT (a) and Ale sodium trihydrate, H2O, pH 9, RT (b).
Preparation and characterisation of Gd-DTPA/CaP NPs
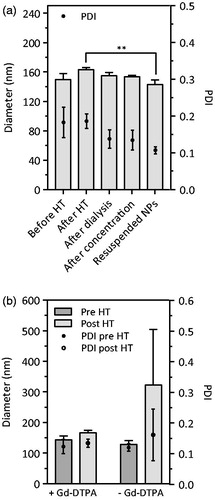
Gd-DTPA/CaP NPs were prepared by co-precipitating calcium and phosphate salts in the presence of Gd-DTPA. In order to control the rapid growth of the particles after nucleation, surface-stabilisation was achieved by introducing the PEGylated chelator (PEG-Ale), as previously reported [Citation23]. Aside from better controlling the particle size, the PEG layer was designed to increase the colloidal stability of the particles and eventually reduce the possible interaction with the mononuclear phagocyte system. The optimal conditions to generate small PEGylated Gd-DTPA/CaP NPs were identified by increasing the concentrations of PO43–, at fixed feeding concentrations of Ca2+ (250 mM) and Gd-DTPA (4 mM). With 1.5 mM PO43– and 40 µM PEG-Ale concentrations, CaP NPs of about 150 nm in diameter were generated. Increasing the PEG-Ale levels above 40 µM did not result in a significant decrease in size (Figure S4), likely due to the surface saturation limit, as previously reported [Citation23]. Concentrations of 1.5 mM PO43– and 40 µM PEG-Ale were then selected for the subsequent experiments. Due to the non-negligible solubility of the generated particles in aqueous environment, which precluded purification by dialysis or size exclusion chromatography, the colloidal suspension was stabilised by HT at 120 °C for 20 min under an external pressure of 200 kPa in sealed vials, before purification [Citation19, Citation27]. After HT, the Gd-DTPA/CaP NPs exhibited a slight increase in hydrodynamic diameter from 140 to 170 nm, with no significant change in PDI (). Subsequent purification by dialysis and concentration by ultrafiltration did not affect particle size and PDI significantly (p>.1). Moreover, the particles were lyophilised without the addition of any cryo/lyoprotector. A small but significant decrease in size was observed for the particles resuspended in ultrapure water compared to their diameter before purification (p = .0064). The control Gd-DTPA/CaP NPs obtained without HT were not stable during the purification processes, and no particles could be recovered after dialysis. Interestingly, CaP NPs loaded with Gd-DTPA exhibited higher stability to the HT compared to CaP devoid of Gd; the size of the latter particles increased from 150 to 300 nm after HT (). The improved stability of Gd-DTPA/CaP NPs vs. CaP particles could be a consequence of the additional cross-linking in the particles promoted by the high affinity of Gd3+ for the formation of complexes with PO43− [Citation28,Citation29]. The ζ-potential of Gd-DTPA/CaP NPs was of +1.19 mV. This is consistent with our previous studies [Citation22,Citation23] showing that a long PEG chain (≥ 2000 Da) and a high PEGylation density (above 10 µM) on CaP NPs result in a ζ-potential close to neutrality, which can thus be correlated with an efficient surface PEGylation.
Figure 2. Hydrodynamic diameter and PDI of Gd-DTPA/CaP NPs during the different preparation steps and after reconstitution of the freeze-dried powder (a) and of CaP NPs with and without Gd-DTPA, before and after HT (b). In both graphs, dots refer to PDI values (on right y-axis). Data are expressed as mean ± SD (n = 3), **p<.01 (refers to diameter).
The EE of Gd-DTPA in purified Gd-DTPA/CaP NPs as measured by ICP-OES was of 6.85 ± 0.22%, corresponding to a Gd-DTPA loading of 2.05 ± 0.1% (w/w), values that are in good agreement with the literature [Citation19]. The low amount of Gd-DTPA encapsulated in CaP NPs compared to traditionally loaded small interfering RNA (siRNA) and DNA may be attributed to the lack of phosphate groups in Gd-DTPA, that could mediate a stronger interaction with CaP during the formation of the particles [Citation18].
As shown in the XRD pattern (Figure S5), the Gd-DTPA/CaP NPs did not exhibit the typical peaks of crystalline CaP. The type of CaP phase obtained during particle preparation mainly depends on the initial Ca/P ratio. Moreover, a fast nucleation and growth process, in the presence of excess of Ca2+ was shown to lead to precipitation of the ions in a non-stoichiometric ratio, resulting in the formation of amorphous CaP [Citation23, Citation30]. Additionally, the XRD pattern revealed that the stabilisation promoted by the HT was not due to an increase in the crystalline phase of CaP. Insoluble aggregates of amorphous CaP in solution are in dynamic equilibrium with ions and ion pairs [Citation31]. In particular, continuous binding of Ca2+ ions during the post-nucleation processes promotes cross-linking of the clusters, stabilisation and densification of the final particles. A post-synthetic HT treatment at high temperature (typically above the boiling point of water) of CaP was suggested to drive a decomplexation and re-organisation of the solid structure which, under supersaturation conditions, led to an increased migration of calcium ions during particles growth [Citation30, Citation32–34]. The initial ratio of ionic species, temperature and duration of the aging step, and presence and distribution of a Ca2+ chelator on the particles were shown to have a significant impact on the final shape and structural properties of CaP [Citation32, Citation34]. On the other hand, the pressure applied on the material was not found to exhibit a clear influence on the physicochemical stability of the particles. Ultra-high pressures (greater than 0.96 GPa) were shown to induce a phase transition from amorphous to crystalline CaP, due to a change in interatomic distances in the material [Citation35]. However, this pseudo-crystalline behaviour of amorphous CaP quickly reverted with the return to amorphous state at atmospheric pressure.
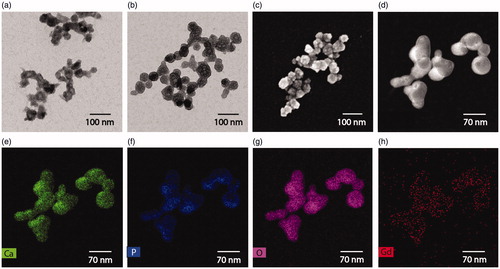
Interestingly, TEM micrographs showed that the particles had a spherical morphology and a diameter of about 50–60 nm (), and they appeared as interconnected structures of a small number of NPs. The resulting cumulative size of the aggregates correlated with the hydrodynamic diameter measured by DLS (≈150 nm), indicating that the particles form small clusters in solution, as previously described for amorphous CaP [Citation23, Citation36]. Empty round spaces were found in the interior of the particles, which is a typical pattern for amorphous CaP (Figure S6a and S6b) [Citation36,Citation37]. A more defined and uniform spherical structure was observed for the particles that were hydrothermally treated (), while not treated particles had an irregular geometrical distribution (). As previously described, the HT seemed to promote a structural reorganisation of the particles to a final uniform spherical structure. HAADF-TEM and SEM corroborated the spherical morphology () and EDS mapping on Gd-DTPA/CaP NPs confirmed that the particles were composed of Ca, P and O (), and were homogenously loaded with Gd (). The presence of few Gd atoms in the buffer solution might be a consequence of release of Gd during the EDS preparation process of the samples.
Figure 3. TEM micrograph of Gd-DTPA/CaP NPs pre (a) and post (b) HT. The spherical morphology of the particles was confirmed by SEM (c) and HAADF-TEM (d). EDS mapping of Ca (e), P (f), O (g) and Gd (h) on Gd-DTPA/CaP NPs.
Colloidal stability of Gd-DTPA/CaP NPs and Gd-DTPA release
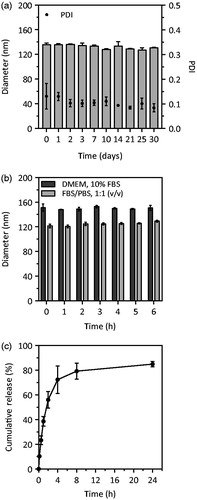
The impact of the HT and the PEGylated layer on the colloidal stability of Gd-DTPA/CaP NPs was assessed by monitoring the changes in size and PDI by DLS over a period of 30 d. Considering that lymph proteins and electrolytes contents are qualitatively similar to that of plasma, although the protein concentration is lower [Citation38,Citation39], the stability of particles was also investigated after incubation for 6 h in media containing FBS at different percentages. In both cases, the Gd-DTPA/CaP NPs retained a hydrodynamic diameter of about 120–150 nm (). The leakage of Gd-DTPA from the NPs was monitored by measuring its release under highly diluted conditions in 10 mM HEPES buffer (140 mM NaCl, pH 7.4), at 37 °C, over 24 h. The profile shown in indicates a gradual release of Gd-DTPA, reaching a cumulative value of 50% after 2 h and of about 80% after 24 h. This release closely correlates with a strong decrease in the scattering intensity of the colloidal suspension over 24 h, suggesting the dissolution of the particles (Figure S7). The physical state of CaP in colloidal delivery systems was shown to have a significant effect on the dissolution rate of the material. A faster leakage of Ca2+ and PO43− ions was indeed reported for NPs containing amorphous CaP vs. more crystalline structures of equivalent size, as well as in CaP with a higher degree of porosity [Citation36,Citation37, Citation40]. For MRI applications, amorphous Gd-DTPA/CaP NPs could, in theory, represent an advantageous system for short-term imaging after injection as, due to their favourable bioresorbable properties, the particles would not accumulate in the body and the released Gd-DTPA would be quickly excreted via the urinary route.
Figure 4. Stability of reconstituted Gd-DTPA/CaP NPs. Size of particles measured at RT over a period of 30 d; dots refer to PDI values (on right y-axis) (a); Size of Gd-DTPA/CaP NPs in FBS-containing media at 37 °C (b); Cumulative release profile of Gd-DTPA from Gd-DTPA/CaP NPs in 10 mM HEPES, 140 mM NaCl, pH 7.4 at 37 °C (c). Data are expressed as mean ± SD (n = 3–4).
Characterisation of r1 relaxivity
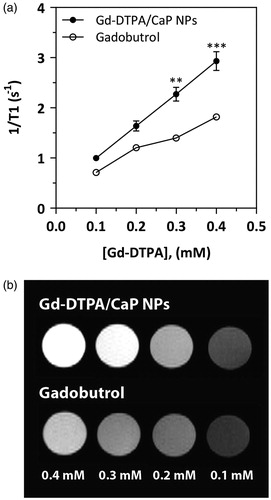
Paramagnetic compounds, such as Gd(III), are conventionally employed as ‘positive’ contrast agents as they can affect the spin–lattice relaxation time T1 of nearby protons, and produce a higher signal on T1-weighted images [Citation41]. A high MRI signal enhancement arises from a high molecular relaxivity (r1) of the paramagnetic species. Therefore, the determination of this parameter provides an estimation of the contrast efficiency of an MRI probe. The molecular relaxivity of Gd-DTPA/CaP NPs was herein measured with a 7 T MRI imaging system. The r1 value of Gd-DTPA encapsulated in CaP NPs was ∼1.6 fold higher than the r1 of gadobutrol, i.e. 8.73 mM−1 s−1 and 5.58 mM−1 s−1, respectively (). The higher contrast enhancement of Gd-DTPA/CaP NPs was also confirmed by visual comparison of T1-weighted MRI images acquired for solutions containing 0.1–0.4 mM Gd-DTPA equivalents formulated in CaP or as gadobutrol (). A similar phenomenon was previously described for nanoparticle contrast agents and, more precisely, for a micellar-like CaP NPs encapsulating Gd-DTPA [Citation19, Citation42]. The increased r1 was ascribed to the cumulative effect of a high number of Gd3+ nuclei confined in the small volume of NPs, in addition to a reduction in the molecular tumbling rate of the tracer [Citation43,Citation44].
Figure 5. MRI enhancement effect of Gd-DTPA encapsulation in CaP NPs. R1 (1/T1) longitudinal relaxation rate values measured at 7T for Gd-DTPA/CaP NPs and gadobutrol (a). MRI T1 weighted images acquired at 7T for concentrations of 0.1–0.4 mM Gd-DTPA formulated in CaP NPs and as gadobutrol (b). Error bars of the gadobutrol curve are smaller than the symbols. Data are presented as mean ± SD (n = 3) **p<.005, ***p<.0005.
Cytotoxicity experiments
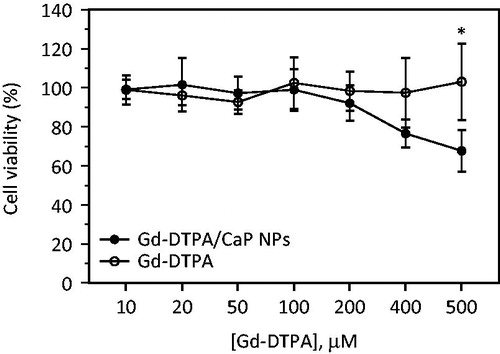
The cytotoxicity of Gd-DTPA/CaP NPs was evaluated on J774.2 macrophages, a cell type analogous to those involved in the uptake of small particles after interstitial administration [Citation45]. After 24 h of exposure, no significant viability reduction was observed for concentrations up to 400 µM of Gd-DTPA equivalent, formulated either in NPs or as a saline solution (. However, a significant (p = .033) decrease in viability was measured for cells exposed to CaP NPs at concentrations of Gd-DTPA over 400 µM. This response could be due to the particle dissolution that leads to an increase of intracellular Ca2+ and, therefore, triggers cell death [Citation46–48]. However, although in vitro cytotoxicity assays represent a useful tool to predict the biological behaviour of NPs, particle toxicity might be enhanced by a sedimentation process [Citation23], but is unlikely to take place in vivo [Citation49,Citation50]. These data still indicate that high local doses of Gd-DTPA/CaP NPs may induce some toxicity, especially if the clearance from the site of injection is slow.
Figure 6. Effect of Gd-DTPA formulated in CaP NPs or as saline on J77.4 cell viability. Data are expressed as mean ± SD (n = 9) *p<.05.
In vivo MRI experiments
MRI kinetic studies at 7 T after subcutaneous injection of the Gd-DTPA/CaP NPs in the left rear foot paw were performed to monitor particle uptake and retention in the popliteal LN. The particle performance was compared to that of gadobutrol administered via the same route. For all MRI scans, coronal images in fat suppression mode were acquired, with a field-of-view (FOV) that allows the visualisation in the same image of the injected foot and both the left and right popliteal LNs, as depicted in Figure S8. Three minutes after administration of the Gd-DTPA/CaP NPs, no MRI signal was visible in the left popliteal LN (). However, 20 min post injection a gradual contrast enhancement appeared along the LN margins, and the signal progressively concentrated in the medial part of the LN, reaching a peak in intensity after 40 min and maintaining a visible contrast enhancement for at least 60 min. A different pattern of uptake was observed for gadobutrol. Generally, an intense contrast enhancement appeared in the LN after injection of this tracer, followed by a progressive homogenous distribution of the MRI molecule both in the medial and lateral part of the LN. Nonetheless, while a constant deposition pattern was observed in the group of animals which received Gd-DTPA/CaP NPs (Figure S9), significant variations in the onset, intensity and position of the enhanced signal were observed in the group of animals which were injected with gadobutrol (vide infra) (Figure S10). This finding indicates that the uptake and retention of the small molecule Gd tracer in the lymphatics could not give a reproducible signal. In both cases, a progressive decrease in the MRI signal in the injected paw was associated with redistribution of the tracers in the popliteal LN (Figure S11). Deposition and retention of Gd-DTPA/CaP NPs and gadobutrol in the popliteal LN were further investigated via semi-quantitative analysis. After administration of the tracers, all analyses were conducted on a representative central slice of the LN, in order to evaluate time-course changes of the contrast enhancement (%) in the entire area of this section. When injecting Gd-DTPA/CaP NPs, a slow and progressive increase in contrast enhancement was observed 20–40 min after administration, reaching a ca. 50% enhancement (), which confirmed the kinetic pattern highlighted in . In contrast, gadobutrol gave a quick 100% increase in enhancement after administration, indicating that the low molecular weight tracer can have access much rapidly to the lymphatic vessels from the foot paw (). However, high variability was observed in the group treated with gadobutrol, hence hindering a reliable and precise quantification of the signal.
Figure 7. Gd-DTPA/CaP NPs accumulate in specific areas of the popliteal LN. MRI images showing the kinetics of Gd-DTPA/CaP NPs (a) or gadobutrol (b) uptake in the popliteal LN. Arrowheads point to regions of the LN with increased contrast enhancement. The arrow indicates a lymphatic vessel draining from the foot.
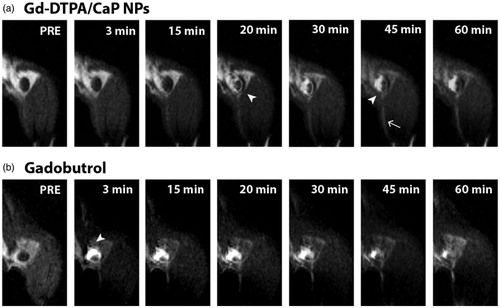
Figure 8. Semi-quantitative analysis of contrast agent uptake in the popliteal LN. Gd-DTPA/CaP NPs accumulated slowly in the LN under anaesthetic conditions (a), while the uptake was faster if external pressure was applied after injection (b). In both cases, gadobutrol was quickly drained to the LN, although higher variability in the contrast enhancement was observed in this case. Data are expressed as mean + SD (n = 5).
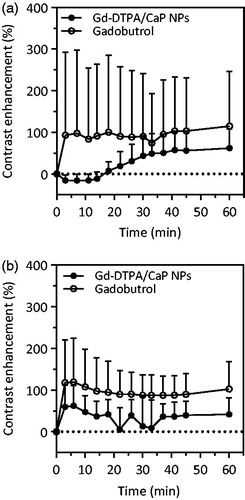
For the next set of experiments, the effect of an external pressure applied on the injection site on the lymphatic drainage was investigated. Massage in the injection site was expected to increase the lymphatic function in anaesthetised mice [Citation26, Citation51]. Lymphotropic stimulation of the injection sites for 15 s after the administration of the MRI probe led to an immediate bright contrast in the LN for both Gd-DTPA/CaP NPs and gadobutrol (Figure S12a and S12b, respectively). After external stimulation, lymphatic contractility and propulsion are restored, and this results in a fast transport of the contrast agents within the lymphatic vessels. Indeed, both Gd-DTPA/CaP NPs and gadobutrol were quickly taken up by the lymphatics with similar kinetics. In both cases, the enhancement of the MRI signal was mainly observed in the region of the cortex/subcapsular sinuses of the LN, yielding a visible contrast for at least 60 min. Gd-DTPA/CaP NPs and gadobutrol quickly produced a bright enhancement in the popliteal LN, which was estimated to be roughly 50 and 100%, respectively (). As a consequence of the external stimulation on the lymphatic vasculature, the comparable kinetic and deposition patterns indicated a similar uptake of Gd-DTPA/CaP NPs and gadobutrol in the lymphatics. However, variability remained apparently higher in the case of the gadobutrol solution, as deduced from the semi-quantitative evaluation.
Typically, contrast agents injected in the foot enter the lymphatic system and are drained to the ipsilateral popliteal LN; depending on its size and physicochemical properties, the tracer can further reach the corresponding inguinal, central iliac and axillary LNs [Citation52]. Lymphatic vessels have loose endothelial junctions that, as molecular sieves, are involved in the control of the lymphatic permeation of small solutes and macromolecules. Particles of 10–120 nm were shown to freely enter the lymphatic flow via the endothelial gaps, and the amount of NPs that reaches the popliteal LN is inversely related to the size of the particles [Citation7, Citation52,Citation53]. In addition, deposition of small particles (<200 nm) in the LN was shown to follow a cell-free trafficking mechanism, and their uptake by resident dendritic cells takes place only few hours after their accumulation in the LN, depending on the size and the particle surface properties [Citation45, Citation54]. In contrast, smaller colloids (<20 kDa) are primarily taken up by blood capillaries and large NPs (>200 nm) tend to remain mostly confined at the injection site or to be phagocyted by antigen presenting cells and subsequently transposed to the draining LN [Citation45]. In healthy mice, small NPs are slowly drained to the LN from the interstitium, and the first visible signal in the popliteal LN appears around 30 min after injection in the paw [Citation55,Citation56]. Once in the LN, the particles preferentially enter the margins of the cortex and then localise in the subcapsular sinuses, that roughly extend over the medial part of the LN, while the medulla is confined in the lateral half of the LN [Citation15, Citation45]. Generally, NPs are retained in the LN for longer times compared to low-molecular weight contrast agents, giving a specifically localised and brighter contrast [Citation15]. The same pattern of uptake and distribution was here observed with Gd-DTPA/CaP NPs; they started to accumulate in the cortex/subcapsular sinuses area with a delay of 20–30 min from injection. However, the level of the contrast agent drastically decreased in the popliteal LN 2 h after administration of the tracer (Figure S13a). This is probably a consequence of dissolution of the particles, followed by the drainage of the Gd-DTPA out from the LN. Likewise, 2 h after gadobutrol administration the MR signal observed in the popliteal LN faded away (Figure S13b), as the small molecule is likely to be quickly washed-out from the LN. Moreover, no MRI signal was observed in the inguinal LN 60 min after injection. Particles of 50–100 nm administered in the foot paw where shown to reach the margins of the second draining LN at least 30–60 min after injection [Citation53]. The absence of a visible contrast enhancement from the Gd-DTPA/CaP NPs in the inguinal LN could also be due to dissolution of the particles, which could already take place at the first nodal station around 60 min after injection. In addition, longer observation times might be needed to appreciate accumulation of the particles in other LNs draining from the foot [Citation53]. Non-reproducible uptake kinetics and distribution patterns over the LN were observed for gadobutrol resulting in variable onset of the signal in the LN, localisation and intensity of the contrast enhancement. Indeed, it was reported that low molecular weight Gd tracers are less effective in generating an intense and reproducible signal from the popliteal LN [Citation15, Citation57].
Anaesthetics, such as isoflurane, were shown to have a depressive effect on the lymphatic function [Citation58]. Lymphotropic stimulation can reverse this condition and reactivate the lymphatic musculature and the lymph propulsion. Moreover, injection site massage increases the hydraulic pressure in the interstitium and promotes the opening of interendothelial gaps of the lymphatic vessels, which are pressure-dependent structures. As a result, the uptake of larger particles from the interstitium might be promoted [Citation26, Citation51]. In stimulated mice, no change in the kinetics of lymphatic uptake for gadobutrol was observed compared to unstimulated animals, as the small molecule tracer can quickly diffuse into the lymphatic vessels, regardless the applied stimulation. However, faster kinetics of uptake in the popliteal LN were observed for Gd-DTPA/CaP NPs after application of an external massage. This finding confirms that a more rapid deposition in the LN of Gd-DTPA/CaP NPs with a hydrodynamic diameter of 150 nm could be achieved after external stimulation of the injection site. However, higher lymphatic uptake and a more defined LN deposition in specific anatomical areas would probably have been obtained if smaller (or non-clustered) particles could have been produced [Citation45].
Conclusions
In this study, amorphous Gd-DTPA loaded CaP NPs were prepared and characterised, and their performance in the MRI enhancement of the popliteal LN was assessed. The particles demonstrated adequate colloidal stability and MRI properties. Foot paw injection of Gd-DTPA/CaP NPs in healthy mice proved that the particles could be employed to enhance the MRI signal of the popliteal LN, with preferential accumulation in specific regions. In anaesthetised mice, and without external stimulation of the lymphatic function at the injection site, the particles deposited at a slower rate than the small molecule tracer. Moreover, they exhibited less variability in the MRI signal. Therefore, the defined kinetic pattern of uptake and accumulation of Gd-DTPA/CaP NPs could represent an advantage for the detection of lymphatics alterations and dysfunctions that are recurrent in diseases such as cancer and lymphedema. In addition, faster particles deposition in the popliteal LN could be achieved with lymphotropic stimulation on the injection site.
However, the system presented limitations, and it should be improved for an optimal use as an MRI agent for the lymphatic system. While the fact that the particles could dissolve over time is a favourable property from a safety viewpoint, the release rate of Gd from the NPs was probably too fast, and methods to increase the stability of the particle core should be further investigated. For example, it would be interesting to determine whether it would be possible to obtain crystalline Gd-DTPA/CaP NPs with a precise control over the Ca/P (e.g. with synthetic routes that involve slow titration) or with HT involving longer aging times and higher temperatures [Citation33,Citation34]. The particle size in suspension should also be reduced to about 20–50 nm to further increase the uptake by the lymphatic vessels. Moreover, smaller particles are less prone to be internalised by phagocytic cells, thus the process of particles accumulation in the LN would be independent from cellular uptake and translocation. The particles within the 150-nm clusters were in this size range, however, the aggregates were apparently too stable to release the individual NPs. Smaller and well defined NPs could, for example, be fabricated via microfluidic approaches. Finally, if needed the colloidal stability of the particles could be increased by using PEGylated chelators bearing more phosphate groups, that offer additional binding site for CaP [Citation23].
Figures S1-S13
Download PDF (1.7 MB)Acknowledgments
The authors kindly thank Sabrina Cribioli for the practical help during animal experimentation, and Drs Steven Proulx and Lothar Dieterich for their scientific support in the design of the experiments. Dr. Anastasia Spyrogianni is acknowledged for her thoughtful comments on the manuscript. The Scientific Center for Optical and Electron Microscopy (ScopeM) of ETH Zurich is acknowledged for use of the facility, and especially Dr. Eszter Barthazy for the TEM, SEM and EDS analyses.
Disclosure statement
The authors declare no conflict of interest.
Additional information
Funding
Related Research Data
References
- Sleeman J. The relationship between tumors and the lymphatics: what more is there to know? Lymphology. 2006;39:62–68.
- Karaman S, Detmar M. Mechanisms of lymphatic metastasis. J Clin Invest. 2014;124:922–928.
- Ma Q, Dieterich LC, Detmar M. Multiple roles of lymphatic vessels in tumor progression. Curr Opin Immunol. 2018;53:7–12.
- Barrett T, Choyke PL, Kobayashi H. Imaging of the lymphatic system: new horizons. Contrast Media Mol Imaging. 2006;1:230–245.
- Zhang F, Niu G, Lu G, et al. Preclinical lymphatic imaging. Mol Imaging Biol. 2011;13:599–612.
- Moghimi SM, Bonnemain B. Subcutaneous and intravenous delivery of diagnostic agents to the lymphatic system: applications in lymphoscintigraphy and indirect lymphography. Adv Drug Deliv Rev. 1999;37:295–312.
- Xie Y, Bagby TR, Cohen MS, et al. Drug delivery to the lymphatic system: importance in future cancer diagnosis and therapies. Expert Opin Drug Deliv. 2009;6:785–792.
- Trevaskis NL, Kaminskas LM, Porter CJH. From sewer to saviour - targeting the lymphatic system to promote drug exposure and activity. Nat Rev Drug Discov. 2015;14:781–803.
- Bagby TR, Cai S, Duan S, et al. Impact of molecular weight on lymphatic drainage of a biopolymer-based imaging agent. Pharmaceutics. 2012;4:276–295.
- Sena LM, Fishman SJ, Jenkins KJ, et al. Magnetic resonance lymphangiography with a nano-sized gadolinium-labeled dendrimer in small and large animal models. Nanomedicine (Lond). 2010;5:1183–1191.
- Trubetskoy VS, Cannillo JA, Milshtein A, et al. Controlled delivery of Gd-containing liposomes to lymph nodes: surface modification may enhance MRI contrast properties. Magn Reson Imaging. 1995;13:31–37.
- Fujimoto Y, Okuhata Y, Tyngi S, et al. Magnetic resonance lymphography of profundus lymph nodes with liposomal gadolinium-diethylenetriamine pentaacetic acid. Biol Pharm Bull. 2000;23:97–100.
- Chen KJ, Wolahan SM, Wang H, et al. A small MRI contrast agent library of gadolinium(III)-encapsulated supramolecular nanoparticles for improved relaxivity and sensitivity. Biomaterials. 2011;32:2160–2165.
- Huang X, Zhang F, Lee S, et al. Long-term multimodal imaging of tumor draining sentinel lymph nodes using mesoporous silica-based nanoprobes. Biomaterials. 2012;33:4370–4378.
- Partridge SC, Kurland BF, Liu CL, et al. Tumor-induced lymph node alterations detected by MRI lymphography using gadolinium nanoparticles. Sci Rep. 2015;5:15641.
- Epple M, Ganesan K, Heumann R, et al. Application of calcium phosphate nanoparticles in biomedicine. J Mater Chem. 2010;20:18–23.
- Zhang M, Kataoka K. Nano-structured composites based on calcium phosphate for cellular delivery of therapeutic and diagnostic agents. Nano Today. 2009;4:508–517.
- Mi P, Kokuryo D, Cabral H, et al. Hydrothermally synthesized PEGylated calcium phosphate nanoparticles incorporating Gd-DTPA for contrast enhanced MRI diagnosis of solid tumors. J Control Release. 2014;174:63–71.
- Mi P, Dewi N, Yanagie H, et al. Hybrid calcium phosphate-polymeric micelles incorporating gadolinium chelates for imaging-guided gadolinium neutron capture tumor therapy. ACS Nano. 2015;9:5913–5921.
- Dewi N, Mi P, Yanagie H, et al. In vivo evaluation of neutron capture therapy effectivity using calcium phosphate-based nanoparticles as Gd-DTPA delivery agent. J Cancer Res Clin Oncol. 2016;142:767–775.
- Welzel T, Radtke I, Meyer-Zaika W, et al. Transfection of cells with custom-made calcium phosphate nanoparticles coated with DNA. J Mater Chem. 2004;14:2213.
- Giger EV, Castagner B, Räikkönen J, et al. siRNA transfection with calcium phosphate nanoparticles stabilized with PEGylated chelators. Adv Healthc Mater. 2013;2:134–144.
- Huang X, Andina D, Ge J, et al. Characterization of calcium phosphate nanoparticles based on a PEGylated chelator for gene delivery. ACS Appl Mater Interfaces. 2017;9:10435–10445.
- Miron T, Wilchek M. A simplified method for the preparation of succinimidyl carbonate polyethylene glycol for coupling to proteins. Bioconjugate Chem. 1993;4:568–569.
- Singh R, Lillard JW. Nanoparticle-based targeted drug delivery. Exp Mol Pathol. 2009;86:215–223.
- Proulx ST, Ma Q, Andina D, et al. Quantitative measurement of lymphatic function in mice by noninvasive near-infrared imaging of a peripheral vein. JCI Insight. 2017;2:1–13.
- Wang Y, Zhang S, Wei K, et al. Hydrothermal synthesis of hydroxyapatite nanopowders using cationic surfactant as a template. Mater Lett. 2006;60:1484–1487.
- Bingler LS, Byrne RH. Phosphate complexation of gadolinium(III) in aqueous solution. Polyhedron. 1989;8:1315–1320.
- Sherry AD, Caravan P, Lenkinski RE. Primer on gadolinium chemistry. J Magn Reson Imaging. 2009;30:1240–1248.
- Higuita LP, Vargas AF. Effect of addition of calcium ions and hydrothermal treatment on the morphology of calcium phosphates. Mater Lett. 2017;190:146–149.
- Habraken WJEM, Tao J, Brylka LJ, et al. Ion-association complexes unite classical and non-classical theories for the biomimetic nucleation of calcium phosphate. Nat Commun. 2013;4:1507.
- Chane-Ching JY, Lebugle A, Rousselot I, et al. Colloidal synthesis and characterization of monocrystalline apatite nanophosphors. J Mater Chem. 2007;17:2904–2913.
- Sadat-Shojai M, Atai M, Nodehi A. Design of experiments (DOE) for the optimization of hydrothermal synthesis of hydroxyapatite nanoparticles. J Braz Chem Soc. 2011;22:571–582.
- Sadat-Shojai M, Khorasani MT, Dinpanah-Khoshdargi E, et al. Synthesis methods for nanosized hydroxyapatite with diverse structures. Acta Biomater. 2013;9:7591–7621.
- Lam E, Gu Q, Swedlund PJ, et al. X-ray diffraction investigation of amorphous calcium phosphate and hydroxyapatite under ultra-high hydrostatic pressure. Int J Miner Metall Mater. 2015;22:1225–1231.
- Rodrigues MC, Natale LC, Arana-Chaves VE, et al. Calcium and phosphate release from resin-based materials containing different calcium orthophosphate nanoparticles. J Biomed Mater Res. 2015;103:1670–1678.
- Cai X, Han B, Liu Y, et al. Chlorhexidine-loaded amorphous calcium phosphate nanoparticles for inhibiting degradation and inducing mineralization of type I collagen. ACS Appl Mater Interfaces. 2017;9:12949–12958.
- Zaleska M, Olszewski WL, Durlik M, et al. Signaling proteins are represented in tissue fluid/lymph from soft tissues of normal human legs at concentrations different from serum. Lymphat Res Biol. 2013;11:203–210.
- Hansen KC, D’Alessandro A, Clement CC, et al. Lymph formation, composition and circulation: a proteomics perspective. Int Immunol. 2015;27:219–227.
- LeGeros RZ. Biodegradation and bioresorption of calcium phosphate ceramics. Clin Mater. 1993;14:65–88.
- Zhou Z, Lu ZR. Gadolinium-based contrast agents for magnetic resonance cancer imaging. Wires Nanomed Nanobiotechnol. 2013;5:1–18.
- Bruckman MA, Yu X, Steinmetz NF. Engineering Gd-loaded nanoparticles to enhance MRI sensitivity via T(1) shortening. Nanotechnology. 2013;24:462001.
- Kielar F, Tei L, Terreno E, et al. Large relaxivity enhancement of paramagnetic lipid nanoparticles by restricting the local motions of the GdIII chelates. J Am Chem Soc. 2010;132:7836–7837.
- Ananta JS, Godin B, Sethi R, et al. Geometrical confinement of gadolinium-based contrast agents in nanoporous particles enhances T1 contrast. Nat Nanotechnol. 2010;5:815–821.
- Manolova V, Flace A, Bauer M, et al. Nanoparticles target distinct dendritic cell populations according to their size. Eur J Immunol. 2008;38:1404–1413.
- Orrenius S, Zhivotovsky B, Nicotera P. Regulation of cell death: the calcium-apoptosis link. Nat Rev Mol Cell Biol. 2003;4:552–565.
- Motskin M, Wright DM, Muller K, et al. Hydroxyapatite nano and microparticles: correlation of particle properties with cytotoxicity and biostability. Biomaterials. 2009;30:3307–3317.
- Pourbaghi-Masouleh M, Hosseini V. Amorphous calcium phosphate nanoparticles could function as a novel cancer therapeutic agent by employing a suitable targeted drug delivery platform. Nanoscale Res Lett. 2013;8:449.
- Teeguarden JG, Hinderliter PM, Orr G, et al. Particokinetics in vitro: dosimetry considerations for in vitro nanoparticle toxicity assessments. Toxicol Sci. 2007;95:300–312.
- Cui J, Faria M, Björnmalm M, et al. A framework to account for sedimentation and diffusion in particle-cell interactions. Langmuir. 2016;32:12394–12402.
- Trubetskoy VS, Whiteman KR, Torchilin VP, et al. Massage-induced release of subcutaneously injected liposome-encapsulated drugs to the blood. J Control Release. 1998;50:13–19.
- Swartz MA. The physiology of the lymphatic system. Adv Drug Deliv Rev. 2001;50:3–20.
- Mori Y, Umeda M, Fukunaga M, et al. MR contrast in mouse lymph nodes with subcutaneous administration of iron oxide particles: size dependency. Magn Reson Med Sci. 2011;10:219–227.
- Fromen CA, Rahhal TB, Robbins GR, et al. Nanoparticle surface charge impacts distribution, uptake and lymph node trafficking by pulmonary antigen-presenting cells. Nanomedicine. 2016;12:677–687.
- Harrell MI, Iritani BM, Ruddell A. Tumor-induced sentinel lymph node lymphangiogenesis and increased lymph flow precede melanoma metastasis. Am J Pathol. 2007;170:774–786.
- Chakravarty R, Valdovinos HF, Chen F, et al. Intrinsically germanium-69-labeled iron oxide nanoparticles: synthesis and in-vivo dual-modality PET/MR imaging. Adv Mater. 2014;26:5119–5123.
- Ruddell A, Harrell MI, Minoshima S, et al. Dynamic contrast-enhanced magnetic resonance imaging of tumor-induced lymph flow. Neoplasia. 2008;10:706–713.
- Gogineni A, Caunt M, Crow A, et al. Inhibition of VEGF-C modulates distal lymphatic remodeling and secondary metastasis. PLoS One. 2013;8:e68755.