
 ?Mathematical formulae have been encoded as MathML and are displayed in this HTML version using MathJax in order to improve their display. Uncheck the box to turn MathJax off. This feature requires Javascript. Click on a formula to zoom.
Abstract
When data arrive in a sequence of two or more datasets, modeling on the most recent dataset should take previous datasets into account. We specifically investigate a strategy for regression modeling when parameter estimates from previous data can be used as anchoring points, yet may not be available for all parameters, thus, covariance information cannot be reused. A procedure that updates through targeted penalized estimation, which shrinks the estimator toward a nonzero value, is presented. The parameter estimate from the previous data serves as this nonzero value when an update is sought from novel data. This naturally extends to a sequence of datasets with the same response, but potentially only partial overlap in covariates. The iteratively updated regression parameter estimator is shown to be asymptotically unbiased and consistent. The penalty parameter is chosen through constrained cross-validated log-likelihood optimization. The constraint bounds the amount of shrinkage of the updated estimator toward the current one from below. The bound aims to preserve the (updated) estimator’s goodness of fit on all-but-the-novel data. The proposed approach is compared to other regression modeling procedures. Finally, it is illustrated on an epidemiological study where the data arrive in batches with different covariate-availability and the model is refitted with the availability of a novel batch. Supplementary materials for this article are available online.
1 Introduction
Settings where data continuously arrive and need to be incorporated into modeling have been addressed by incremental or online learning techniques (Losing, Hammer, and Wersing Citation2018). Transfer learning approaches have been developed for situations when there are just two datasets, and the first might only be loosely similar in structure to the second, but still informative (Pan and Yang Citation2010; Shilo, Rossman and Segal Citation2020). The idea of transfer learning has also been shown to be more generally useful, for example, for regression modeling, where it may also be more feasible to get analytical insight into algorithmic approaches (Minami et al. Citation2020). Some authors have also considered the combination of both challenges, that is, online transfer learning (Zhao et al. Citation2014). We are specifically interested in such online transfer learning for regression modeling, where covariance structure and the set of available covariates may change between datasets. In particular we will investigate a transfer learning strategy based on ridge penalized estimation.
While transfer learning for regression models allows for differences in the response as well as in the parameters when moving from dataset to dataset, the framework of transfer learning typically assumes that there is an initial model and that the corresponding structure stays the same when new data become available and need to be incorporated. Transfer learning then refers to the updating of knowledge of the model parameters when new information becomes available (Shalev-Shwartz Citation2012). As such it produces a sequence of parameter estimates. The latest estimate takes into account the most recent information but also exploits previously acquired data, while minimizing a certain loss function. Examples of transfer regression techniques abound. Statistical readers will be most familiar with recursive least squares (Plackett Citation1950) and mixed models (Verbeke and Molenbergs 2009). In this context and related, we recently showed how to perform transfer learning of the normal distribution’s precision matrix through targeted ridge penalized estimation (van Wieringen et al. Citation2020).
In the following, we consider settings where the response stays the same, when moving along a sequence of datasets, but the set of covariates may change as may the values they assume. For example, data of large epidemiological studies often arrive in batches. Each batch sheds light on the same phenomenon, for example, environment-disease relation, observed with possibly different covariate information. As such with the arrival of a new batch, the currently learned model of the phenomenon under study needs updating. In this article we show how updating can be achieved by means of penalized estimation.
Here we propose targeted ridge penalized estimation as an enrichment of the incremental/online transfer learning regression toolbox. The presented procedure updates the regression parameter estimate by minimization of the loss function using the novel data and with the target formed by the current parameter estimate derived from the hitherto available data. The approach is designed to not depend on covariance estimates of parameters from the previous data, as a change of available covariates will typically invalidate the usefulness of such covariance estimates. We discuss incorporation of multiple competing current estimates, if available. We study properties, for example, moments and consistency, of this estimator for transfer regression learning. We then translate all of this to the learning of the logistic regression model. The penalty parameter is chosen via constrained cross-validation to warrant learning and avoid one-off estimation. We compare transfer regression learning via targeted ridge penalized estimation to standard alternatives. Finally, we illustrate the potential of the method on an epidemiological study.
2 Methods
2.1 Model and Penalty Structure
Throughout we entertain either a linear or logistic regression model, being the most widely used variants of generalized linear models. Both are learned by means of targeted ridge penalized estimation, an extension of ridge regression (inspired by Singh, Chaubey, and Dwivedi Citation1986). It considers estimating the p-dimensional regression coefficient vector of the linear regression model,
with
, by minimizing the nonzero centered ridge regression loss function:
(1)
(1) with penalty parameter
and nonrandom shrinkage target
. An analytic expression for the minimizer of the above loss function exists and gives rise to the nonzero centered ridge regression estimator:
. High-dimensionally, this expression can be evaluated computational efficiently when rewritten in terms of the singular value decomposition of X (Hastie and Tibshirani Citation2004). If
the traditional ridge regression loss function is recovered. The motivation for this estimator becomes evident after reformulation of the penalized estimation problem above, that is, the minimization of loss (1), as a constrained estimation problem. When
, the regression parameter constraint is centered at the origin. But when
and
the constraint on
is nonzero centered. Of particular interest is the case when an informative choice for
is available. The targeted ridge estimator then becomes less biased (Singh, Chaubey, and Dwivedi Citation1986).
Two alternative interpretations of this estimator are relevant for the presented work. First, the nonzero centered ridge regression can be interpreted as an attempt to correct for the nonzero target. This is easily seen when using the change-of-variable . Substitution of
in the loss function (1) gives:
. In this
is the residual vector after invoking the prior knowledge. This is regressed on X to correct for the variance in Y wrongly attributed to X by the prior knowledge as condensed in the nonzero target
. Secondly, from a Bayesian perspective the nonzero centered ridge penalty still corresponds (in the sense that the posterior mean coincides with the optimum of the loss function above) to a normal prior on the elements of the regression parameter
. But this prior now has a mean equal to the corresponding element of
.
2.2 Updating the Linear Regression Model
The targeted ridge regression estimator introduced in the previous section is put to use in the case where multiple datasets become available sequentially at time points . At each time point we fit the linear regression model (now equipped with the index t to separate the datasets):
with
using knowledge from the previous case. To this end we use the nonzero centered ridge regression framework. In the above, the design matrices
may differ among datasets. For the theoretical exposé, however, the number of covariates, that is, the column dimension p of the
’s, is fixed, while the sample sizes
may differ. Moreover, the settings/values of the covariates, for example, the elements of
with
and
, are also free to vary over the t. The latter implies that the degree of collinearity among the covariates may change from dataset to dataset. Or, put mathematically,
need not equal
if
. While the design matrices may thus change from dataset to dataset, the
are considered to be nonrandom in the remainder. Finally, the effect of these covariates on the response, however, is assumed to be fixed through time. The error variance is also assumed to be fixed through time. The latter assumption is not necessary as the theoretical results can be generalized to accommodate an error variance that differs among datasets.
At the arrival of a new tth dataset, the estimates of parameters and
obtained from the previous
th dataset(s) are available. These may be used as prior knowledge in the updating of the parameter estimates from the tth dataset through:
where the previous estimate of
thus, plays the role of
. In addition, the
and
may be used to choose the penalty parameters by minimization of the MSE plugging in these previous estimates for
and
. Later we will choose the penalty parameter by means of cross-validation (see Section 2.4).
The updated ridge linear regression estimator is a linear combination of the observed responses from the subsequent studies. Consequently, it is normally distributed with expectation and variance (see supplementary material I for details):
In the above the λt’s have been assumed to be nonrandom (as is done by Hoerl and Kennard Citation1970 in the derivation of the moments). To provide some intuition, assume (i) every dataset is equipped with the same orthonormal design matrix (i.e., ) and (ii)
for all t. The expectation and variance then reduce to
and
. In particular,
and
. In words, when the number of novel datasets grows large enough, the updated ridge estimator becomes unbiased. Moreover, its variance is smaller than that of the ML (maximum likelihood) regression estimator for any
.
Next, we obtain more general results on the convergence of the sequence of ridge updated regression estimator and the associated linear predictor. To this end, notice that the above generated sequence of regression estimators (in which the arguments of
have been dropped to reduce notational clutter) forms a first-order Markov chain with continuous state space
as:
Moreover, it is time-homogeneous:for any
, and
.
The well-known theory of Markov process can now be exploited to show (under some conditions) the asymptotic unbiasedness of the ridge updated linear regression estimator and predictor (Theorem 1). The theorem’s proof, deferred – as all proofs – to the supplementary material II, requires to show that the updating process has a stationary distribution with expectation equal to .
Theorem 1.
Assume the existence of an infinite sequence of studies into the linear relationship between a continuous response and a set of covariates. The data from these studies, , are used to fit the linear regression model by means of the updated ridge linear regression estimator, which yields the sequence of estimators
which is initiated by an arbitrary, nonrandom
. Furthermore, let
be sufficiently large and
be the design matrix with covariate information on novel samples for which a prediction is needed. Then,
for some
A few notes on this theorem are to be pointed out. First, the theorem describes asymptotic behavior. But it does so not in the traditional sense, in which the sample size goes by one at a time. Here that may be if we include a new study with a degenerated sample size. But as most studies are expected to have a sample size exceeding one, the limit is reached in larger step sizes. Moreover, the data of the new study is not added to the data of the previous study, rather the former is weighed against a summary obtained from the latter: the current updated ridge linear regression estimator.
Another, more important note concerns the role of the penalty parameters in Theorem 1. While in the evaluation of the asymptotic expectation they are conditioned on, their specific values are irrelevant, as the proof only requires the fact that
for all t. In practice, we choose the penalty parameters by means of cross-validation or some other means involving data. The penalty parameters are thus, random variables themselves. This may cause different limiting behavior, although Theorem 1 indicates that their actual realizations are irrelevant. Indeed, simulations show that, even with penalty parameters chosen by means of cross-validation, the estimates converge to the true parameters.
In addition to asymptotic unbiasedness the updated ridge linear regression estimator, we show it to be consistent (Theorem 2), although under assumptions on the penalty parameter sequence.
Theorem 2.
Assume the existence of an infinite sequence of studies on the linear relationship between a continuous response and a set of covariates. The data from these studies, , are used to fit the linear regression model by means of the updated ridge linear regression estimator, which yields the sequence of estimators
which is initiated by an arbitrary, nonrandom
. Furthermore, let
be sufficiently large and
. Assume that the penalty parameter sequence
is chosen such that
with
the largest singular value of
. Then, for every c > 0:
The proposed updating scheme can be seen as a frequentist analogue of Bayesian updating (Berger Citation2013). In the Bayesian narrative, the ridge penalty corresponds to a normal prior. The resulting posterior of is also a normal distribution. When updating, this normal posterior then serves as (normal) prior for the next update of
. The prior for the t + 1th update then becomes
, which yields a posterior mean
coinciding with the frequentist estimator
.
Intuition (behind the proofs) of Theorems 1 and 2 is best formed in the low-dimensional case with all design matrices of full rank. Furthermore, denote the ML regression estimator of tth dataset by
. Then, note that
. The tth update ridge regression estimator can then be expressed by either of the two expression below:
with
and
if
. The result of Theorem 1 becomes insightful after taking the expectation of the former expression of the preceeding display, in which the weighted sum of the ML regression estimator differences vanishes for large t. The latter expression of the same display can loosely be interpreted as a weighted average, which—under an appropriate regularization scheme (see Theorem 2)—has a vanishing variance as
.
Finally, the target need not be formed by the most recently updated ridge regression estimate. It may be replaced by alternative estimates obtained from the preceding dataset(s). For instance, the ridge regression estimate obtained from all preceding datasets may play the role of the target. These targets may even be simultaneously available prior to the estimation of the regression parameter from the current data. One would then preferably have the current data choose among these targets. This can be done straightforwardly within the current framework. Hereto replace the targeted ridge penalty by what could be considered a mixture of such penalties. For such targets
, this yields the loss function:
, where all
and
. This loss is minimized with respect to
by
The targets are effectively averaged weightedly to form a novel target. The weights of this average are unknown. Like the penalty parameter λt, the weights are tuning parameters and are to be chosen prior to the estimation, for example, through a procedure like cross-validation (cf. Section 2.4). The multi-targeted ridge regression estimator is not accompanied by theoretical results, although similar asymptotic results may be obtained. Instead, we show in simulation that the estimator shrinks toward the preferred target (see supplementary material III).
2.3 Updating the Logistic Regression Model
The results of the previous section carry over to generalized linear models. This is exemplified here for the logistic regression model. Hereto the same experimental set-up as for the linear regression model is assumed to apply, now with a binary response: for
. The probability of a ‘1’ – and thereby that of a ‘0’ – is modeled by the logistic link function:
for every i. Again the regression parameter
is estimated by maximization of the log-likelihood augmented with a nonzero centered ridge penalty:
The corresponding estimating equation is(2)
(2) where
with link function
defined by
and
denoting the ith row of the design matrix. The root of EquationEquation (2)
(2)
(2) is found by means of a Newton–Raphson algorithm, reformulated as an iteratively reweighted least squares algorithm. This requires a minor modification from that presented in Schaefer, Roi, and Wolfe (Citation1984) and Le Cessie and van Houwelingen (Citation1992) for the zero-centered ridge logistic regression estimator. Starting from an initial guess
, the estimate is updated by
where W diagonal with
and the adjusted response variable
. The last expression in the preceding display is obtained by means of the Woodbury matrix identity and to be used in the high-dimensional case for computational efficiency. In particular, the computationally most demanding task, the evaluation of
, can be performed prior to the iterations. This efficiency gain could also have been obtained by means of singular value decomposition (Eilers et al. Citation2001). The recursive formula above is applied until convergence, which yields the desired nonzero centered ridge logistic regression estimate. The inclusion of a nonzero target
generally increases the computing time of the iteratively reweighted least squares algorithm (see supplementary material IV). For informative targets, this increase is relatively small. Off targets, however, may yield larger computing times.
We now assume data from a sequence of studies on the same logistic regression model, that is, with a common regression parameter
but possibly different design matrices, are available. From each study, we estimate the parameter by means of the nonzero centered ridge logistic regression estimator with the estimate of the previous study as shrinkage target. The resulting estimate
is that
which solves
This yields a sequence of estimators , in which (again) the arguments of the
have been dropped to reduce notational clutter. The t + 1th estimator
of this sequence relates, after convergence of the iteratively reweighted least squares algorithm, to its predecessor by:
with
and
now involving
and
.
The thus defined sequence of updated logistic regression estimators can again be seen as being generated by a first-order Markov chain with
as its state space. As before, we exploit this fact to show asymptotic properties of the updated ridge logistic regression estimator. Theorem 3 states the asymptotic unbiasedness and consistency of the updated estimator and predictor.
Theorem 3.
Assume an infinite sequence of studies into the generalized linear relationship between a binary response and a set of covariates. The data from these studies, , are used to fit the logistic regression model by means of the updated ridge logistic regression estimator, which yields the sequence of estimators
which is initiated by an arbitrary, nonrandom
. Let
be sufficiently large. Then:
if
The updated ridge logistic regression estimator too is a frequentist analogue of a Bayesian updating scheme. Now the analogy is not exact but approximate. This is due to the fact that the normal prior is not conjugate for the logistic likelihood and, consequently, the posterior is not a well-known and characterized distribution. Nonetheless, the latter may be approximated in a Laplacian manner by a normal distribution (cf. Bishop Citation2006), for which the Bernstein–von Mises theorem (van der Vaart Citation1998) provides conditions that ensure its quality. The mean of this approximating normal corresponds to the mode of posterior (i.e., the updated ridge logistic regression estimator), while its variance relates to the curvature of the posterior at its mode. This normal-like posterior then serves as the prior when updating the knowledge on the logistic regression parameter at the arrival of a novel dataset.
The targeted ridge logistic regression estimator can also be modified to accommodate multiple targets acquired from different estimators. Again, this amounts to averaging the targets weightedly.
2.4 Choice of the Tuning Parameter
We present informative choices for the tuning parameters, and
, of updated ridge estimators. We choose the ridge penalty parameter of a novel dataset through a form of cross-validation (see Arlot and Celisse Citation2010 for a survey). Cross-validation chooses the penalty parameter that yields the best performance of the model on novel data. In absence of novel data part of data, referred to as the test or left-out data, is set aside to serve as such. The remaining data, called the training or left-in data, are used to learn the model that is evaluated on the test data. The thus acquired performance depends on the selection of the test data, and may accidentally yield an overly optimistic performance. To remove the effect of the particular the data are split into training and test data repetitively, say, K times, thus, giving rise to K-fold cross-validation. Splitting may be done randomly but is done here in a stratified manner. The latter procedure ensures approximate equally sized test datasets and the single occurrence of each sample in a test dataset. The performance averaged over the test datasets is considered to be representative for novel data. The chosen penalty parameter optimizes this performance. The model’s performance is usually measured by its fit on the test data. For the linear regression model, this amounts to the cross-validated sum-of-squared
. In this loss,
and
are formed by subsetting
and
to the kth test data, while
is the ridge regression estimator obtained from all but the kth test data. In case of logistic regression, the cross-validated likelihood
is used as a performance measure. The optimal λt is found by minimization/maximization of the appropriate criterion using standard machinery. In the remainder, we use K = 10-fold cross-validation, which has been found to be a good compromise when trying to balance the bias and variance of the cross-validation criterion (Friedman, Hastie, and Tibshirani Citation2001).
The proposed cross-validation procedure does not take into account the datasets prior to the tth one. Unforeseen circumstances may have led to a realization of the tth dataset that is not representative. For instance, the response-covariate relation may be absent, that is, , in this particular dataset. Cross-validation, which optimizes the predictive performance in the tth dataset, is likely to select a rather small λt that will not shrink toward the updated ridge regression estimator obtained from the previous t – 1 datasets. As such the information from these prior datasets accumulated in the updated ridge regression estimator is ignored. With the tth dataset being the odd-one-out, estimation of the regression parameter from the t + 1th dataset starts anew with an uninformative shrinkage target. To safeguard against such phenomena, we still optimize the cross-validated performance measure with respect to the penalty parameter but with a constraint on the vanishing of the fit on the preceding datasets. The minimization takes place over the set
defined as
with
denoting the sample size fraction of the tth dataset in relation to the sample size accumulated over all datasets up to t. In the optimization, we enforce the constraint using a barrier function. Constraining the choice of λt to
ensures that the fit of previously acquired dataset does not vanish more than the fraction ft. In the presence of multiple targets the constraint simply demarcates a viable subspace of the penalty parameters λt and the
’s. Finally, a similar constraint can be conceived for the choice of the ridge logistic regression estimator’s penalty parameter through cross-validation. The sum-of-squares are then to be replaced by the (negative) log-likelihoods.
To provide some intuition behind the proposed constrained cross-validation, we study the t = 2-case where the constraint, based on the estimate obtained from the first dataset, bounds the penalty parameter of the regression parameter estimate of the second dataset. Hereto we evaluate, using the moments of quadratic forms, the expectation of the quantities that determine the constraint
and
We can now conclude that the set is nonempty. Hereto set
. Then
, and
. Consequently, the two expectations above are equal. This is no surprise as
is shrunken toward
if
. Furthermore, the expressions of the two preceding displays reveal the relationship between λ1 and λ2. While this relationship is not trivial, some conclusions may be deduced. For instance,
If n > p, the target
If the target
In both cases, the is thus, a good “warm start.” In the first case it shields off the misinformed initial target
and provides the unbiased estimate instead, while in the second one it propagates the well-informed initial target
. The scenario’s conclusions hinge upon the assumption that f2 is small. If not, the multiplication factor
in the constraint provides leverage and may allow λ2 to deviate from these two extreme scenario’s. In particular, if n1 is small, this leverage is considerable, hardly enforcing a constraint on the choice of λ2.
Additionally, we have studied the behavior of constrained cross-validation in simulation (see supplementary material V). These simulations reveal that constrained cross-validation is beneficial (in the sense of yielding a reduction of the estimator’s loss) if (i) the novel data, on which the estimator is fitted, are from a different distribution then the “historic data,” while (ii) “historic data” are drawn from the correct model, and (iii) the target is informative. If either the target is uninformative or the novel data are from the correct model, the constrained cross-validation shows neither a gain over nor does it fall behind regular cross-validation. In all, constrained cross-validation is thus, only a safeguard against “outlying” novel data, outlying in the sense that it deviates from the historic data.
An informative choice on that initiates the updating may be obtained from profound knowledge of the relationship described by the linear regression model. Usually, however, such knowledge is at best present in tacit form. One way out could be literature providing univariate estimates of (some of) the βj’s that constitute
. An alternative would “sacrifice” the first dataset to obtain an initial estimate with which the updating is initiated. Traditional ridge regression (with a zero target) or, following literature, univariate estimates from covariate-wise simple linear regression could be used to arrive at this initial estimate. Due to the shrinkage to zero, the former tends to underestimate the elements of
, whereas the latter has the opposite result (as confounding covariates are omitted). Alternatively, an estimate from other transfer regression learning procedures—preferably an unbiased one—can be used to initiate the updating.
Initialization is required not only at the initial time point. With the onset of the big data age, more and more information is registered over time. Consequently, “early” datasets comprise a limited number of covariates, while more recent ones comprise many additional ones. Or, it may be too costly to measure certain covariates at each instance but the budget allows for their measurement at (say) every other study. Hence, in practice not every covariate will be present in each dataset. A pragmatic choice of the target is then to use the latest estimates element-wise.
3 Comparisons
We conduct two comparisons. The first illustrates that updating is beneficial compared to de novo estimation. Secondly, we contrast updating, both in papyro and in silico, to estimation from the pooled data.
3.1 Regular Ridge Regression
In a small simulation study, we contrast the behavior of the updated ridge linear regression estimator to its traditional ridge counterpart. First, we generate an initial dataset from and estimate with the traditional ridge regression estimator in combination with a cross-validated penalty parameter. This estimate serves as the
to initiate the updated ridge regression. Now sequentially, we draw another 25 datasets. From each dataset, we estimate
using both the traditional and updated ridge estimators with cross-validation (without any constraint but positivity) for penalty parameter determination. For the latter, the previous updated ridge regression estimate is used as target. We have repeated this process a hundred times.
We have drawn all datasets as follows. Throughout we have set the jth element of the vector of regression coefficients as
for
. Each element of the
-dimensional tth design matrix
with n = 25 is drawn from the standard normal distribution. We then form the response through
with each element of
sampled from
. Hence, we generate
,
, and consequently
, anew at each t.
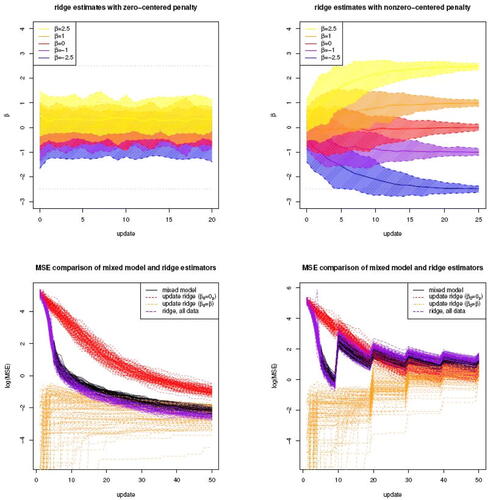
In the 5%, 50%, and 95% quantiles of the traditional and updated ridge estimates of βj with are plotted against t. These quantiles of the traditional ridge estimates of these elements of
are constant over t (left panel of ). Those of the updated ridge estimates (right panel of ) clearly improve as t increases. The improvement is 2-fold: (i) they become less biased, and (ii) the distance between the 5% and 95% quantiles vanishes.
Fig. 1 The top panels show the -quantile intervals of the traditional (left) and updated (right) ridge estimates of βj with
plotted against t. The solid, colored line inside these intervals is the corresponding 50% quantile. The dotted, gray lines are the true values of the βj’s. The bottom panels show the mean squared errors over hundred runs of the mixed model’s ML, traditional (based on all data) and updated ridge regression estimators (initiated with
and
) plotted against t. All datasets are sampled from the same regression model, but in the right panel every tenth dataset is sampled from an empty model.
We have conducted additional simulations with the elements of design matrix sampled from more intricate distribution (see supplementary material VI). They reveal that a varying location of the covariates does not affect the performance of the updated ridge regression estimator. The introduction of collinearity among the covariates, however, does, as it slows down the convergence of the updated ridge regression estimator to the true parameter values.
3.2 Mixed Model
A natural and widespread alternative to the proposed approach would be to employ a mixed model that includes a dataset-specific random effect of the covariates. The mixed model is then refitted at the arrival of a new dataset, each time to an enlarged dataset encompassing the newly arrived data and all those that preceded it. This may be computationally demanding but is considered a mere practical nuisance for the moment. To make matters more precise, we assume, for the dataset formed from all those up to the tth one, the mixed model with:
the vector
the
the
the vector
the error vector
We assume the random effects and errors to be independent and obey the multivariate normal laws, and
for all t, and with zero covariance across datasets, for example,
for
.
The maximum likelihood estimator of the above formulated mixed model’s fixed regression parameter given the variance parameters
and
is (see Bates and DebRoy Citation2004):
with its first two moments:
in which
.
We now compare the updated ridge regression estimator and the maximum likelihood estimator of the mixed model’s fixed effect parameter with respect to their mean squared error. Theorem 4 does so for a sequence of studies with orthonormal design matrices.
Theorem 4
(Mean squared error of mixed versus updated estimator). Assume the existence of an infinite sequence of studies into the linear relationship between a continuous response and a set of covariates. The data from these studies, , are used to fit the linear regression model by means of the updated ridge linear regression estimator, which yields the sequence of estimators
which is initiated by an arbitrary, nonrandom
. Let
be orthonormal and
for
. Then, when initiated by
, the updated ridge regression estimator outperforms (in the mean squared error sense), the maximum likelihood estimator of the mixed model’s fixed effects parameter as given above. Hence, MSE
.
This theorem states that the updated linear regression estimator may, when initiated appropriately and equipped with the right penalty parameter scheme, outperform in the MSE sense the maximum likelihood estimator of the mixed model’s fixed effects parameter. Theorem 4) also holds if . The reasons for this are 2-fold. The first prerequisite is an unbiased initiation of the sequence of updated ridge regression estimators. The updated estimators are then unbiased too. As Theorem 4 is concerned with the MSE, and the mixed model’s ML estimator is unbiased too, this leaves to compare the variances. The condition on the sequence of penalty parameters then warrants that the updated ridge regression estimator’s variance shrinks faster than that of the mixed model’s ML estimator as t increases.
Theorem 4 assumes an orthonormal design matrix for all studies. This is rather restrictive from a practical perspective. In principle, however, a result as in Theorem 4 can be obtained for with X of sufficient rank. The proof follows that of Theorem 4, but the mathematics is more cumbersome and the result less insightful.
Theorem 4 assumes the variance parameters and
known. In practice, these parameters too need to be estimated from data. This is done in the simulation study that follows.
We compare the performance of the presented updated ridge regression estimator to the maximum likelihood estimator of the mixed model’s fixed effect parameter in two simulations. For reference, the comparison also includes the traditional ridge regression estimator using all available data. The first simulation investigates the result of Theorem 4 under more realistic assumptions. The second simulation reveals a better performance of the updated ridge regression estimator than the maximum likelihood estimator of the mixed model’s fixed effect parameter, when for a particular study in the sequence accidentally data from a different model are sampled. This accidentally erroneous sampling from a different model will introduce bias in the latter estimator, as it cannot reduce the influence of the data from this study. The updated ridge regression estimator, however, decides by the size of the penalty parameter how it weighs the current data against the regression estimate obtained from the preceding studies. In principle, it may favor the latter, effectively ignoring the data from the erroneously sampled study. This may cause a small reduction in efficiency compared to its competitor, but this is expected to be outweighed by the avoided bias. Both simulations are modified from that presented in Section 3.1. The settings are identical except for the fact that . Moreover, in a second scenario the tth dataset with
is sampled from an empty model, that is,
. With the arrival of each new dataset the parameter
is estimated using the ML estimator of the mixed model’s fixed parameter (from that t when the accumulated sample size exceeds the dimension). But also using the updated ridge regression estimator initiated uninformatively with
and informatively with
. We choose its penalty parameter through constrained cross-validation to prevent the deterioration of the fit on the preceding datasets. The quadratic loss, for example,
, of the mixed model’s fixed parameter ML, traditional (using all data) and updated ridge regression estimators are plotted against t (bottom panels of ). In the first scenario with all datasets drawn from the same linear regression model the maximum likelihood estimator of the mixed model’s fixed parameter performs better than the uninformatively initiated updated ridge estimator, but worse than the informatively initiated one. The same holds for the traditional ridge regression estimator based on all data, which in turn performs slightly better than the mixed model as it involves fewer—only fixed—parameters. For small t, this picture is also seen in the second scenario with every tenth dataset sampled from an empty model. But the maximum likelihood estimator of the mixed model’s fixed parameter suffers most (relatively) from the “outlying” datasets, and is for larger t even overtaken by the uninformatively initiated updated ridge regression estimator. Again, the traditional ridge regression estimator based on all data shows similar behavior as the mixed model, but roles between them are now reversed due to the flexibility of the latter by virtue of its random effects.
4 Application
The fingertips study registers annual information on a range of public health indicators for the counties of England (https://fingertips.phe.org. uk/). Following van Schaik et al. (Citation2019), who advocate the use of the fingertips data for the illustration of novel statistical techniques, we apply the proposed transfer learning procedure to relate the counties’ suicide rate to the other health indicators. Building on the R-script of van Schaik et al. (Citation2019), we have downloaded the data using the fingertipsR-package (Fox and Flowers 2009). Preprocessing of the data amounts to removal of cases without full information on the health indicators registered. This is done per year as the set of registered health indicators varies over the years. In particular, the size of this set tends to increase over time. Moreover, we have zero-centered the data year-wise. The resulting data comprise the years 2008–2016. Over these years the number of health indicators ranges from 1 to 23, from a total of 23 different ones, while the number of counties with full case information ranges from 57 to 159 over the years (refer to the supplementary material VII for more details).
Analysis of the data commences with the first year available, that is, 2008. We have fitted the linear model with the targeted ridge regression estimator with a zero target, that is, , and chosen the penalty parameter by cross-validation. For subsequent years, we have used the same estimator, but have formed the target element-wise from previous estimates: the jth element of the target is taken from the most recent estimate. If the jth covariate was not present in the data of the preceding year, we have taken the corresponding estimate from the year before that, and so on, until it is taken from the initial target for the year 2008. Moreover, we have chosen the penalty parameter by unrestricted and constrained cross-validation (as discussed in Section 2.4). Finally, for the purpose of reference, we have also estimated the regression parameter year-wise with the maximum likelihood regression estimator.
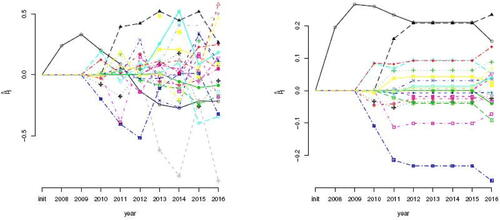
The trajectories of the resulting estimates are shown in and the supplementary material VII. The main takeaway of the plots is the volatile behavior of the ML regression estimates. In part this is due to a different sample size and, probably more important, the varying set of health indicators registered each year. The updated ridge regression estimator, irrespectively of the employed cross-validation method, yields much smoother trajectories. Hence, providing last year’s parameter estimate as a suggestion for the estimation of the current year’s one appears to harness against the involvement of a different set of covariates. Indirectly, the usefulness of this suggestion for the learning of the updating of the estimate is also evident by the increase of both the un- and constrained cross-validated penalty parameters over the years (not shown). This indicates that the suggestion is becoming more relevant as years go by. A convenient consequence of the updated ridge regression estimator’s smooth trajectories is the consistency of the sign of the regression parameter’s estimates over the years, most obvious from the estimators’ trajectories for two elements of the regression parameter (provided in the supplementary material VII), facilitating a sensible interpretation. Of course, there is no free lunch. The updated ridge regression estimators exhibit a small deterioration in the fit as can be witnessed from the residuals (see supplementary material VII), although this appears to be negligible.
Fig. 2 The panels show the trajectories of the ML (left) and the updated ridge regression, with its penalty parameter chosen via constrained LOOCV, estimates. Each trajectory represents a single covariate. The presence of a health indicator in the data of a particular year is evident from a symbol on its trajectory at the corresponding year. The symbol is omitted in years that the health indicator was not registered.
5 Conclusion
We presented methodology for continuously learning regression models from studies executed over large periods of time with data coming in bit-by-bit as they run their course. It could be considered a frequentist analogy to Bayesian updating and comprises sequential targeted ridge penalized estimation, shrinking toward the latest estimate, when novel data become available. At each update, the penalty parameter represents the extent to which the latest estimate yields an adequate model of the novel data. The iteratively updated estimator and its associated linear predictor have been shown to be asymptotically unbiased and consistent. The penalty parameter is chosen through cross-validation in which the search domain of the penalty parameter is constrained to ensure that the newly learned estimate causes little to no vanishing of the fit of the historic data in comparison to the previous estimate. In a comparison with other standard statistical transfer learning procedures, situations were identified where these procedures were outperformed by the proposed method. Finally, the proposed method was illustrated on data from an epidemiology study, showing its promise.
The current incremental/online transfer learning proposal employs a single penalty parameter per update. Hence, all elements of the novel estimate are shrunken in the same amount to the current one. However, it may be that certain elements of the current estimate provide a better fit than others on the novel data. Then, to differentiate the shrinkage among the novel estimate’s elements, the single-parameter penalty is to be replaced by a multi-parameter one: , the penalty parameter
is now a matrix. This matrix may be unstructured, leaving one with the problem of selecting
penalty parameters. More practically, it may be diagonal and possibly parameterized by a few scalar penalty parameters, thereby shrinking groups of elements similarly. Alternatively, a parameterization in line with generalized ridge regression (Hoerl and Kennard Citation1970; Hemmerle Citation1975; Lawless Citation1981), only shrinking differentially in the p canonical directions, may be considered. Either choice provides greater flexibility in the information propagated between updates.
Supplemental Material
Download Zip (13.4 KB)Supplemental Material
Download PDF (524.7 KB)Supplementary Materials
Proofs: Proofs of theoretical results. (.pdf-file).
Illustration: R code for the analysis (.r-files).
Illustration: Plots (.pdf-file).
Related Research Data
References
- Arlot, S., and Celisse, A. (2010), “A Survey of Cross-validation Procedures for Model Selection,” Statistics Surveys, 4, 40–79. DOI: 10.1214/09-SS054.
- Bates, D. M., and DebRoy, S. (2004), “Linear Mixed Models and Penalized Least Squares,” Journal of Multivariate Analysis, 91, 1–17. DOI: 10.1016/j.jmva.2004.04.013.
- Berger, J. O. (2013), Statistical Decision Theory and Bayesian Analysis, New York: Springer.
- Bishop, C. M. (2006), Pattern Recognition and Machine Learning, New York: Springer.
- Eilers, P. H., Boer, J. M., van Ommen, G. J., and van Houwelingen, H. C. (2001), “Classification of Microarray Data with Penalized Logistic Regression,” in Microarrays: Optical Technologies and Informatics (Vol. 4266), eds. M. L. Bittner, Y. Chen, A. N. Dorsel, and E. R. Dougherty, pp. 187–198, Bellingham: International Society for Optics and Photonics.
- Fox, S., and Flowers, J. (2019), “fingertipsR: Fingertips Data for Public Health,” R package version 0.2.9. https://CRAN.R-project.org/package=fingertipsR
- Friedman, J., Hastie, T., and Tibshirani, R. (2001), The Elements of Statistical Learning, New York: Springer.
- Hastie, T., and Tibshirani, R. (2004), “Efficient Quadratic Regularization for Expression Arrays,” Biostatistics, 5, 329–340. DOI: 10.1093/biostatistics/kxh010.
- Hemmerle, W. J. (1975), “An Explicit Solution for Generalized Ridge Regression,” Technometrics, 17, 309–314. DOI: 10.1080/00401706.1975.10489333.
- Hoerl, A. E., and Kennard, R. W. (1970), “Ridge Regression: Biased Estimation for Nonorthogonal Problems,” Technometrics, 12, 55–67. DOI: 10.1080/00401706.1970.10488634.
- Lawless, J. F. (1981), “Mean Squared Error Properties of Generalized Ridge Estimators,” Journal of the American Statistical Association, 76, 462–466. DOI: 10.1080/01621459.1981.10477668.
- Le Cessie, S., and Van Houwelingen, J. C. (1992), “Ridge Estimators in Logistic Regression,” Journal of the Royal Statistical Society, Series C, 41, 191–201. DOI: 10.2307/2347628.
- Losing, V., Hammer, B., and Wersing, H. (2018), “Incremental On-line Learning: A Review and Comparison of State of the Art Algorithms,” Neurocomputing, 275, 1261–1274. DOI: 10.1016/j.neucom.2017.06.084.
- Minami, S., Liu, S., Wu, S., Fukumizu, K. and Yoshida, R. (2020), “A General Class of Transfer Learning Regression Without Implementation Cost,” https://arxiv.org/abs/2006.13228.
- Pan, S. J., and Yang, Q. (2010), “A Survey on Transfer Learning,” IEEE Transactions on Knowledge and Data Engineering, 22, 1345–1359. DOI: 10.1109/TKDE.2009.191.
- Plackett, R. L. (1950), “Some Theorems in Least Squares,” Biometrika, 37, 149–157. DOI: 10.1093/biomet/37.1-2.149.
- Schaefer, R. L., Roi, L. D., and Wolfe, R. A. (1984), “A Ridge Logistic Estimator,” Communications in Statistics – Theory and Methods, 13, 99–113. DOI: 10.1080/03610928408828664.
- Shalev-Shwartz, S. (2012), “Online Learning and Online Convex Optimization,” Foundations and Trends in Machine Learning, 4, 107–194. DOI: 10.1561/2200000018.
- Shilo, S., Rossman, H., and Segal, E. (2020), “Axes of a Revolution: Challenges and Promises of Big Data in Healthcare,” Nature Medicine, 26, 29–38. DOI: 10.1038/s41591-019-0727-5.
- Singh, B., Chaubey, Y. P., and Dwivedi, T. D. (1986), “An Almost Unbiased Ridge Estimator,” Sankhya: The Indian Journal of Statistics, Series B, 48, 342–346.
- van der Vaart, A. W. (1998), Asymptotic Statistics, Cambridge: Cambridge University Press.
- van Schaik, P., Peng, Y., Ojelabi, A., and Ling, J. (2019), “Explainable Statistical Learning in Public Health for Policy Development: The Case of Real-World Suicide Data,” BMC Medical Research Methodology, 19, 152. DOI: 10.1186/s12874-019-0796-7.
- van Wieringen, W. N., Stam, K. A., Peeters, C. F. W., and van de Wiel, M. A. (2020), “Updating of the Gaussian Graphical Model Through Targeted Penalized Estimation,” Journal of Multivariate Analysis, 178, 104621. DOI: 10.1016/j.jmva.2020.104621.
- Verbeke, G., and Molenberghs, G. (2009), Linear Mixed Models for Longitudinal Data, New York: Springer.
- Zhao, P., Hoi, S. C. H., Wang, J., Li, B. (2014), “Online Transfer Learning,” Artificial Intelligence, 216, 76–102. DOI: 10.1016/j.artint.2014.06.003.