
ABSTRACT
The transition from secondary to tertiary education varies from country to country. In many countries, secondary school is concluded with high-stakes, national exams, or high-stakes entry tests are used for admissions to tertiary education. In other countries, secondary-school grade point average (GPA) is the determining factor. In the Netherlands, both play a role. With administrative data of close to 180,000 students, we investigated whether national exam scores or secondary school GPA was a better predictor of tertiary first-year retention. For both university education and higher professional education, secondary school GPA was the better prediction of retention, to the extent that national exams did not explain any additional variance. Moreover, for students who failed their exam, being held back by the secondary school for an additional year and entering tertiary education one year later, GPA in the year of failure remained as predictive as for students who had passed their exams and started tertiary education immediately. National exam scores, on the other hand, had no predictive value at all for these students. It is concluded that secondary school GPA measures aspects of student performance that is not included in high-stakes national exams, but that are predictive of subsequent success in tertiary education.
Introduction
Internationally, there is large variation in how the transition from secondary to tertiary education is organized. This is partly caused by differences in organization (both of secondary and tertiary education), but also in what scores are used to determine access to tertiary education.
In many countries, high-stakes national exams are used either as an entry ticket to tertiary education or as a means to assign rare or coveted places in higher education to prospective students. National high-stakes exams are standard in Asian countries such as China, Japan, India, South Korea, Vietnam and Bhutan (UNESCO Bangkok Office, Citation2020), but also for example West Africa (which has one exam board for all anglophone countries) or Greece (Sianou-Kyrgiu, Citation2008). Within the OECD, national exams, either at the end of secondary school or organized as separate entrance exams, are used for admissions by 70% of member and partner nations (OECD, Citation2017; table D6.5).
A few countries use school grade-point average (GPA), i.e., some average of grades on school-administered tests, for that role. For example, in Flemish Belgium there are no national exams, and entry to universities is done on the basis of passing school exams (Government of Flanders, Citation2021). The same is true of Austria, and some Bundesländer of Germany assigns spots at its universities based on school GPA. The Netherlands uses an average of school GPA and national exam scores to determine access.
In the USA, graduation is typically on the basis of GPA (with some states mandating exams being passed, but not necessarily at the end of high school). However, in college admissions often a high weight is assigned to standardized tests that students take in their final year of high school, such as the SAT and ACT (Westrick, Le, Robbins, Radunzel, & Schmidt, Citation2015). These are not the same as national exams: They are one-day tests, and were designed to be as much a measure of aptitude as of achievement tests (SAT was originally the abbreviation of Scholastic Aptitude Test, although this full name is not used anymore).
The ideal roles of standardized exams, standardized tests and high school GPA in determining admission to college remain highly controversial. Some argue that standardized tests provide a fair bar for all to pass (Westrick et al., Citation2015), while others have argued that standardized tests are biased against disadvantaged and minorities (Kohn, Citation2001), and that GPA actually predicts retention in college better than standardized tests such as the SAT. This is a highly relevant discussion, since admitting or selecting students on the basis of criteria that are not in fact predictive of success in tertiary education, would introduce biases and unfairness.
The Netherlands provides an ideal ground to investigate the roles of standardized exams and high-school GPA in admissions. Students graduate secondary education on the basis of an average of two sets of exams. Half of the eventual grades are based on national, high-stakes exams. The other half is determined by what is called “school exams.” This is somewhat of a misnomer, as school exams are, in most schools, actually GPAs computed over a multitude of teacher-designed tests administered in the last two years (VO-raad, Citation2018).
Both GPA and national exam scores are registered in a national database. Here, we analyzed with help of this nation-wide database whether either GPA or grades on high-stakes national exams are a better predictor of first year retention in tertiary education. First-year retention was chosen as dependent measure because it is often highly predictive of subsequent graduation (Westrick, Schmidt, Le, Robbins, & Radunzel, Citation2021). In the Dutch setting, between 78% and 81%Footnote1 of dropout occurs in the first year, meaning that a student who does not drop out or switch programs in the first year has a 83% to 89% chance of graduating (Dutch Inspectorate General of Education, Citation2020).
Theoretical framework
A priori, we distinguish five reasons that might cause national exam scores (or standardized tests) to be better predictors of higher education retention than GPA.
Uniform exams administered in a standardized way ensures that scores mean the same, independent of where the test has been administered. This is not guaranteed for GPA, where different school standards and strictness might explain part of the variance in scores (Westrick et al., Citation2015).
GPA also includes grades that are partly based on noncognitive factors such as persistence, diligence or good behavior, which may be taken as reducing their validity of predictor of cognitive performance (Sawyer, Citation2007).
Standardized tests and national exams tend to have very high standards of quality control, resulting in high reliability. Tests produced within schools, on the other hand, tend to have a low reliability (Frisbie, Citation1988).
Boards producing standardized tests tend to ensure that scoring is stable from year to year, whereas school grades may be subject to grade inflation.
Specifically for standardized admissions tests, these can be optimized for predicting success in higher education, for example by focusing on skills deemed essential for success. This is impossible for school exams that enter into GPA, which are intended to measure current achievement and not future success.
On the other hand, there are four reasons to suspect that GPA might be a good predictor of subsequent success:
GPA is an average of multiple tests. This means that through the law of large numbers, unintended sources of variance in the scores will average out. Noise caused by unreliable tests will average out, but also the “good days” and “bad days” that might cause unexpectedly high or low scores on the single high-stakes test occasion.
GPA might include grades of skills that are predictive of later success, but that cannot be measured with sufficient reliability to be included in national exams, such as research, essay writing or collaboration.
High-stakes tests may cause significant anxiety in students, which would lead those students to underperform (UNESCO Bangkok Office, Citation2020).
Whereas high-stakes exams may be a good measure of peak performance, GPA may reflect aspects such as grit, conscientiousness, or motivation that are necessary for consistent performance over the long run. For example, stamina in the low-stakes tests of PISA (which have no consequences for the individual student) is correlated with later success in life (Borghans & Schils, Citation2018).
Research questions and hypotheses
Our main research question is thus:
Is secondary school GPA or national exam scores a better predictor first-year retention in tertiary education?
Since there are convincing reasons in favor of both GPA and exam scores, we tested the two-sided hypothesis that secondary school GPA and exam scores are not equivalent predictors of tertiary education retention. We tested this hypothesis in two cohorts of students entering tertiary education (within two tracks, see below), and in one cohort of students who had failed their secondary school exams and entered tertiary education one year later.
Materials and methods
Context
The study was performed in the Netherlands, which has a publicly funded, highly tracked educational system (see ). At the end of primary school, students are divided into different tracks that each lead up to a different form of tertiary education: higher professional education and university. Here, the former is focused on higher professions, similar to the polytechnical universities as they existed in Britain or the Fachhochshule of Germany. University education provides a science-based general tertiary education.
Figure 1. The Dutch Education System, with ISCED levels and standard Dutch abbreviations in parentheses (from Cornelisz & Van Klaveren, Citation2018). After finishing primary education (grade six) children are tracked into three educational levels based on the recommendation of primary schools. The two routes investigated here is from pre-university education (6 years) to university (3 to 5 years), and from upper secondary general education (5 years) to higher professional education (four years).
In secondary education, students can choose to specialize, which implies taking a package of subjects in a certain direction. Students typically take 8–12 subjects in the last two years, with school work resulting in one grade from 1 (lowest) to 10. They can then do national exams in 7 to 9 subjects, again resulting in grades from 1 to 10. These are administered in May, with a resit in June for students who failed an exam or could not take the original exam for some reason. Graduation rules are complex, and vary from year to year. In most years, the average grade on national exams cannot be lower than 5.5. Moreover, the average of school and national grades (with both counting for 50%) cannot be lower than 6 for a circumscribed number of subjects. This means that the likelihood of graduation gets progressively lower as GPA or average national exam score gets lower, but some students with grades below the pass level of 6 still make it thanks to a fortunate combination of grades.
Two pathways will be investigated: from pre-university education to university, and from upper secondary general education to higher professional education. Typically, some 20% of students follow the first route, 30% the second. In both combinations, passing exams at the end of secondary education is an entry ticket to higher education. Pre-university education also gives access to higher professional education, but this route is rare (some 5% of pre-university students take this route). Selection on the basis of grades is rare, only occurring for a few programs that are heavily oversubscribed (mostly in the medical field).
Data
The Dutch national institute for statistics (CBS) collects data from all publicly-funded educational institutions. These are linked and made available for research in a project called the National Cohort study of Education (NCO; Haelermans et al., Citation2020). For secondary education, exam grades are available, while for institutions of tertiary education, first-year retention and drop-out can be reconstructed from registration data. We used exam grades from the 2014 and 2015 exam cohorts to predict retention in higher education for 2015 and 2016, respectively.
Grades were rounded to 0.1 grade point, and data for all students whose grades occurred less than 10 times in the data set was deleted to guard against identifiability of individual students. After this step, data from 106,167 students was available to study the upper secondary general education to higher professional education pathway, and from 71,772 students to study the pre-university to university pathway.
Analyses
Our main outcome measure was retention during the first year of tertiary education. Since this is a dichotomous measure, we used logistic regression as the main analysis. As predictors, we used either the average of national exam grades, or school GPA, or the average of the two. We performed these analyses separately for students in pre university education and upper secondary general education. Since school GPA and average exam grade contain different subject grades for different students, we repeated the analyses for secondary school profiles (i.e., different packages of subjects), and for different clusters of tertiary education programs.
No control variables (i.e., gender or ethnicity) were included in the analyses. This was because covariates would take out different proportions of variance from the predictors, which would make comparison between them impossible.
Only students who passed the exams could be included in the main analyses, as only those entered tertiary education (90% of pre-university education, 88% of upper secondary general education). However, some of the students who failed their exams in 2014 were able to pass one year later and entered tertiary education in 2015. Since some of these students failed specifically because of a low school GPA or low national exam grades, this allowed us another look at the predictive value of exam grades for success in tertiary education.
Results
gives mean and standard deviation for the two predictors, school GPA and national exam scores. Also listed in the table is the first-year retention rate in tertiary education, which is higher for university than higher vocational education. Exam grades and retention rates were highly similar for the two studied cohorts. While averages were similar for the two predictors, standard deviations were generally lower for GPA than for national exam scores. The two predictors were relatively highly correlated, r = 0.69 (p < .001) for upper general secondary education, and r = 0.79 (p < .001) for pre-university education (for individual subjects this correlation varied from 0.35 and 0.8, with most subject having a correlation between 0.5 and 0.65 between GPA and national exam score).
Table 1. Descriptive statistics of secondary education grades (both national exam grades and school GPA, on a 1-10 scale) and tertiary education first year retention as a function of track (upper secondary general education vs pre-university education), and of cohort. Cohorts are listed with respect to their exam year – i.e., the 2014 cohort passed their exams in 2014, and their first year-retention was computed for the 2014-1015 academic year (i.e., from September 2014 to August 2015).
shows first-year retention in tertiary retention as a function of either national exam score, or school GPA and then separately for the two pathways and the two cohorts. There was little difference between the cohorts, so we concentrate on the other variables. also shows, in dotted lines, the frequency distribution of both exams. The curves are higher for upper secondary general education because more students graduate within this track. Moreover, the distribution is narrower for this track, with in particular fewer high grades than for pre-university education. Also, the distribution is broader for national exam grades than for school GPA, reflected in higher standard deviations (see ).
Figure 2. Tertiary education retention as a function of either national exam grades (left) or school GPA (right), for exam years 2014 and 2015. This is shown separately for the upper secondary general education – higher professional education pathway (UGE -> HPE), and for the pre-university – university pathway (preU->U). Dotted lines show the frequency distribution of grades for both tracks of secondary education. For pre-university students, the best-fitting logistic regression curve is shown with both national exam grades and school GPA (‘log. regr’).
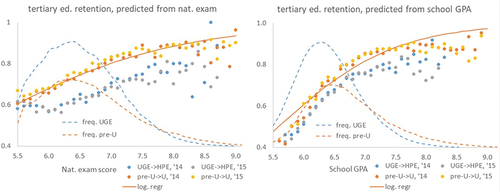
shows that retention generally increases as a function of grades in secondary education. The apparent exceptions in the upper grade range, in particular for upper general secondary education, are due to low student numbers (N < 200 for grade 8.3 and higher for upper general secondary). Moreover, the increase in retention rate as a function of grade was steeper for school GPA than for national exam grades, suggesting that GPA was a better predictor of retention than were exam grades.
This was confirmed by our logistic regression analyses (see ). For both pathways, school GPA was a much stronger predictor than were national exam grades, explaining two to four times as much variance (both predictors did not explain much variance in absolute terms, reflecting that retention and dropout are a factor of much more than factors than just secondary school grades). We also investigated whether the average of school GPA and exam grades would predict retention better than school GPA alone, which turned out not to be the case (as shown by lower regression coefficients and lower explained variance for the average as for school GPA).Footnote2
Table 2. Logistic regression outcomes, in which first-year retention was regressed to one of four predictors: national exam grades, school GPA, the average of those two, and GPA normalized within the school. Since variance was not the same for each predictor, the regression coefficient B was multiplied by the standard deviation of the predictor to increase comparability. All regression analyses were highly significant (p<.001). The analyses were done separately for the upper secondary general education to higher professional education pathway (UGE, and the pre-university to university pathway.
The analysis was repeated for four different school exit profiles. Secondary school students choose one of these four (nature & technics, nature & health, society & economics, and humanities), and with that a mandatory set of school subjects in which to graduate. Since both GPA and national exams cover different subjects as a function of school exit profile, predictive value of the two might be different in each profile. This was not the case. While the predictive value varied per school exit profile (stronger for social sciences than for STEM), for each profile school GPA predicted retention better than did national exam grades. We also repeated the analysis and three clusters of tertiary education majors (STEM, social sciences, and humanities), since dropout might be predicted by different variables in each cluster. Predictive value of school GPA and exams was stronger for social science and humanities than for STEM, but again for each cluster school GPA predicted retention better than did national exam grades.
School GPAs are not standardized across schools. Some form of standardization, be it z scores or a school ranking, could predict first-year retention in tertiary education even better than raw school GPA could. We tested this by normalizing GPA within schools, and using this normalized GPA as a predictor. No increase in predictive value was found; instead, explained variance decreased slightly (see ).
We then turned to students who had failed to graduate in 2014, but did manage to graduate in 2015 and start their tertiary education. We identified 3829 upper general secondary education students and 1454 pre-university students for whom this was the case. The same analysis yielded 4257 and 3125 students at the two levels who had graduated in 2014, but nevertheless only started with tertiary education in 2016. We call these students gap-year students, because presumably the majority of them took a gap year in between secondary and tertiary education.
In , tertiary education retention is plotted for both groups, together with that of students who graduated in 2014 and immediately started tertiary education (the students also plotted in ). Note that the range of grades is necessarily restricted for students who failed their exams, with an overlap between the three distributions only around the pass grade of 6.0. The distribution of GPAs of failed students is shifted to the right relative to exam grades, reflecting the fact that students with very low GPAs tend to already be retained before the final exam year (meaning that low GPAs don’t present themselves), but students with reasonably high GPAs can still fail miserably at the national exams.
Figure 3. Tertiary first-year retention as a function of either national exam scores or school GPA, separately for the upper general secondary -> higher professional education pathway (left panels) and the pre-university -> university pathway. The three plotted groups are students who failed their exam in 2014, graduated one year later, who graduated in 2014 but only started tertiary education in 2016 (“grad., gap year”), and who graduated in 2014 and started in 2015 (“grad., immed start”, the group also plotted in Figure 2).
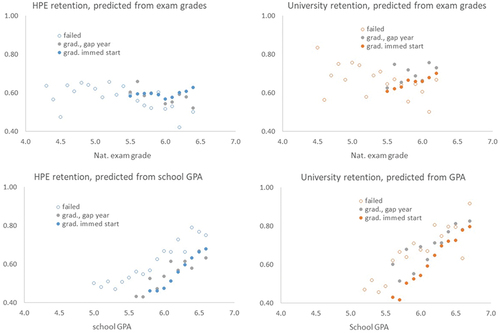
Notwithstanding this, there is a striking difference between how well exam grades and GPAs predicted later tertiary first-year retention. Whereas exam grades had virtually no predictive power for this subgroup, GPAs were as predictive for student who failed their exams as for students who had graduated and either took a gap year or started tertiary education immediately. A logistic regression analysis confirmed this: whereas the regression coefficient for average exam grade was actually negative (−.25 for higher professional education, −.44 for university education), for school GPA it was in the same order of magnitude as that of graduating students (.56 for higher professional education.68 for university education – compare with ). It is striking that school GPA predicts tertiary education even when there is an intervening year, but national exam scores do not.
However, an upward shift did occur: for the same school GPA, retention rate was 14% (higher professional education) to 11% (university education) for failed students than it was for students who immediately started with tertiary education. This may partly reflect the benefit of an extra year of secondary schooling. Gap-year students also had some benefit relative to immediate starters with the same GPA (2.5% to 7.5%), which suggests that the benefit may partly reflect simple maturing.
Discussion
Here, we show that school GPA predicts retention in tertiary education substantially better than do grades on high-stakes national exams. This was shown by our analysis of students passing the exams and starting with tertiary education, where school GPA explained two to four times as much variance in first-year retention rates than exam grades did. However, it was shown just as vividly by our analysis of students who failed the exam but started tertiary education one year later. For these students, exam grades in the year that they were retained did not predict tertiary first year retention at all. In fact, regression parameters were negative, probably reflecting the fact that students with higher exam grades must have had low GPAs or they would not have failed the exams.
School GPA, on the other hand, predicted retention very well, in fact just as well for students who failed and had to redo their final year as for the students who passed and could start tertiary education. On the face of it, this is a puzzling finding. Since the extra year of secondary schooling did lead to a higher retention rate, it might be expected that this extra year would erase some of the predictive power of school GPA. That it does not shows that school GPA measures some student traits that remain predictive of later performance. This could be skills that are relatively stable (e.g., presentation skills), but also relatively immutable character traits such as conscientiousness, or even stable resources such as the support from parents. More research is needed to disentangle these possibilities.
We only looked at first-year retention, and it is possible that findings would have been different for, e.g., degree completion. This is not very likely. In the Netherlands, as elsewhere, first-year performance is highly predictive of later performance ((Dutch Inspectorate of Education, Citation2020; Westrick et al., Citation2015), which would leave little room for findings to be reversed in later years.
One dependent variable that might have led to different outcomes would be university GPA. Research in the USA has found that even though high school GPA is a better predictor of college retention, standardized tests are better predictor of college grades. This is true, in particular, because standardized tests are much better at predicting grades than they are at predicting retention (Saunders-Scott, Braley, & Stennes-Spidahl, Citation2018). It is possible that this would also hold in the Netherlands – i.e., that high-stake exam results predict grades in tertiary education better than does secondary school GPA, even though the latter is a better predictor of retention. This was impossible to verify with the current data. It is obvious, though, that from both the standpoint of the student and of the institution, retention is a more important variable than are grades.
It is currently not clear whether the findings generalize beyond the Netherlands to other settings. This would depend how comparable Dutch exams and school GPAs are to those used in other countries. In particular, if either national exams would be of exceptionally low or school GPA of exceptionally high quality in the Netherlands, findings might not generalize. Comparison of national exams is rarely done and would be hard to carry out. Dutch national exams are constructed by a renowned institute, Cito, according to rigorous procedures (Algra & Limmens, Citation2004), which would vouch somewhat for their quality.
With regard to school GPA, our finding that normalizing them does not increase their predictive power suggests a surprising uniformity in the school standards that determine GPAs (Van Brederode and Meeter (Citation2020). This uniformity may be an indirect benefit of the presence of national exams. Schools may use national exams to calibrate their own tests and grades, which then ensures that school GPA does not vary extremely from school to school. Whether this is true or not may have to wait international comparative research, and studies in countries that lack national exams.
In summary, school GPA predicts retention in tertiary education better than do high-stakes national exams. This does not mean that national exams are useless, as they may be part of the reason that school GPAs are such a good predictor of tertiary education retention.
Disclosure statement
The author declares that he has no interests related to this article.
Notes
1 The first number applies to universities of applied sciences, the second to regular universities.
2 Another way to prove the same point is via stepwise regression. We performed such a regression, first entering school GPA as predictor and then national exam grades as an additional one to see whether it would explain additional variance. For both pathways, this resulted in negative coefficients for exam grades – i.e., instead of explaining additional variance, exam grades were negatively related with tertiary first-year retention once the variance explained by school GPA was already accounted for.
References
- Algra, A., & Limpens, G. (2004). Examenconstructie: Een langzaam en zorgvuldig proces [exam construction, a slow and careful process]. Eucludes, 1, 2–5. Accessed 28 April 2022. https://www.cito.nl/-/media/files/kennisbank/cte/artikelen-in-tijdschriften/cito_euclides-080_2004-05_01-over-examens-maken.pdf?la=nl-nl
- Borghans, L., & Schils, T. (2018). Decomposing achievement test scores into measures of cognitive and noncognitive skills. Working paper at SSRN. doi: 10.2139/ssrn.3414156
- Cornelisz, I., & van Klaveren, C. (2018). Student engagement with computerized practising: Ability, task value, and difficulty perceptions. Journal of Computer Assisted Learning, 34(6), 828–884. doi:10.1111/jcal.12292
- Dutch Inspectorate of Education. (2020). In- en doorstroommonitor hoger onderwijs 2009-2018 [Monitor success in higer education 2009-2018]. Retrieved from https://www.onderwijsinspectie.nl/binaries/onderwijsinspectie/documenten/themarapporten/2020/06/02/in-en-doorstroommonitor-hoger-onderwijs-2009-2018/In-+en+doorstroommonitor+hoger+onderwijs+2009-2018.pdf. Accessed September 30, 2022.
- Frisbie, D. A. (1988). Reliability of scores from teacher‐made tests. Educational Measurement: Issues and Practice, 7(1), 25–35. doi:10.1111/j.1745-3992.1988.tb00422.x
- Government of Flanders. (2021). onderwijs.vlaanderen.be. Toetsen en beoordelen [Testing and assessment]. Retrieved from https://onderwijs.vlaanderen.be/nl/toetsen-en-examens#in-het-secundair-onderwijs. Accessed Feb. 4, 2021.
- Haelermans, C., Huijgen, T., Jacobs, M., Levels, M., van der Velden, R., van Vugt, L., & van Wetten, S. (2020). Using data to advance educational research, policy, and practice: Design, content, and research potential of the Netherlands cohort study on education. European Sociological Review, 36(4), 643–662. doi:10.1093/esr/jcaa027
- Kohn, A. (2001). Two cheers for an end to the SAT. Chronicle of Higher Education, 9, 1–12.
- OECD. (2017). Education at a Glance 2017: OECD Indicators. Paris: OECD Publishing. doi:10.1787/eag-2017-en
- Saunders-Scott, D., Braley, M. B., & Stennes-Spidahl, N. (2018). Traditional and psychological factors associated with academic success: Investigating best predictors of college retention. Motivation and Emotion, 42(4), 459–465. doi:10.1007/s11031-017-9660-4
- Sawyer, R. (2007). Indicators of usefulness of test scores. Applied Measurement in Education, 20(3), 255–271. doi:10.1080/08957340701431245
- Sianou‐Kyrgiou, E. (2008). Social class and access to higher education in Greece: Supportive preparation lessons and success in national exams. International Studies in Sociology of Education, 18(3–4), 173–183. doi:10.1080/09620210802492757
- UNESCO Bangkok Office (2020). Large-scale learning assessments in Asia-Pacific: A mapping of country practices. Report. Accessed Feb 4, 2021. https://unesdoc.unesco.org/ark:/48223/pf0000375107
- Van Brederode, M., & Meeter, M. (2020). Hoe statistiek het schoolexamen verdacht maakte en waarom schoolexamens dat niet verdienen. [How statistics made school GPA suspect and why that is undeserved] ScienceGuide. Accessed Feb 4, 2021. https://www.scienceguide.nl/2020/05/hoe-statistiek-het-schoolexamen-verdacht-maakte/
- VO-raad. (2018). Een volwaardig schoolexamen [A worthy school exam]. Report. Accessed Feb 4, 2021. https://www.vo-raad.nl/system/downloads/attachments/000/000/696/original/Een_volwaardig_schoolexamen_Rapport_Commissie_Kwaliteit_Schoolexaminering_17_december_2019.pdf
- Westrick, P. A., Le, H., Robbins, S. B., Radunzel, J. M. R., & Schmidt, F. L. (2015). College performance and retention: A meta-analysis of the predictive validities of ACT ® Scores, high school grades, and SES. Educational Assessment, 20(1), 23–45. doi:10.1080/10627197.2015.997614
- Westrick, P. A., Schmidt, F. L., Le, H., Robbins, S. B., & Radunzel, J. M. R. (2021). The road to retention passes through first year academic performance: A meta-analytic path analysis of academic performance and persistence. Educational Assessment, 26(1), 35–51. doi:10.1080/10627197.2020.1848423