
Abstract
Cobalt-rich ferromanganese crusts (CRC) are potential resources for Co, Ni, Pt, and other strategic metals. The CRC thickness varies from a few mm to more than 100 mm at various distance scales over the rock outcrops in the seamounts. However, their variation patterns and controlling factors are not well understood. We conducted a comprehensive small-scale survey, including shipboard acoustic measurements, seafloor observations, and rock drilling over the Xufu Guyot of the Marcus-Wake seamounts in the Northwestern Pacific to characterize the thickness variations on a scale of several kilometers with the topography and geological evolution of the guyot. Rock drilling revealed that thicker CRC (>100 mm) tend to occur on the margins and flat areas on the guyot, while thinner CRC are associated with carbonate reef mounds over the volcanic pinnacles and seamount slopes. The microstratigraphic description indicated that the CRC thickness is strongly related to the geological evolution of the guyot, mainly the stability of the substrate rocks and coverage with calcareous pelagic sedimentation.
1. Introduction
Cobalt-rich ferromanganese crusts (CRC) occur on seamounts, ridges, and plateaus and are chemical sedimentary rocks formed mainly by hydrogenetic processes that precipitate directly from seawater at extremely slow rates from a few mm to approximately 10 mm per million years (e.g., Hein et al. Citation2000). The CRC have been thus studied as geological cores recording long-term paleoceanographic environments and geological or non-tectonic events (e.g., Hein et al. Citation1992; Ren et al. Citation2007; Josso et al. Citation2020, Citation2021), as well as important potential resources for Co, Ni, Pt, and other metals (e.g., Halbach et al. Citation1989; Usui and Suzuki Citation2022). The following are mineral resource aspects of CRC: (1) they concentrate Co, Ni, Pt, and other scarce metal elements during growth and form stiff coverage on the seabed, ranging from a few to more than 100 mm thick and extending over several hundred km2 or more in some locations; (2) the areal abundance (kg/m2) is generally equivalent to up to 200 kg/m2 assuming a wet specific gravity of 2.0 compared with that of deep-sea manganese nodules of less than 50 kg/m2 (e.g., Hein et al. Citation2015; Hino and Usui Citation2022); (3) they occur commonly at rock outcrops in 1000–2500 m water depth or probably beyond the deeper floors (Hein et al. Citation2000, Usui et al. Citation2017), which are shallower than that of manganese nodules in deep basins (5,000–6,000 m depth). Japan, China, Russia, and South Korea are exploring the CRC in Western Pacific seamounts under exploration contracts with the International Seafloor Authority (e.g., International Seabed Authority Citation2012; Kim et al. Citation2006; Yang et al. Citation2020, Citation2022; Zhao et al. Citation2020a, Citation2020b; Hino and Usui Citation2022).
The geological characteristics of CRC in the Northwestern Pacific include a close association with old rock substrates (e.g., Usui and Someya Citation1997; Usui et al. Citation1999; Moore and Clague Citation2004; Goto et al. Citation2014; Kisimoto et al. Citation2017), extremely slow and continuous growth to present (e.g., Usui et al. Citation2007, Citation2017), water-depth and secular variations (e.g., Usui and Someya Citation1997; Usui et al. Citation2017; Hino and Usui Citation2023). The continuous growth can be interrupted by mass wasting (e.g., Usui and Okamoto Citation2010; Moore and Clague Citation2004) or sediment cover (e.g., Zhao et al. Citation2020a, Citation2020b; Yamazaki and Sharma Citation1998). Thus, while the regional variation in CRC in the Northwest Pacific is known, limited methods are available to describe the small-scale variation in grade and abundance of the deposits. The earlier shipboard study and resource exploration as well as the geochemical and geological descriptions of CRC have shown some relationships to the regional- and small-scale variation patterns of CRC and related geological environments on the sea floors. Here, we present a case study of the variability in the nature and thickness of CRC deposits in relation to smaller-scale geological environments in a small seamount.
There is no easy remote sensing method to estimate the areal variation in the thickness of CRC, although shipboard acoustic measurements and seafloor observations can provide topography and images of the seafloors. Rock sampling using a drill or a remotely operated vehicle (ROV) is a robust way to characterize the occurrence and morphology of CRC. In this study, we conducted a combined exploration supported by shipboard acoustic measurements such as multibeam echo sounder (MBES) and sub-bottom profilers (SBP), seafloor video-observations using ROV, and rock drilling using the benthic multi-coring system (BMS) to characterize CRC thickness on the typical flat tops of the Xufu Guyot (called “JA06 seamount” on site), one of the Marcus-Wake seamount group in the Northwest Pacific. The controlling factors that determine the areal variations in CRC thickness were considered.
2. Geology and topography of the Xufu Guyot
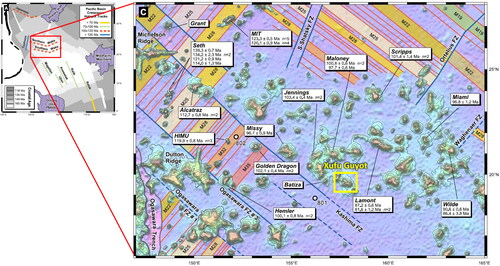
The Western Pacific seamounts are the most cobalt-rich and high-resource potential regions of CRC in the world oceans (e.g., Hein et al. Citation2013). Seamounts in this region formed from hotspot mantle plumes during the Cretaceous (; e.g., Koppers et al. Citation2003). Many 80–120 Ma old seamounts (Koppers et al. Citation2003; Yamaoka et al. Citation2022) are distributed throughout the Jurassic oceanic crust (e.g., Smith et al. Citation1989; Nakanishi and Gee Citation1995). The Xufu Guyot in this study is a member of the Marcus-Wake hotspot seamount group. The Marcus-Wake seamount volcanic rocks are typical oceanic island alkaline basalts, and their rock geochemistry and isotopic compositions indicate mantle sources similar to those of the younger South Pacific seamount group (Smith et al. Citation1989; Janney and Castillo Citation1999). Large-scale Mesozoic volcanism has been associated with the large mantle thermal anomalies (South Pacific isotopic and thermal anomaly; SOPITA) that currently exist in the South Pacific (Li et al. Citation2021).
Figure 1. Map of the 40Ar/39Ar ages of the Marcus-Wake seamount group (Koppers et al. Citation2003) and the location of the Xufu Guyot. The 40Ar/39Ar ages are shown in conjunction with the Jurassic geomagnetic reversals (red lines) and fracture zones (FZ: blue lines) for the oceanic basement (Koppers et al. Citation2003).
The islands formed from hotspot volcanoes, were flattened by wave erosion, and then started to subside to finally form drowned flat-topped seamounts called guyots (e.g., Flood Citation1999; Glasby et al. Citation2007; Okamoto and Usui, Citation2014). Guyots and seamounts are major landforms in the Western Pacific, many of them having subsided below sea level, while Marcus and Wake islands are still above sea level (Li et al. Citation2021). The flat tops of the guyots of the Marcus-Wake seamount group were initially formed at sea level, however, their carbonate reefs were not well-developed (Winterer et al. Citation1993). In contrast, the Magellan seamount group located to the south is characterized by a pelagic calcareous sediment cover on the top (Zhao et al. Citation2020a, Citation2020b).
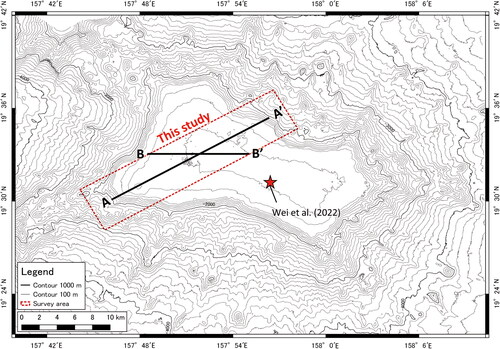
Xufu Guyot is one of the six seamounts within the licensed exploration area of the Japan Organization for Metals and Energy Security (JOGMEC), on which Hino and Usui (Citation2022) conducted a microstratigraphic analysis of CRC and discovered a variety of substrates and a typical flat-topped seamount topography. The guyot has a northwest-southeast extension of 25 km in length and approximately 15 km in width (). The water depth at the flat top ranges from 1600 m to 1300 m, is shallower in the center, and gradually deepens toward the margins. The dredged sample from the flat top of the Xufu Guyot has been reported to be 116.4 Ma (Wei et al. Citation2022) by 40Ar/39Ar dating of the volcanic rocks and 80.0 ± 2 Ma and 86.5 ± 2 Ma (Yamaoka et al. Citation2022) by K-Ar dating. The chemical composition of the volcanic rocks is typical ocean-island alkaline basalts (Yan et al. Citation2021; Wei et al. Citation2022; Yamaoka et al. Citation2022). A drill core sample (02JA06BMS02A) from flat top recovered foraminiferal wackestones dated to the middle Eocene (Zone P10–P14) (Yasufumi Iryu, Tohoku University, unpublished, pers. comm. 2023).
Figure 2. Contour map of the Xufu Guyot. The A-A′ and B-B′ cross section lines in are shown. Seafloor observation by ROV and drilling survey by BMS were conducted on the A-A′ cross section line, and SBP survey was conducted from a ship on the B-B′ cross section line. Star mark is the sample location of the volcanic rock sample that shows 116.4 Ma based on40Ar/39Ar dating (Wei et al. Citation2022). Yamaoka et al. (Citation2022) reported volcanic rocks with K-Ar ages of 80.0 ± 2 Ma and 86.5 ± 2 Ma in this guyot, although the sample locations are unknown. The red dotted box is the study area.
3. Methods of on-site survey and analysis
3.1. Shipboard acoustic measurements
The marine resources research vessel Hakurei (owned by JOGMEC) was used to conduct MBES and SBP surveys.
The MBES mounted on Hakurei was an EM122 (Kongsberg Maritime, Norway) that transmitted 432 beams with a beam swath of 1°×1°. The EM122 MBES is a high-performance echo sounder for deep-sea use that provides bathymetric and backscatter intensity data. Sound velocity correction was performed using sound velocity profile data acquired from surface water velocimeters and conductivity temperature depth profilers during cruising in the study area. The software of Marine Discovery 10 (referred to as MD 10; Ocean High Technology Institute, Inc., Japan) was used to process the bathymetric and backscatter intensity data. These data were generated as grid files using MD10 after the removal of spike noise, and each grid showed the average values for each bin. As the study area had a high-density MBES survey with a horizontal resolution of approximately 30 m at a water depth of 1000 m, a grid spacing of 30 m was selected to generate grid files for bathymetry and backscatter intensity. Then, we generated contour and slope maps and a 5× vertical red relief image map (Chiba, Kaneta, and Suzuki Citation2008) at 30 m raster resolution using bathymetry data. All data were projected onto the Universal Transverse Mercator coordinate system to support spatial analysis.
A narrow-beam sub-bottom profiler (n-SBP; Teledyne Marine, USA) system was used for the SBP survey. Data were collected from the same survey lines as the MBES. The acquired data were mapped using MD10 to determine the thickness of the unconsolidated sediment layer below the seafloor. The resolution of the sediment layer in this specification was approximately 15 cm.
3.2. Seafloor observations using ROV
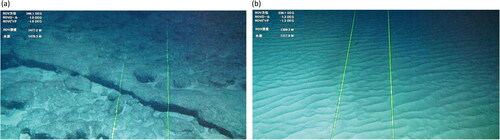
We used either a high-resolution camera mounted in front of the ROV or a vision-based mapping system (referred to as SeaXerocks; Thornton et al. Citation2013) mounted at the bottom of the ROV to observe the seafloor. The ROV navigated at an altitude of approximately 1.5–2 m for the high-resolution camera to view the seafloor. SeaXerocks was developed by the Institute of Industrial Science, the University of Tokyo and consists of a single camera, a sheet laser, a light, and a shade to create accurate 3D color reconstructions of the seafloor (Thornton et al. Citation2013). SeaXerocks is capable of continuously imaging the seafloor surface at high altitudes and is effective in mapping the distribution of CRC. For the SeaXerocks to view the seafloor over a wide area, the ROV navigated at an altitude of approximately 10–12 m. The resolution of the seafloor images from the high-resolution camera and SeaXerocks was within 1 cm, which is acceptable for determining CRC or sediments. The obtained ROV position was relative to the position of the ship, using an ultrashort baseline transponder. The typical seafloor image of the CRC is shown in , and the sediment seafloor is shown in . Based on these images, a seafloor route map of the ROV survey line was constructed.
Figure 3. Representative photos of CRC (a) and sediments (b) in the survey lines. The photos are captured images from the ROV's forward high-resolution camera (approximately 1.5 m altitude and approximately 3 m width). The width of the two green laser beams is approximately 70 cm.
3.3. Rock sampling using deep-sea drills
Rock sampling was performed using a BMS (NiGK Corporation, Japan) with a TV camera at the bottom, observing the seafloor, and drilling two to four cores per site where the CRC are exposed. The BMS contained up to 12 core barrels with plastic tubes inside, with a core diameter of 10 cm and a maximum drilling depth of 50 cm below the sea floor. The acquired drilled samples were recovered on board, water-cleaned, and split in half with a diamond saw. Cross sections were photographed, and geological and physical properties were described.
3.4. Microstratigraphic geological description
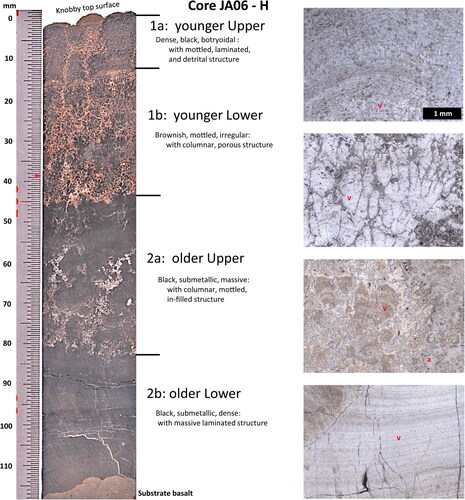
The microstratigraphic characteristics and the correlations among the CRC drill cores of this seamount were described in comparison with the standard stratigraphy of the CRC within () the six seamounts in the Northwest-Pacific JOGMEC exploration area (Hino and Usui Citation2022). The standard stratigraphic section for the CRC indicates markedly divided layers of the younger non-phosphatized (Layer 1) and older phosphatized (Layer 2) portions, which clearly differ in appearance, physical properties, and chemical and mineralogical compositions (e.g., Koschinsky et al. Citation1997; Nishi et al. Citation2017; Hino and Usui Citation2022, Citation2023). The boundary age of Layers 1 and 2 is assumed to be middle Miocene (9–15 Ma) as is correlated to the final stage of suggested global phosphogenesis in the Western Pacific (Hein et al. Citation1993, Citation2000). Moreover, each layer can be subdivided (Layer 1a, Layer 1b, Layer 2a, and Layer 2b) based on the microstructure and contents of clastic debris which are markedly correlated on a regional scale over the Northwest Pacific Ocean (Hino and Usui Citation2022). The thickness of the CRC was measured perpendicular to the CRC layer, as described in Hino and Usui (Citation2022).
Figure 4. Standard microstratigraphic section of CRC (based on Hino and Usui, Citation2022).
4. Results
We characterized the variation patterns in CRC thickness on a scale of kilometers mainly in the flat tops, and compared with the topography and geology of the guyot. The results of shipboard acoustic measurements, ROV seafloor visual observations, and the correlation of CRC stratigraphy and distribution of substrate were compared.
4.1. Shipboard acoustic measurements
The study area and the A-A′ section (total length: 20 km) in indicate the characteristic topography and geology of the Xufu Guyot. The red relief image map () shows the uppermost flat elevations in white and steep slopes in deep red (Chiba et al. Citation2008). In the survey line, two distinct mounds with approximately 2 km in diameter and 100 m in relative height are identified on the eastern and western margins of the flat top. We assumed that these were probably carbonate reefs overlying the volcanic pinnacles formed at the final stage of drowning.
Figure 5. (a) Bathymetry map, (b) slope map, (c) A-A′ cross section of bathymetry and slope, (d) red relief image map (5 × vertical), (e) backscatter intensity map, and (f) B-B′ cross section of the SBP in the study area. From the A-A′ cross section of the slope in (c), the flat top of the guyot were defined as less than 30°, the slope turning point of the flat top and flank.
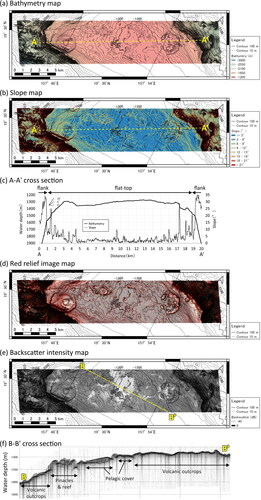
The backscatter intensity () is one of the most sensitive criterion in identifying bottom materials. Low reflectivity indicates the sediment-filled depression, and high reflectivity exposed stiff volcanic or carbonate rocks (e.g., Usui and Okamoto Citation2010; Joo et al. Citation2020). In this study, low reflectivity regions (generally below −25 dB) were partly distributed near the center of the flat top. The B-B′ cross section () of the SBP profile passes through the low backscatter region near the center of the guyot ( yellow survey line), indicating the presence of up to 10-m thick unconsolidated sediments. Even though CRC are only exposed in few places, we assumed a possible extension of buried CRC even below the thin sediment cover due to past continuous growth of CRC, as the older generation is similarly found, in fact on the ODP drill cores (Bogdanov et al. Citation1995; Murdmaa et al. Citation1995).
4.2. Seafloor observations
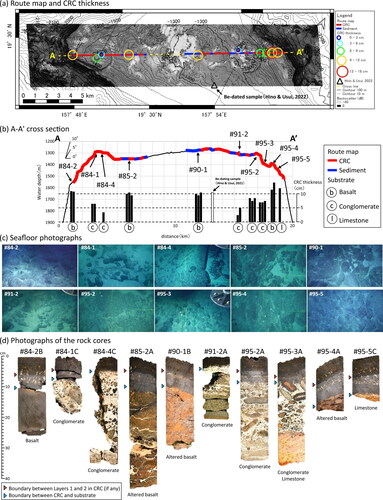
Route maps of the seafloor surface across the flat top of the seamount well indicate variation patterns of CRC occurrences in . The CRC frequently cover the margins and mounds of the guyot, whereas the areas partly of low backscatter intensity in the central part of the flat tops shows rippled foraminiferal sand.
Figure 6. (a) Route map of the seafloor and CRC thickness at each drilling site with backscatter intensity map, (b) A-A′ cross section (vertical: Horizontal = 10:1) showing the route map, CRC thickness, and substrate rocks, (c) representative seafloor photographs (5–10 m width) around each drilling site, and (d) representative photographs of the rock cores each drilling site.
4.3. Geological description of CRC
4.3.1. CRC thickness and substrate rocks
Along the A-A′ section, the 30 CRC drill cores ( and ) show the variation in thickness and rock substrates. shows the CRC layer thickness at each drill site, as indicated by the size and color of the circle. The 11 CRC cores located on the flat margins and central rock outcrops of the guyot are generally thick (average of 10.8 cm), but the remaining 12 CRC cores located over the two mounds are generally thin (average of 5.9 cm). The bar graph shows the CRC thickness variation on the A-A′ cross section, with the type of substrate projected as an initial letter (). Little variation was observed in the thickness or rock substrate within each site. The substrates are basaltic rocks and rarely limestone (#95-5 only) associated with thick CRC corresponding to the marginal and central areas of the guyot, but are calcareous conglomerates in the two mounds associated with thin CRC.
Table 1. Sample description of the 23 CRC cores from the Xufu Guyot.
When compared with the variable thickness of CRC and the substrate rock occurrence or seafloor morphology, the seabed photos at each drilling site () indicate no simple relationship to the thickness of the CRC. Sample observations of the core half-section () indicate that most of the basalt substrates are generally hard (#84-2), but some highly weathered (#85-2, #90-1, #95-4) or relatively fresh in nature. The conglomerates (#84-1, #84-4, #91-2, #95-2, upper part of #95-3) and reef-bearing limestones (lower part of #95-3, #95-5) composed of calcareous substrates are also cemented and hard (mostly phosphatized). The pebbles of the conglomerate are usually basalt, subangular to subrounded, and poorly sorted. The matrix of the conglomerate is foraminiferal sand (probably middle Eocene here; Iryu, pers. comm.), The limestone is consolidated, probably because it has experienced continuous phosphatization diagenesis. Some pebbles were thinly coated with manganese oxides (#84-4, #91-2#95-3), and poor sorting may indicate rapid burial of the Mn-coated pebbles due to mass movement or sediment drift, which may hinder the continuous hydrogenetic growth of CRC.
4.3.2. Microstratigraphy of the CRC
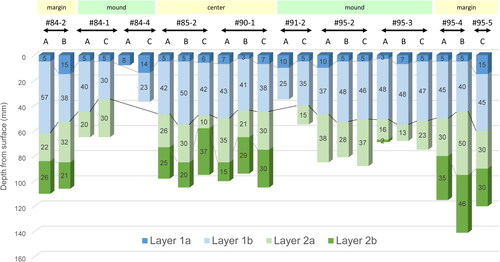
The CRC of the seamount are stratigraphically divided into several layers based on color, microstructure, presence of clastic materials, mineralogical and chemical compositions. A comparison of the CRC stratigraphy in this study is shown in , followed by the classification of Hino and Usui (Citation2022, Citation2023) (). Layer 2b occurred in the thicker CRC at the margins (#84-2, #95-4, #95-5) and center (#85-2, #90-1) of the guyot. In contrast, Layer 2a or Layer 2b in the two mounds with thinner CRC thicknesses (#84-1, #84-4, #91-2, #95-2, #95-3) is missing (#84-4 A and C, #91-2 A) or is very thin. Hino and Usui (Citation2022) reported 10Be dating of the CRC ( triangle “△” symbol) from the flat-topped part of the guyot, and the boundary age between Layers 1 and 2 of the CRC of the Xufu Guyot is calculated to be 12–13 Ma. This finding implies that the CRC cores without Layer 2 are assumed to have started growing after this age. This general microstratigraphic characterization determines the wide range of variations in the thickness of CRC on regional to small scales, in principle, controlled by the disruption of continuous growth at the bottom or top.
Figure 7. Comparative graph of stratigraphic sections of CRC, divided into 4 layers based on Hino and Usui (Citation2022). The thicker CRC have a well-developed Layer 2, while the thinner CRC have a thin or absent Layer 2.
5. Discussion
5.1. Controlling factors of variation in thickness of CRC
Our results of acoustic and visual mapping and core stratigraphy suggest that the variations in CRC thickness are strongly correlated especially with the topography and geological evolution of the guyot. Here, we summarize the variations in CRC thickness along with the topography and geology and discuss the controlling factors that determine the patterns. shows a schematic geological cross section of A-A′ that comprehensively compares the topography of the guyot, the route map of the seafloor, together with CRC thickness, and distribution of the substrate. In the study area, the CRC characteristics are typically divided into the following three facies of CRC growth ().
Figure 8. (a) Schematic of regional variation in CRC thickness in the section A-A′ and (b) topographical and geological interpretation of the study area.
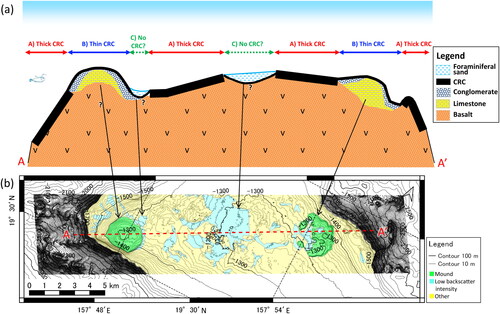
A) Thick CRC over stiff substrates: At the margins and central part of the guyot, thick CRC (approximately 10 cm) tend to cover the seafloor. Thick CRC along the top of the seamount slope and around the summit have been reported (Novikov et al. Citation2014; Tokumaru et al. Citation2015; Nozaki et al. Citation2016; Usui et al. Citation2017); however, major surrounding steep slopes around the top are believed to be unsuitable for continuous CRC growth due to sediment chutes, mass movement, and erosion (Usui and Okamoto Citation2010; Du et al. Citation2020). Pelagic sediments are in places less likely deposited, and the substrates are stiff outcropped basalt and phosphatized reef limestones at tops, which could have maintained a stable geological environment over the long term and allow the CRC to grow continuously.
B) Thinner or moderate thickness of CRC over the conglomerate substrates: The exposed rock substrate is covered with CRC of 0.8–8.5 cm thickness which is associated with rugged topography on the top. The rock substrate is mainly conglomerate (fragments are often angular basaltic rock and matrix are usually consolidated foraminiferal sands). These substrate rocks were described as a calcareous conglomerate on the top by Usui and Okamoto (Citation2010) and Hino and Usui (Citation2022), as buried ferromanganese nodules by Melnikov and Pletnev (Citation2013), and as a breccia layer by Du et al. (Citation2020). Layer 2 of the CRC is mostly absent in these areas, suggesting that the rock substrate has not been stable throughout CRC growth, mainly at the ages at middle Miocene or older, the estimated boundary age of Layers 1 and 2, based on Hino and Usui (Citation2022). Particularly at site #95-3 on the foot of the mound, the ferromanganese oxide layer, which can be correlated to stratigraphic Layer 2b, covers the rock gravel, forming small nodules. This occurrence is interpreted as the burial of Mn-coated gravel by mass movement or sediment drift, which resets the continuous growth of CRC (e.g., Usui and Ito Citation1994).
C) Thin or barren CRC overlain with thick pelagic sediments: The topmost unconsolidated pelagic carbonate sediment layers of several to 10 m cover the stiff rock substrate and CRC, as recognized in the SBP records, and seafloor observations confirmed widespread sediment coverage, often with ripple marks. The distribution of sediments in areas of low backscatter intensity has been reported by Joo et al. (Citation2020) and Zhao et al. (Citation2020a, Citation2020b), and the trends are similar to this study. The CRC are likely to become thinner or absent when the crusts are shielded from oxic bottom seawater by sediments (e.g., Usui and Ito Citation1994; Neettiyath et al. Citation2022). The rapid rate of sedimentation of foraminiferal sands (1–2 cm/ky) and bioturbation (Ota et al. Citation2022), and variable flow direction and velocity of water masses around the Xufu Guyot (Nagao et al. Citation2018) may be related to scarce pelagic sediment cover in this area. The distribution of CRC beneath sediments (several centimeters thick) has been analyzed by applying acoustic thickness measurements to the CRC (Neettiyath et al. Citation2022), and future results are expected.
In summary, the CRC facies variation on small-scale variation within a seamount is closely correlated to seamount topography and geological environments, and the major direct controlling factors for CRC thickness are “stability of rock substrate” and “deposition of pelagic carbonate sediments” on the course of seamount evolution and sedimentary history.
5.2. Geological history of the guyot and CRC formation process
Since CRC are the slowly integrated deposits of iron-manganese oxide originating from seawater over a long geological period, their occurrence and nature are expected to be related to the long geological history of seamounts. Here, we attempt to review the geological history of the Xufu Guyot and the formation processes of CRC based on the topography and bottom materials, along the schematic cross-section and CRC diversity ().
The geological history of the guyot can be compared to that of the Hawaiian Islands and the Emperor Seamount Chain, ranging from oceanic volcanic islands to drowned, flat-topped seamounts. The main typical geological processes during this period, similar to other hotspot sequences, include continuous island chains on the oceanic crust, gravitational subsidence, surface erosion, carbonate reef building, and post-submergence pelagic deposition (Du et al. Citation2020). We assumed a model of simple gravitational subsidence after erosion for the Xufu Guyot, although some evidence of small-scale volcanic reactivation and subsequent uplift have been very rarely reported in flat-topped seamounts in the Northwest Pacific (e.g., Vanneau et al. Citation1995; Hirano et al. Citation2021). At the Xufu Guyot, the substrate basalt dates between 80 and 116 Ma (Wei et al. Citation2022; Yamaoka et al. Citation2022), and the substrate limestone dates to the middle Eocene (Iryu, pers. comm.), after which CRC are thought to have started steady growth. Hino and Usui (Citation2022) reported 10Be ages of a CRC core (JA06BMS02A) at the Xufu Guyot and calculated an average growth rate of 4.6 mm/My (=57.5 mm/12.4 My). Assuming this growth rate has been constant, the bottom of the thickest CRC (141 mm: #095-4 C) is extrapolated to be approximately 30 Ma. This age of initiation is consistent with the age of the substrate limestone (mid-Eocene:41.2–47.8 Ma). Phosphatization in the substrate is reported to have occurred widely between 10 and 90 Ma in the NW Pacific seamounts (Hein et al. Citation1993; Hyeong et al. Citation2013) and between 7 Ma and 17 Ma in the CRC (Nishi et al. Citation2017). The boundary age for Layers 1 and 2 of CRC in the Xufu Guyot was approximated as middle Miocene (Hino and Usui Citation2022), suggesting that phosphatization had ended by this time in the guyot.
Based on the above review, the geological model of the evolution history of the Xufu Guyot and the related growth history of the formation of CRC are summarized below and shown in :
Figure 9. Schematic diagram of the geological history of the guyot and the formation process of the CRC in the section A-A′.
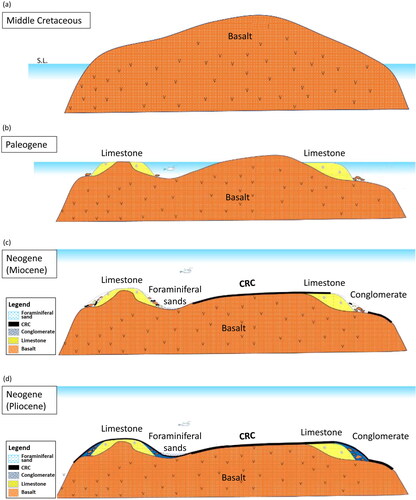
Hotspot submarine volcanoes formed oceanic islands during the Middle Cretaceous (Wei et al. Citation2022; Yamaoka et al. Citation2022) ().
Subaerial weathering and wave erosion of volcanic islands form major flat-topped topography. Submergence (e.g., Moore et al. Citation1996) and carbonate reef building began in shallow waters (e.g., Jansa and Vanneau Citation1995; Du et al. Citation2020). Atolls, reef-building limestones, and lagoonal deposits have developed, but probably not extensively ().
After the submergence of the entire island, pelagic foraminiferal sands started to be deposited over angular pebbles and breccia. In water depths below approximately 1000 m, CRC have started to grow over the exposed stiff seafloor rocks. Landforms such as steep slopes formed of basalt and reef carbonates may have been more frequently collapsed during the growth of CRC (Usui and Okamoto Citation2010; Melnikov and Pletnev Citation2013; Du et al. Citation2020). Foraminiferal sands were deposited in places on flat surfaces and depressions (Du et al. Citation2020; Ota et al. Citation2022). CRC continuously and constantly grow only if the exposed stiff rocks are maintained on the sea floors (e.g., Usui et al. Citation2017) ().
Phosphatization occurred widely both on the CRC and the exposed substrate rocks across the flat-topped areas by the middle Miocene since the Paleogene (Hein et al. Citation1993; Hyeong et al. Citation2013; Nishi et al. Citation2017; Hino and Usui Citation2022, Citation2023), and in the CRC, Layer 2 experienced dissemination and replacement by apatite minerals (corresponding to Layer 2) ().
Layer 1 has formed later as a result of the continuous growth of CRC in non-sedimentary environments (sediment hiatus) towards the modern age over the exposed substrate rocks. Regional variations are shown in .
In summary, the small-scale variations in the CRC thickness over the flat top of the Xufu Guyot can be explained by considering the geological history of the guyot, which is mainly controlled by the two inhibiting factors (“instability of rock substrate” and “pelagic carbonate cover”) when assuming continuous and constant growth of CRC. These factors are two of the most likely geological parameters that control the resource potentiality of the CRC in the area.
5.3. Applications on resource exploration of CRC
Based on the schematic cross section in the Xufu Guyot (), the geological interpretation of the seamount evolution and the associated growth of CRC indicate the three typical geological features of CRC (): (A) The marginal and central parts of the guyot, foraminiferal sands and other sediments have not been deposited but are broadly exposed except for small depressions, and the stiff and exposed substrate is assumed to be stable; (B) Two smaller mounds on top of the guyot, although foraminiferal sands and other sediments have not deposited much, the substrate is assumed to have been unstable, probably because of seafloor weathering after subsidence; and (C) Areas of low backscatter intensity, partly on the top, related to sediment cover of foraminiferal sands mainly in small depressions.
A general relationship between geological evolution and CRC generation can be indicated in the Xufu Guyot. This relationship can be leveraged for the mineral exploration of CRC deposits in new areas and to provide evidence and assurance of the continuity of CRC thickness in the prime areas. Our results indicated that understanding the geological history of seamounts is one of the key questions when considering the factors controlling the areal variation in CRC abundance. To improve the accuracy of resource exploration, additional deep drills are further required to better understand the geological history of the seamount, additional dating of the CRC and substrates, and detailed topographic surveys.
6. Conclusions
Combined surveys, including acoustic measurements, seafloor visual observations, and drill sampling, allowed for the microtopography and the determination of the geological structure of the seamount and the three typical CRC facies at scales of several hundred meters to several kilometers.
The CRC diversity reflects the close relationships between topographic features and the occurrences of substrate diversity, mainly controlled by geological evolution of the seamount.
The continuous growth of CRC has been sustained by stable substrates and the absence of pelagic sedimentation. In other words, the two parameters guarantee full growth of the CRC over the flat top seamounts in the area.
Acknowledgments
The data in this study were collected as part of projects sponsored by the Agency for Natural Resources and Energy, Ministry of Economy, Trade and Industry. We thank the following companies and universities for their cooperation in the data analysis and discussion: Sumiko Resources Exploration & Development Co. Ltd., Ocean High Technology Institute, Inc., Kochi University, and Institute of Industrial Science, the University of Tokyo. The crew of research vessel Hakurei and the chartered vessel Koyo-Maru were engaged in rock sampling and seafloor image acquisition, respectively. Dr. Atsushi Suzuki at the Geological Survey of Japan, and Dr. Yasufumi Iryu are deeply acknowledged for their sincere support in geological discussion on the seamount evolution.
Disclosure statement
No potential conflict of interest was reported by the author(s).
Additional information
Funding
References
- Bogdanov, Y. A., O. Y. Bogdanova, A. V. Dubinin, A. Goland, A. I. Gorshkov, E. G. Gurvich, A. B. Isaeva, G. V. Ivanov, L. F. Jansa, and A. Monaco. 1995. Composition of Ferromanganese Crusts and Nodules at Northwestern Pacific Guyots and Geologic and Paleoceanographic Considerations. Proceedings of the Ocean Drilling Program: Scientific Results 144: 745–768.
- Chiba, T., S. I. Kaneta, and Y. Suzuki. 2008. Red Relief Image Map: New Visualization Method for Three Dimensional Data. International Archives of the Photogrammetry, Remote Sensing and Spatial Information Sciences 37: 1071–1076.
- Du, D., S. Yan, G. Yang, F. Shi, Z. Zhu, Q. Song, F. Yang, et al. 2020. Depositional Patterns Constrained by Slope Topography Changes on Seamounts. Scientific Reports 10 (1): 20534. https://doi.org/10.1038/s41598-020-77573-2
- Flood, P. 1999. Development of Northwest Pacific Guyots: General Results from Ocean Drilling Program Legs 143 and 144. Island Arc 8 (1): 92–98. https://doi.org/10.1046/j.1440-1738.1999.00222.x
- Glasby, G. P., X. Ren, X. Shi, and A. I. Pulyaeva. 2007. Co–Rich Mn Crusts from the Magellan Seam
- ount Cluster: The Long Journey through Time. Geo-Marine Letters 27 (5): 315–323.
- https://doi.org/10.1007/s00367-007-0055-5
- Goto, K. T., A. D. Anbar, G. W. Gordon, S. J. Romaniello, G. Shimoda, Y. Takaya, A. Tokumaru, et al. 2014. Uranium Isotope Systematics of Ferromanganese Crusts in the Pacific Ocean: Implications for the Marine 238U/235U Isotope System. Geochimica et Cosmochimica Acta 146: 43–58. https://doi.org/10.1016/j.gca.2014.10.003
- Halbach, P., C.-D. Sattler, F. Teichmann, and M. Wahsner. 1989. Cobalt-Rich and Platinum-Bearing Manganese Crust Deposits on Seamounts: Nature, Formation and Metal Potential. Marine Mining 8: 23–39.
- Hein, J. R., W. A. Bohrson, M. S. Schulz, M. Noble, and D. A. Clague. 1992. Variations in the Fine‐Scale Composition of a Central Pacific Ferromanganese Crust: Paleoceanographic Implications. Paleoceanography 7 (1): 63–77. https://doi.org/10.1029/91PA02936
- Hein, J. R., A. Koschinsky, M. Bau, F. T. Manheim, J. K. Kang, and L. Roberts. 2000. Cobalt-Rich Ferromanganese Crusts in the Pacific. In Handbook of Marine Mineral Deposits, ed. D. S. Cronan, vol. 18, 239–273. Boca Raton: CRC Press.
- Hein, J. R., K. Mizell, A. Koschinsky, and T. A. Conrad. 2013. Deep-Ocean Mineral Deposits as a Source of Critical Metals for High- and Green-Technology Applications: Comparison with Land-Based Resources. Ore Geology Reviews 51: 1–14. https://doi.org/10.1016/j.oregeorev.2012.12.001
- Hein, J. R., F. Spinardi, N. Okamoto, K. Mizell, D. Thorburn, and A. Tawake. 2015. Critical Metals in Manganese Nodules from the Cook Islands EEZ, Abundances and Distributions. Ore Geology Reviews 68: 97–116. https://doi.org/10.1016/j.oregeorev.2014.12.011
- Hein, J. R., H. W. Yeh, S. H. Gunn, W. V. Sliter, L. M. Benninger, and C. H. Wang. 1993. Two Major Cenozoic Episodes of Phosphogenesis Recorded in Equatorial Pacific Seamount Deposits. Paleoceanography 8 (2): 293–311. https://doi.org/10.1029/93PA00320
- Hino, H., and A. Usui. 2022. Regional and Fine-Scale Variability in Composition and Structure of Hydrogenetic Ferromanganese Crusts: Geological Characterization of 25 Drill Cores from the Marcus-Wake Seamounts. Marine Georesources & Geotechnology 40 (4): 415–437. https://doi.org/10.1080/1064119X.2021.1904066
- Hino, H., and A. Usui. 2023. Microstratigraphic Evidence of Oceanographic and Tectonic Controls on Hydrogenetic Ferromanganese Crusts in the NW Pacific Seamounts. Marine Geology 457: 106990. https://doi.org/10.1016/j.margeo.2023.106990
- Hirano, N., H. Sumino, T. Morishita, S. Machida, T. Kawano, K. Yasukawa, T. Hirata, et al. 2021. A Paleogene Magmatic Overprint on Cretaceous Seamounts of the Western Pacific. Island Arc 30 (1): e12386. https://doi.org/10.1111/iar.12386
- Hyeong, K., J. Kim, C. M. Yoo, J. W. Moon, and I. Seo. 2013. Cenozoic History of Phosphogenesis Recorded in the Ferromanganese Crusts of Central and Western Pacific Seamounts: Implications for Deepwater Circulation and Phosphorus Budgets. Palaeogeography, Palaeoclimatology, Palaeoecology 392: 293–301. https://doi.org/10.1016/j.palaeo.2013.09.012
- International Seabed Authority. 2012. Regulations on Prospecting and Exploration for Cobalt-Rich Ferromanganese Crusts in the Area. ISA Eighteenth Session Article. ISBA/18/A/11.
- Janney, P. E., and P. R. Castillo. 1999. Isotope Geochemistry of the Darwin Rise Seamounts and the Nature of Long-Term Mantle Dynamics beneath the South Central Pacific. Journal of Geophysical Research: Solid Earth 104 (B5): 10571–10589. https://doi.org/10.1029/1998JB900061
- Jansa, L. F., and A. A. Vanneau. 1995. Carbonate Buildup and Sea-Level Changes at MIT Guyot, Western Pacific. Proceedings of the Ocean Drilling Program: Scientific Results 144: 311–336.
- Joo, J., S. S. Kim, J. W. Choi, S. J. Pak, Y. Ko, S. K. Son, J. Moon, and J. Kim. 2020. Seabed Mapping Using Shipboard Multibeam Acoustic Data for Assessing the Spatial Distribution of Ferromanganese Crusts on Seamounts in the Western Pacific. Minerals 10 (2): 155. https://doi.org/10.3390/min10020155
- Josso, P., J. Rushton, P. Lusty, A. Matthews, S. Chenery, D. Holwell, S. J. Kemp, and B. Murton. 2020. Late Cretaceous and Cenozoic Paleoceanography from North-East Atlantic Ferromanganese Crust Microstratigraphy. Marine Geology 422: 106122. https://doi.org/10.1016/j.margeo.2020.106122
- Josso, P., P. Lusty, S. Chenery, and B. Murton. 2021. Controls on Metal Enrichment in Ferromanganese Crusts: Temporal Changes in Oceanic Metal Flux or Phosphatisation? Geochimica et Cosmochimica Acta 308: 60–74. https://doi.org/10.1016/j.gca.2021.06.002
- Kim, J., K. Hyeong, H. S. Jung, J. W. Moon, K. H. Kim, and I. Lee. 2006. Southward Shift of the Intertropical Convergence Zone in the Western Pacific during the Late Tertiary: Evidence from Ferromanganese Crusts on Seamounts West of the Marshall Islands. Paleoceanography 21 (4): 4281. https://doi.org/10.1029/2006PA001291
- Kisimoto, K., A. Usui, K. Yamaoka, M. Yuasa, A. Suzuki, and A. Nishimura. 2017. Marine Polymetallic Mineral Deposits in the Vicinity of the Japanese Islands, Northwest Pacific. 2nd ed. Japan: Geological Survey of Japan.
- Koppers, A. A. P., H. Staudigel, M. S. Pringle, and J. R. Wijbrans. 2003. Short‐Lived and Discontinuous Intraplate Volcanism in the South Pacific: Hot Spots or Extensional Volcanism? Geochemistry, Geophysics, Geosystems 4 (10): 1089. https://doi.org/10.1029/2003GC000533
- Koschinsky, A., A. Stascheit, M. Bau, and P. Halbach. 1997. Effects of Phosphatization on the Geochemical and Mineralogical Composition of Marine Ferromanganese Crusts. Geochimica et Cosmochimica Acta 61 (19): 4079–4094. https://doi.org/10.1016/S0016-7037(97)00231-7
- Li, Z., H. Li, J. R. Hein, Y. Dong, M. Wang, X. Ren, Z. Wu, et al. 2021. A Possible Link between Seamount Sector Collapse and Manganese Nodule Occurrence in the Abyssal Plains, NW Pacific Ocean. Ore Geology Reviews 138: 104378. https://doi.org/10.1016/j.oregeorev.2021.104378
- Melnikov, M. E., and S. P. Pletnev. 2013. Age and Formation Conditions of the Co-Rich Manganese Crust on Guyots of the Magellan Seamounts. Lithology and Mineral Resources 48 (1): 1–13. https://doi.org/10.1134/S0024490212050057
- Moore, J. G., and D. A. Clague. 2004. Hawaiian Submarine Manganese-Iron Oxide Crusts—a Dating Tool? Geological Society of America Bulletin 116 (3): 337–347. https://doi.org/10.1130/B25304.1
- Moore, J. G., B. L. Ingram, K. R. Ludwig, and D. A. Clague. 1996. Coral Ages and Island Subsidence, Hilo Drill Hole. Journal of Geophysical Research: Solid Earth 101 (B5): 11599–11605. https://doi.org/10.1029/95JB03215
- Murdmaa, I., J. Nemlifer, O. Bogdanova, A. Gorshkov, T. Kallaste, and V. Vasilyeva. 1995. Ferromanganese and Phosphate Hardgrounds on the Western Pacific Guyots Drilled during Legs 143 and 144. Proceedings of the Ocean Drilling Program: Scientific Results 144: 419–428.
- Nagao, M., Y. Takasugi, A. Suzuki, Y. Tanaka, H. Sugishima, T. Matsui, and N. Okamoto. 2018. Confirming the Validity of ADCP Velocity Measurements for Physical Environmental Assessment in Japan’s Exploration Areas for Cobalt-Rich Ferromanganese Crusts. The 28th International Ocean and Polar Engineering Conference ISOPE-I-18-318.
- Nakanishi, M., and J. S. Gee. 1995. Paleomagnetic Investigations of Volcanic Rocks of LEG 144 Volcanic Rocks: Paleolatitudes of the Northwestern Pacific Guyots. Proceedings of the Ocean Drilling Program: Scientific Results 144: 585–604.
- Neettiyath, U., B. Thornton, H. Sugimatsu, T. Sunaga, J. Sakamoto, and H. Hino. 2022. Automatic Detection of Buried Mn-Crust Layers Using a Sub-Bottom Acoustic Probe from AUV Based Surveys. In OCEANS 2022-Chennai, 1–7. IEEE.https://doi.org/10.1109/OCEANSChennai45887.2022.9775260
- Nishi, K., A. Usui, Y. Nakasato, and H. Yasuda. 2017. Formation Age of the Dual Structure and Environmental Change Recorded in Hydrogenetic Ferromanganese Crusts from Northwest and Central Pacific Seamounts. Ore Geology Reviews 87: 62–70. https://doi.org/10.1016/j.oregeorev.2016.09.004
- Novikov, G. V., M. E. Mel’nikov, O. Y. Bogdanova, and I. V. Vikent’ev. 2014. Nature of co-Bearing Ferromanganese Crusts of the Magellan Seamounts (Pacific Ocean): Communication 1. Geology, Mineralogy, and Geochemistry. Lithology and Mineral Resources 49 (1): 1–22. https://doi.org/10.1134/S0024490213060072
- Nozaki, T., A. Tokumaru, Y. Takaya, Y. Kato, K. Suzuki, and T. Urabe. 2016. Major and Trace Element Compositions and Resource Potential of Ferromanganese Crust at Takuyo Daigo Seamount, Northwestern Pacific Ocean. Geochemical Journal 50 (6): 527–537. https://doi.org/10.2343/geochemj.2.0430
- Okamoto, N., and A. Usui. 2014. Regional Distribution of Co-Rich Ferromanganese Crusts and Evolution of the Seamounts in the Northwestern Pacific. Marine Georesources & Geotechnology 32 (3): 187–206. https://doi.org/10.1080/1064119X.2013.877110
- Ota, Y., M. Suzumura, A. Tsukasaki, A. Suzuki, K. Seike, and J. Minatoya. 2022. Sediment Accumulation Rates and Particle Mixing at Northwestern Pacific Seamounts. Journal of Marine Systems 229: 103719. https://doi.org/10.1016/j.jmarsys.2022.103719
- Ren, X., G. P. Glasby, J. Liu, X. Shi, and J. Yin. 2007. Fine-Scale Compositional Variations in a Co-Rich Mn Crust from the Marcus-Wake Seamount Cluster in the Western Pacific Based on Electron Microprobe Analysis (EMPA). Marine Geophysical Researches 28 (2): 165–182. https://doi.org/10.1007/s11001-007-9024-7
- Smith, W. H. F., H. Staudigel, A. B. Watts, and M. S. Pringle. 1989. The Magellan Seamounts: Early Cretaceous Record of the South Pacific Isotopic and Thermal Anomaly. Journal of Geophysical Research: Solid Earth 94 (B8): 10501–10523. https://doi.org/10.1029/JB094iB08p10501
- Thornton, B., A. Asada, A. Bodenmann, M. Sangekar, and T. Ura. 2013. Instruments and Methods for Acoustic and Visual Survey of Manganese Crusts. IEEE Journal of Oceanic Engineering 38 (1): 186–203. https://doi.org/10.1109/JOE.2012.2218892
- Tokumaru, A., T. Nozaki, K. Suzuki, K. T. Goto, Q. Chang, J. I. Kimura, Y. Takaya, Y. Kato, A. Usui, and T. Urabe. 2015. Re–Os Isotope Geochemistry in the Surface Layers of Ferromanganese Crusts from the Takuyo Daigo Seamount, Northwestern Pacific Ocean. Geochemical Journal 49 (3): 233–241. https://doi.org/10.2343/geochemj.2.0352
- Usui, A., I. J. Graham, R. G. Ditchburn, A. Zondervan, H. Shibasaki, and H. Hishida. 2007. Growth History and Formation Environments of Ferromanganese Deposits on the Philippine Sea Plate, Northwest Pacific Ocean. Island Arc 16 (3): 420–430. https://doi.org/10.1111/j.1440-1738.2007.00592.x
- Usui, A., O. Ishizuka, and M. Yuasa. 1999. Mode of Occurrence of Iron-Manganese Crusts on Inactive Seamounts in the Northwestern Pacific Back-Arc Setting. Third ISOPE Ocean Mining Symposium, ISOPE-M-99-014.
- Usui, A., and T. Ito. 1994. Fossil Manganese Deposits Buried within DSDP/ODP Cores, Legs 1–126. Marine Geology 119 (1–2): 111–136. https://doi.org/10.1016/0025-3227(94)90144-9
- Usui, A., K. Nishi, H. Sato, Y. Nakasato, B. Thornton, T. Kashiwabara, A. Tokumaru, et al. 2017. Continuous Growth of Hydrogenetic Ferromanganese Crusts since 17 Myr Ago on Takuyo-Daigo Seamount, NW Pacific, at Water Depths of 800–5500 m. Ore Geology Reviews 87: 71–87. https://doi.org/10.1016/j.oregeorev.2016.09.032
- Usui, A., and N. Okamoto. 2010. Geophysical and Geological Exploration of Cobalt-Rich Ferromanganese Crusts: An Attempt of Small-Scale Mapping on a Micronesian Seamount. Marine Georesources & Geotechnology 28 (3): 192–206. https://doi.org/10.1080/10641190903521717
- Usui, A., and M. Someya. 1997. Distribution and Composition of Marine Hydrogenetic and Hydrothermal Manganese Deposits in the Northwest Pacific. Geological Society, London, Special Publications 119 (1): 177–198. https://doi.org/10.1144/GSL.SP.1997.119.01.12
- Usui, A., and K. Suzuki. 2022. Geological Characterization of Ferromanganese Crust Deposits in the NW Pacific Seamounts for Prudent Deep-Sea Mining. Perspectives on Deep-Sea Mining: Sustainability, Technology, Environmental Policy and Management 81–113.
- Vanneau, A., D. D. Bergersen, G. F. Camoin, P. Ebren, and J. A. Haggerty. 1995. A Model for Depositional Sequences and Systems Tracts on Small, Mid-Ocean Carbonate Platforms: Examples from Wodejebato (Sites 873–877) and Limalok (Site 871) Guyots. Proceedings of the Ocean Drilling Program: Scientific Results 144.
- Wei, X., X. F. Shi, Y. G. Xu, P. R. Castillo, Y. Zhang, L. Zhang, and H. Zhang. 2022. Mid-Cretaceous Wake Seamounts in NW Pacific Originate from Secondary Mantle Plumes with Arago Hotspot Composition. Chemical Geology 587: 120632. https://doi.org/10.1016/j.chemgeo.2021.120632
- Winterer, E. L., J. H. Natland, R. J. Van Waasbergen, R. A. Duncan, M. K. Mcnutt, C. J. Wolfe, I. P. Silva, W. W. Sager, and W. V. Sliter. 1993. Cretaceous Guyots in the Northwest Pacific: An Overview of Their Geology and Geophysics. The Mesozoic Pacific: Geology, Tectonics, and Volcanism 77: 307–334.
- Yamaoka, K., O. Ishizuka, H. Morozumi, and H. Hino. 2022. Chemical Compositions and Ages of Basalts from Seamounts in the Northwest Pacific. Bulletin of the Geological Survey of Japan 73 (3): 103–135. https://doi.org/10.9795/bullgsj.73.3_103
- Yamazaki, T., and R. Sharma. 1998. Distribution Characteristics of co‐Rich Manganese Deposits on a Seamount in the Central Pacific Ocean. Marine Georesources & Geotechnology 16 (4): 283–305. https://doi.org/10.1080/10641199809379973
- Yan, Q., L. Milan, J. E. Saunders, and X. Shi. 2021. Petrogenesis of Basaltic Lavas from the West Pacific Seamount Province: Geochemical and Sr-Nd-Pb-Hf Isotopic Constraints. Journal of Geophysical Research: Solid Earth 126 (5): e2020. https://doi.org/10.1029/2020JB021598
- Yang, K., H. Yao, W. Ma, Y. Liu, and G. He. 2022. A Step-by-Step Relinquishment Method for Cobalt-Rich Crusts: A Case Study on Caiqi Guyot, Pacific Ocean. Marine Georesources & Geotechnology 40 (9): 1139–1150. https://doi.org/10.1080/1064119X.2021.1973161
- Yang, Y., G. He, J. Ma, Z. Yu, H. Yao, X. Deng, F. Liu, Z. Wei, and Z. Wei. 2020. Acoustic Quantitative Analysis of Ferromanganese Nodules and Cobalt-Rich Crusts Distribution Areas Using EM122 Multibeam Backscatter Data from Deep-Sea Basin to Seamount in Western Pacific Ocean. Deep Sea Research Part I 161: 103281. https://doi.org/10.1016/j.dsr.2020.103281
- Zhao, B., Z. Wei, Y. Yang, G. He, H. Zhang, and W. Ma. 2020a. Sedimentary Characteristics and the Implications of Cobalt-Rich Crusts Resources at Caiwei Guyot in the Western Pacific Ocean. Marine Georesources & Geotechnology 38 (9): 1037–1045. https://doi.org/10.1080/1064119X.2019.1648615
- Zhao, B., Y. Yang, X. Zhang, G. He, W. Lü, Y. Liu, Z. Wei, et al. 2020b. Sedimentary Characteristics Based on Sub-Bottom Profiling and the Implications for Mineralization of Cobalt-Rich Ferromanganese Crusts at Weijia Guyot, Western Pacific Ocean. Deep Sea Research Part I 158: 103223. https://doi.org/10.1016/j.dsr.2020.103223