ABSTRACT
This article reports a visitor observation study that was conducted at the aquarium of Rotterdam Zoo, called the Oceanium. Observations were performed in six different aquarium exhibits within the Oceanium and visitors' stopping and watching behaviors were recorded. Results showed that in five out of six exhibits, visitors were more likely to stop and watch during the morning than in the afternoon. This study provided evidence regarding visitors' use of different exhibits, which will be valuable in improving both the recreational and educational value of the experiences offered at the Oceanium.
The role of modern zoos and aquariums in society has changed over the years. For decades zoos focused on showing a wide variety of exotic animals solely for the recreational pleasure of the public and were designed accordingly. In the 1960's this changed into a focus for wildlife conservation. In 1993, The World Association of Zoos and Aquariums (WAZA), then known as the International Union of the Directors of Zoological Gardens (IUDZG), published the Zoo and Aquarium Strategy, encouraging zoos and aquariums to focus on conservation. This can be seen as a milestone in changing zoological gardens and aquariums into institutions dedicated to conservation. Only these institutions as well as botanic gardens can operate across the whole spectrum of conservation activities. They can involve ex situ breeding of threatened species, research, public education, and training as well as in situ support of species, populations, and their habitats in the wild (CitationPhilips & Dollinger, 2005).
Parallel to this development in zoos, aquariums, and botanic gardens, the perspective of visitors has also changed during the last decade, from just watching animals into a more educational fieldtrip. For example, CitationAdelman, Falk, and James (2000) and CitationPacker and Ballantyne (2002) concluded that education, or learning and discovery, were among the main reasons people had for visiting an aquarium.
Several studies have demonstrated the positive role played by zoos and aquariums in relation to conservation knowledge. CitationAdelman, Falk, and James (2000) study conducted in the National Aquarium in Baltimore concluded that a visit positively affected visitors' knowledge in both the short and long term and visitor attitudes in the short term. In 2007 the results from a large study at 12 AZA (Association of Zoos and Aquariums) accredited zoos and aquariums in North America were published (CitationFalk et al., 2007). This study showed a measurable impact on the conservation attitudes and understanding of adult visitors. It also found that nearly a year after the zoo or aquarium visit, over half of the visitors were able to talk about what they learned from their visit. CitationYalowitz (2004) found evidence that after leaving the Monterey Bay Aquarium, visitors retain specific conservation information and maintain levels of concern about these topics for weeks and even months. Yalowitz's findings suggest that visitors are interested in and receptive to conservation content and willing to receive new conservation information through exhibits. Ballantyne, Packer, and Hughes (in press) presented data from a range of wildlife tourism sites (including an aquarium) in Australia, confirming visitors' willingness to accept conservation messages in these contexts.
These visitor research studies reflect an increasing interest in understanding the behavior of visitors in informal learning institutions (CitationRoss & Lukas, 2005). Both qualitative and quantitative approaches have been used in this regard. An example of a qualitative method is a study at the Vancouver Aquarium Marine Science Centre in Canada (CitationBriseño-Garzón, Anderson, & Anderson, 2007). This study reports on the nature and character of adult learning within a family group context while visiting the aquarium and the longitudinal effects of such experience in the weeks following the visit. This was done using face-to-face semi-structured open-ended interviews before and immediately after the visit to the aquarium, as well as follow-up telephone interviews two to three weeks after the visit. The study demonstrated that adults visiting informal learning environments as part of a family group were learning from the experience and that such learning persisted over time. Another example is a study in Disney's Animal Kingdom in the United States (CitationDierking et al., 2004). This study used pre-exhibit, exit, and paired pre- and post-visit interviews as well as telephone interviews two to three months after the visit to study visitors' conservation-related behavior after a visit to Disney's Animal Kingdom. The analysis revealed changes in guests' interest in, and involvement with, conservation-related activities over time.
Another method that is often used to study visitor behavior is visitor observation and tracking (see review by CitationYalowitz & Bronnenkant, 2009, in this issue). An example is the study by CitationEsson and Moss (2008) at Chester Zoo in the UK. Visitors were tracked unobtrusively and their dwell time in the exhibit was recorded along with other variables, such as number of stops at exhibit elements, visitor density, group composition, and the weather. Conclusions were that visitor interest did not wane during the day and that visitor dwell time increased when the animal in the exhibit was visible. Another example is CitationRoss and Lukas's (2005) study at Lincoln Park Zoo in Chicago, USA. Here, visitors of the Lester E. Fisher Great Ape House were observed in order to describe the effects of demographic variables on the time spent in the building, the distribution of visitor time spent in the building, and to make comparisons between different interpretive styles. This study concluded that solitary adults had shorter mean visit durations than adults in groups, the mean visit duration was less than nine minutes, and educational items that require interaction were the most effective medium for holding the attention of visitors. CitationRoss and Lukas (2005)concluded that an objective evaluation of the time that visitors spend at zoo exhibits can provide valuable information regarding the quality of their experience and the possible learning taking place.
CitationSerrell (1997) and CitationDoering and Pekarik (1997) suggested that carefully watching and recording how visitors spend time and pay attention can provide exhibit teams with useful information about ways to improve educational exhibitions. The study reported here aimed to explore the use of quantitative visitor observations as a means to evaluate and improve exhibits at the Rotterdam Zoo Aquarium. The data collected during this study will also serve as a baseline that will be of use during future studies when changes in the aquariums or their physical surroundings will be evaluated.
METHOD
Research Settings
This study was conducted at the aquarium of the Royal Rotterdam Zoological and Botanical Gardens (called the Oceanium). This 150-year-old zoo is, with its 1.5 million visitors a year, one of the largest attractions in The Netherlands. The Oceanium is a building that consists of 31 large aquarium exhibits and 24 smaller aquarium exhibits containing about 7 million liters of water in total. There are also several mammal, bird, and reptile exhibits. The visitors' journey leads through different biotopes and starts at Bass Rock, followed by the North Sea, Atlantic Ocean, Caribbean, Falklands, Galapagos Islands, and ends at the Californian Coast.
This research was performed in the Caribbean area, which is situated in the middle of the Oceanium and consists of six different aquarium exhibits. During the research period no changes in the exhibits or their surroundings were made, ensuring it remained a stable research area. This stability is necessary to gain reliable results concerning the visitors' behavior. Each of the six aquarium exhibits observed is unique in general appearance, size, and the organisms it contains.
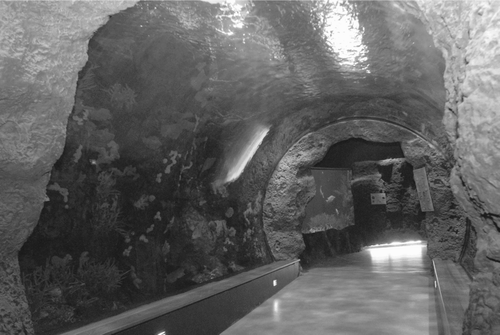
The Coral Tunnel () is the first exhibit in the Caribbean area and consists of an artificial coral reef which contains small fishes such as Porkfish (Anisotremus virginicus) and Bluestriped Grunts (Haemulon sciurus). Benches are provided in the tunnel allowing visitors to sit down and watch the exhibit in a relaxed position. An educational species sign at the end of the tunnel displays pictures, as well as the Dutch, English, German and Latin names of some of the fishes that can be seen. Additional information about the habitat is also presented.
Figure 1 Coral Tunnel.
The second exhibit is the Grouper Aquarium (). It also contains artificial coral but to a lesser extent than is present in the Coral Tunnel. Here a few larger fishes can be seen such as Hogfish (Lachnolaimus maximus) and Black Groupers (Mycteroperca bonaci). This exhibit also presents educational information in the form of a species sign.
Figure 2 Grouper Aquarium (left) and Deep Reef Aquarium (right).
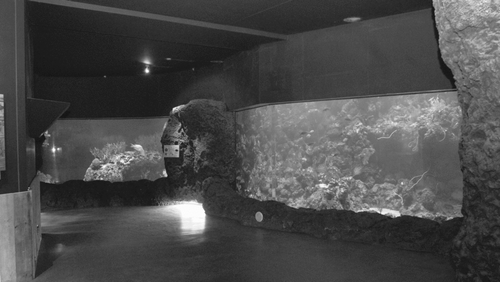
The Deep Reef Aquarium (see ) is third in line and shows the habitat of a Caribbean coral reef at a depth of 30 meters and below. Live corals like Orange Cup Corals (Tubastraea coccinea) and Feather Star (Sabellastarte magnifica) and several small fishes such as Deepwater Butterflyfish (Prognathodes aya) and Sargassum Triggerfish (Xanthichthys ringens) can be seen. This Deep Reef exhibit is the first to present additional educational information by means of a digital screen. This screen shows a PowerPoint presentation with information about the Caribbean ecosystem and the species living in the aquarium. The entire information takes 110 seconds to watch and is presented continuously.
The fourth exhibit () contains Lined Seahorses (Hippocampus erectus) and a large amount of artificial coral. During the observation period, a feeding platform was present in the middle of the aquarium. Most of the seahorses spent a lot of time at the platform, which resulted in good animal visibility. Also, a species sign with information on Lined Seahorses and their breeding program is present. Under heavy crowd circumstances it was not possible to observe the visitors' behavior toward this sign because this exhibit is situated in a corner.
Figure 3 Seahorse Aquarium (left) and Green Moray Aquarium (right).
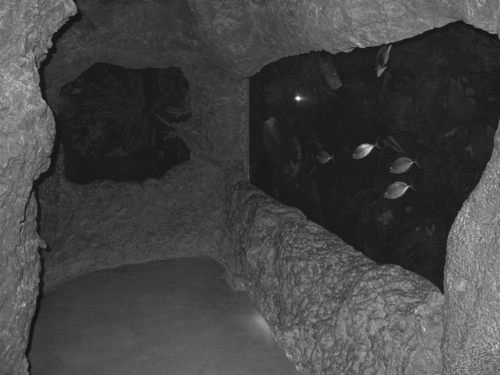
Following the Seahorses the visitor encounters the Green Moray (Gymnothorax funebris) exhibit (). The largest part of this exhibit consists of artificial caves and coral that allow the morays to settle or hide. Obtaining reliable data on visitors' behavior toward the species sign was not possible under heavy crowd circumstances due to this exhibit's location.
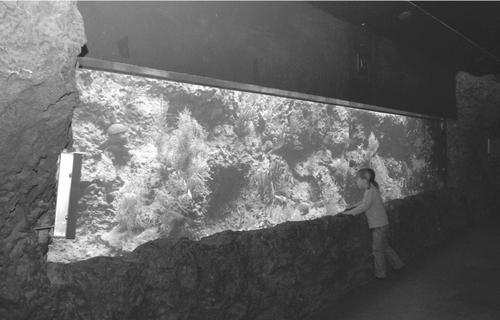
The last exhibit in the Caribbean area is the Live Coral Tank (), which contains live corals of different species, such as Gorgonians (Gorgonia spp.) and Star Coral (Montastraea annularis) as well as several smaller fish species, such as Blue Chromis (Chromis cyanea) and Doctorfish (Acanthurus spp.). Because live corals need light to survive, this exhibit is well illuminated, the bright lighting being noticeably different from the other aquarium exhibits in the Caribbean area. This live coral exhibit presents additional educational information through the use of a digital screen. This screen shows a PowerPoint presentation with information about the Caribbean ecosystem and the species living in the aquarium. The entire information takes 120 seconds to watch and is presented continuously.
Figure 4 Live Coral Tank.
Procedure
The six aquarium exhibits described above were observed in the summer holiday period in 2007, from June 26th until September 10th. This is the peak period for visitation, with approximately 25% of the total visits per year taking place during July and August. Throughout the research period, the average number of zoo visitors per day was 4,770 (compared to an average of 3,061 in the other months of the year). Each aquarium was observed on one Monday, one Tuesday, one Wednesday, one Thursday, and one Friday, once each day in the morning (between 10 and 11 am) and once in the afternoon (between 3 and 4 pm). The morning and afternoon observations in each aquarium were conducted on different days in order to avoid day-specific influences such as the weather. This yielded 10 observation hours per exhibit during the course of approximately 10 weeks. Observations were not performed during the weekend as the extremely large crowds made it difficult to obtain reliable data. One person performed all observations and to avoid the observer's influence as much as possible, data were gathered from the most unobtrusive dark place that still allowed observations.
The number of visitors passing through the target exhibit during each of the 10 one-hour observation periods was counted and the average was calculated in order to determine whether or not an observation period was busy or calm. For each aquarium, an observation period was considered “calm” if the visitor numbers were more than 10% below average, and “busy” if more than 10% above average. For example, the average number of visitors during the observation periods at the Coral Tunnel was 398. All observation periods where visitor numbers were below 358 were defined as calm and observation periods where the number of passing visitors was above 438 were defined as busy.
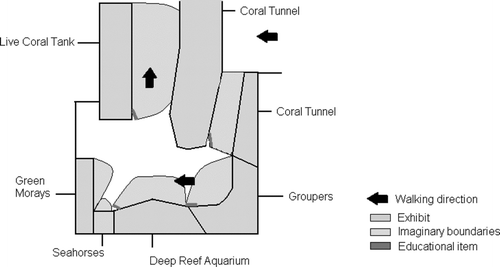
During this study, a total of 21,854 people were counted and it was recorded whether or not they stopped to watch the exhibit. A watching visitor was defined as a child, teenager or adult who stands still in front of the exhibit, within the observer's self defined imaginary lines on the floor, and watches it for at least 2 seconds. From these data the attracting power of each exhibit—the percentage of the total number of visitors who stopped to watch the exhibit—was calculated. A map of the observed aquariums and their imaginary lines is provided in .
Figure 5 The Caribbean area and its aquarium exhibits.
During the observation period at each of the six exhibits, the behavior of each 10th passing visitor (a total of 1,857 visitors) was recorded in more detail using a stopwatch. Selecting each 10th visitor ensured that data were collected randomly. The following data were recorded manually for this sample of visitors:
-
Visitor's age category (child, teenager or adult, estimated by observation);
-
Visitor's gender;
-
Exhibit dwelling time—the time the visitor spent watching the exhibit, including the additional educational items, minus down-time (the stopwatch was stopped whenever the visitor was present within the imaginary lines but was not attending to the exhibit or one of the educational items, i.e., down-time was not recorded during this study); and
-
Digital screen viewing time—the time the visitor spent attending to the digital screen (recorded in the two exhibits where these were present: the Deep Reef Aquarium and Live Coral Tank).
Sample
A total of 21,854 visitors were observed during the 60 hours of observation (10 hours at each of 6 exhibits), and it was recorded whether or not they stopped to watch the exhibit. Of this group, 1,857 persons (8.5%) were observed in more detail, and their age, gender, and time spent watching the exhibit were recorded. Also, the day and time that the visit took place were recorded. The estimated ages and genders of the sample are reported in .
Table 1 Age category and gender of observed visitors for each aquarium exhibit
RESULTS
presents the average attracting power of each exhibit during busy and calm observation periods. shows the average exhibit dwelling time at each exhibit.
Table 2 Average attracting power (AP), and average attracting power during busy (APB) and calm (APC) observation periods followed by their respective number of observation periods (OP) in hoursFootnote a
Table 3 Average dwelling time at each exhibit
Using the sample of visitors who were observed in greater detail, chi-square tests were performed to investigate possible relationships between age, gender, time of day, crowdedness, proportion of visitors who stopped to watch the exhibit, exhibit dwelling time (divided at the mean into long vs. short time), proportion of visitors who stopped to attend to an educational item, and viewing time for the digital screens (divided at the mean into long vs. short time). Significant results are discussed below and summarized in .
Table 4 Summary of relationships between variables, n.s. means no significant relationships found
Coral Tunnel
A significant relationship, χ2(1, N = 305) = 3.871, p = 0.049, was found between time of day (morning vs. afternoon) and the proportion of visitors who stopped to watch the exhibit. In the morning, a larger proportion of visitors stopped to watch than in the afternoon. Adults were more likely to stop to watch than children and teenagers, although this trend did not reach statistical significance, χ2(2, N = 305) = 5.480, p = 0.065. Visitors in the afternoon were more likely to attend to the species sign than visitors in the morning, although again this did not reach statistical significance, χ2(1, N = 152) = 0.156, p = 0.068.
Groupers
For this exhibit a significant relationship was found between time of day and short versus long exhibit dwelling time, χ2(1, N = 103) = 5.487, p = 0.019. In the morning visitors watched the exhibit longer than in the afternoon. A significant relationship was found between visitors' age and the proportion of visitors who stopped to watch, χ2(2, N = 334) = 7.459, p = 0.024. Adults were more likely to stop and watch than children and teenagers. Adults and teenagers tended to use the sign more often than children although this did not reach statistical significance, χ2(2, N = 106) = 5.194, p = 0.071. A significant relationship was seen between time of day and the proportion of visitors who attended to the species sign, χ2(1, N = 105) = 4.599, p = 0.032, the species sign being used more often in the afternoon than the morning. Also, visitors were more likely to stop and watch the exhibit during a calm observation period than during a busy one, χ2(1, N = 264) = 4.040, p = 0.044.
Deep Reef Aquarium
Visitors tended to stop to watch the exhibit more often during the morning than in the afternoon, but this was not statistically significant, χ2(1, N = 380) = 2.784, p = 0.095. Adults and teenagers tended to stop and watch more often than children, χ2(2, N = 380) = 5.694, p = 0.058. Visitors who used the digital screen were more likely to spend a long rather than short time watching the exhibit, χ2(1, N = 169) = 5.499, p = 0.019. The average viewing time of the digital screen was 7.5 seconds, which is 6.8% of the total duration of the movie.
Seahorses
Visitors were more likely to stop and watch the exhibit during a calm observation period than during a busy one, χ2(1, N = 233) = 4.598, p = 0.032.
Green Morays
Visitors stopped to watch the exhibit more often in the morning than the afternoon, χ2(1, N = 266) = 8.606, p = 0.003.
Live Coral Tank
Visitors stopped to watch the exhibit more often in the morning than the afternoon, χ2(1, N = 267) = 4.996, p = 0.025. The average viewing time of the digital screen was 4.2 seconds, which is 3.5% of the total duration of the movie.
DISCUSSION
This study collected data regarding exhibit attracting power and exhibit dwelling time at each exhibit. Do these results provide enough insight into visitor behavior to be used in the evaluation of the different aquarium exhibits?
The results from this study demonstrate clear differences between the observed exhibits. Explanations can be found in additional structures, animal attractiveness and layout of the area. For instance, the high exhibit dwelling time that was found in the Coral Tunnel may be explained by the presence of benches that invite visitors to sit down and spend more time in this particular exhibit. The Green Morays often invoke expressions of dread and wonder and seem to fascinate people with their appearance, probably causing the high exhibit dwelling times. The Seahorse aquarium is located in a small corner, leaving little room for people to watch and has to compete with the Green Morays, leading to relatively low attracting power. Also, during busy periods the large crowds block the view of this exhibit, adding to low visibility as can be seen in the difference of attracting powers during calm periods as compared to busy periods (see : 19% vs. 32%).
Another interesting result was the finding that visitors were more likely to watch an exhibit during the morning than the afternoon. In order to interpret this, the effect of museum fatigue—the phenomenon of visitors' interest decreasing as a (museum) visit progresses—must be taken into consideration. Exhibit location within the zoo is a determining factor in the order of visit and therefore influences where, during the visit, museum fatigue will start to have an effect. For instance, CitationMitchell et al. (1990) studied the effect of different locations of exhibits in Sacramento Zoo and concluded that the location of the animals in the zoo did make a difference. A cage nearby the exit or entrance received significantly more visitors than did a cage away from the exit but on the main path, while the latter cage had more patronage than a cage that was only a few feet off the main walkway. The Oceanium is located near the main entrance and exit, and we can distinguish four kinds of visitors that come to the Oceanium:
-
Morning visitors who start at the Oceanium—we would expect high attracting powers as well as high exhibit dwelling times.
-
Afternoon visitors who start at the Oceanium—we would expect high attracting powers but low exhibit dwelling times due to the fact that they have less time in general.
-
Afternoon visitors who start in the morning by visiting the zoo and end at the Oceanium—we would expect low attracting powers and low exhibit dwelling times due to the fact that they have less time in general and are tired from having been in the zoo the entire day.
-
Afternoon visitors who come to see specific exhibits and take a quick peek in the Oceanium on their way out—we would expect low attracting powers and low exhibit dwelling times due to a lack of time and specific interest.
Finally, the effect of the presence of children should be taken into consideration since it is well known that, in general, their attention span is shorter than adults. They also tend to dominate parents' choices. A study by CitationKorn (2001) demonstrated that one-quarter of parents glanced at the labels, but did not use them, citing their child's age or short attention span as barriers. CitationTisdal and Perry (2004) warned that the attention of visitor groups that include younger children tends to focus on the interest, attention span, and behavior of these children. Further research should include group composition and should investigate the dynamics of attracting power and time spent at exhibits throughout the entire visit.
Preliminary results from the Deep Reef Aquarium indicate a positive influence of the use of educational items such as a digital screen on the time spent viewing the exhibit. We have included research into this potential effect in subsequent studies.
CONCLUSION
This study was conducted to explore the extent to which visitor observations could give a basic insight into visitor behavior, which could ultimately lead to improvement of the exhibits, from a recreational as well as an educational perspective. The findings cannot necessarily be compared with other institutions, and it is necessary for each institution to clearly describe its objectives. At Rotterdam Zoo, these objectives have yet to be formulated, and this study will partly help in doing so. It is planned to conduct further visitor research in order to develop a better understanding of Rotterdam Zoo visitors' behavior and wishes, as well as helping to improve the way we present our conservation messages to our visitors.
ABOUT THE AUTHORS
Juul Zwinkels is a biologist specialized in science and communication. Email: [email protected].
Tania Oudegeest is a biologist and Coordinator of Marine Conservation and Seahorse Care. E-mail: [email protected].
Michaël Laterveer is a marine biologist, Senior Researcher and Aquarium Curator at the Rotterdam Zoo Aquarium, Rotterdam, The Netherlands.
Notes
a Observation periods where visitor numbers were at least 10% higher than average were considered busy; and those where visitor numbers were at least 10% lower than average were considered calm. The observation periods within the 20% range of average visitor numbers are not used in the calculation. This is why not all busy plus calm observation periods add up to 10.
REFERENCES
- Adelman , L. M. , Falk , J. H. and James , S. 2000 . Impact of National Aquarium in Baltimore on Visitors' Conservation Attitudes, Behaviour and Knowledge . Curator: The Museum Journal , 43 ( 1 ) : 33 – 61 .
- Ballantyne , R. , Packer , J. and Hughes , K. Tourists' support for conservation messages and sustainable management practices in wildlife tourism experiences . Tourism Management , In press
- Briseño-Garzón , A. , Anderson , D. and Anderson , A. 2007 . Adult Learning Experiences from an Aquarium Visit: The Role of Social Interactions in Family Groups . Curator: The Museum Journal. , 50 : 299 – 318 .
- Davey , G. 2005 . What is museum fatigue . Visitor Studies Today , 8 ( 3 ) : 17 – 21 .
- Dierking , L. D. , Adelman , L. M. , Ogden , J. , Lehnhardt , K. , Miller , L. and Mellen , J. D. 2004 . Using a behavior change model to document the impact of visits to Disney's Animal Kingdom: A study investigating intended conservation action . Curator: The Museum Journal , 47 : 322 – 343 .
- Doering , Z. D. and Pekarik , A. J. 1997 . Why time is not quality . Curator: The Museum Journal , 40 ( 4 ) : 249 – 252 .
- Esson , E. and Moss , A. 2008 . Decreasing visitor interest in zoo exhibits: Museum fatigue or changes in animal visibility? Unpublished manuscript
- Falk , J. H. , Reinhard , E. M. , Vernon , C. L. , Bronnenkant , K. , Heimlich , J. E. and Deans , N. L. 2007 . “ Why zoos & aquariums matter: Assessing the impact of a visit to a zoo or aquarium ” . In Association of Zoos and Aquariums.
- Korn , R. 2001 . Go figure! Summative evaluation Retrieved January 5, 2009 from http://www.informalscience.org/evaluations/report_42.pdf
- Mitchell , G. , Obradovich , S. , Sumner , D. , DeMorris , K. , Lofton , L. , Minor , J. , Cotton , L. and Foster , T. 1990 . Cage location effects on visitor attendance at three Sacramento Zoo mangabey enclosures . Zoo Biology , 9 ( 1 ) : 55 – 63 .
- Packer , J. and Ballantyne , R. 2002 . Motivational factors and the visitor experience: A comparison of three sites . Curator: The Museum Journal. , 45 : 183 – 198 .
- Philips , L. and Dollinger , P. 2005 . Understanding animals and protecting them, about the world zoo and aquarium strategy. , Bern, , Switzerland : Stämpfli Publikationen AG .
- Ross , S. R. and Lukas , K. E. 2005 . Zoo visitor behavior at an african ape exhibit . Visitor Studies Today , 8 ( 1 ) : 4 – 12 .
- Serrell , B. 1997 . Paying attention: The duration and allocation of visitors' time in museum exhibitions . Curator: The Museum Journal. , 40 : 108 – 125 .
- Tisdal , C. and Perry , D. L. 2004 . Going APE (Active Prolonged Exploration) at the Exploratorium: Phase I summative evaluation report Retrieved January 5, 2009 from http://www.informalscience.org/evaluations/report_153.pdf
- Yalowitz , S. 2004 . Evaluating visitor conservation research at the Monterey Bay Aquarium . Curator: The Museum Journal. , 47 : 283 – 297 .
- Yalowitz , S. S. and Bronnekant , K. 2009 . Timing and tracking studies: Past, present and future . Visitor Studies , 12 ( 1 ) : 47 – 64 .