Abstract
When the piezoelectric film is glued on the surface of a cracked material subjected to mechanical load, change in electric potential distribution is observed on the surface of the film. Based on this phenomenon, the passive electric potential CT (computed tomography) method can be developed, which does not require electric current application for identifying cracks. This method may be applied to develop an intelligent structure with a function of self-monitoring of flaws and defects. For the crack identification from electric potential distribution, an inverse method based on the least residual method was applied, in which square sum of residuals are evaluated between the measured electric potential distributions and those computed by using the finite element method. Numerical simulations were carried out on identification of a through-thickness transverse crack. It was found that the location and size of the crack can be quantitatively identified by the proposed passive electric potential CT method.
1. Introduction
Nondestructive and real-time damage monitoring technique is important for maintenance of structures such as aircrafts, space structures or nuclear power plants. Nondestructive crack identification is recognized as a domain/boundary inverse problem [Citation1] which deals with the estimation of an unknown boundary. Conventional NDT (nondestructive testing) methods such as ultrasonic method, radiation method, or electric-potential method may not be applied for the purpose, since they have some limitations in their applications for automatic inspection, noncontact inspection or remote inspection in severe environment. Development of an “intelligent structure” [Citation2], which has a function of self-damage detection and monitoring, is required for solving the problems. The intelligent structure with self-damage monitoring will provide us continuous and real-time assessment of structural integrity and also gives us warning signals of damage propagation before catastrophic failure of the structure.
Piezoelectric film is a sensing device that generates an electrical charge proportional to a change in mechanical strain. Several investigations have been conducted on the development of intelligent structures using piezoelectric materials. Galea et al. [Citation3] showed the possibility of the use of piezoelectric PVDF (poly vinylidene fluoride) film as a sensing device for detecting and monitoring damages in composite materials. Yin et al. [Citation4] carried out numerical analyses to demonstrate the feasibility of applying PVDF film for damage detection in composites. Li et al. [Citation5] made theoretical and numerical investigation on the development of crack identification technique for the structures on which piezoelectric material was installed.
The present authors proposed the active electric potential CT (computed tomography) method [Citation6–Citation8] for quantitative identification of two- and three-dimensional cracks, by using electric potential distributions observed under electric current applications. The purpose of our study is the development of passive electric potential CT method for quantitative crack identification based on a change in distribution of electric potential observed on the surface of PVDF film, when a cracked material is subjected to mechanical load. In this article, the effects of crack location and size on the electric potential distribution are investigated by the FEM (finite element method) analyses. Numerical simulations are carried out on the estimation of location and size of through thickness transverse crack, based on the FEM inverse analyses.
2. Finite Element Analysis
When cracked material is subjected to mechanical load and PVDF film is glued on the surface of the material, a change in electric potential distribution is observed on the surface of PVDF film. The FEM computer analysis scheme was developed for coupled elastic and electric potential problem to investigate the relationship between crack parameters and electric potential distribution on PVDF film. The governing equations of the piezoelectric material can be written as [Citation9];
(--1)
(--2)
where {σ}and {ε} are stress and strain vector, [C], [e] and [g] are stiffness matrix, piezoelectric coefficient matrix and dielectric constant matrix, respectively. {E}is electric field vector. {D} is electric displacement vector. The static FEM equation, based on Eqs. (Equation1
(--1) ) and (Equation2
(--2) ), is obtained as,
(--3)
where [Kuu], [Kuϕ] and [Kϕϕ] are the mass matrix, displacement electric stiffness matrix and electric stiffness matrix, respectively. {F} and {Q} are the mechanical load vector and the electric load vector, respectively.
From Eq. (Equation3(--3) ), coupled property between an elastic field and an electric potential field is given in [Kuϕ].
The present method can be applied to structures or components subjected to mechanical load which gives rise to electric potential change on the piezoelectric film. A simplest model under uniform tension shown in is employed for simulations using the FEM analyses. This model consists of an elastic substrate material and a PVDF film.
FIGURE 1 Model used in analyses (dimensions in mm)
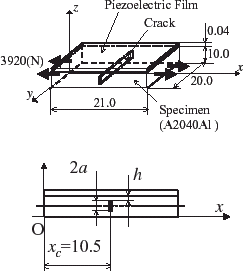
Crack parameters are chosen as follows: a is half length of the crack, h is crack depth from surface of the plate and xc is crack location in the x-direction. The properties of the piezoelectric material [Citation10] and the elastic material are shown in and , respectively. It was assumed that the potential on the interface between the elastic material and PVDF film is 0.
TABLE I Properties of the piezoelectric film
TABLE II Properties of the elastic substrate material
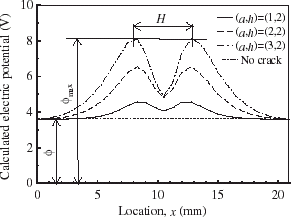
For evaluating the effect of crack length a on electric potential distribution, electric potential distributions for three combinations of crack parameters, i.e. (a, h) = (1, 2), (2, 2) and (3, 2) with keeping h constant, are compared, where a and h are denoted in mm. Furthermore, electric potential distribution on PVDF film was obtained in the case of no crack for investigating the effect of the existence of crack on the electric potential distribution.
The results of FEM calculations are shown in . It is found in that the electric potential value is higher than the remote value ϕ0, which is the same as the value for the case of no crack. The electric potential values show a symmetrical change with respect to the crack location x = xc = 10.5 (mm). The electric potential distribution has two peaks taking a peak value ϕmax. The location of local minimum between the two peaks of potential coincides with location of the crack. It is also found in that the peak value of electric potential ϕmax increases with increase in crack length a.
FIGURE 2 Effect of crack length a on electric potential distributions.
For examining the effect of h on electric potential distribution, the electric potential distributions for five combinations of crack parameters, i.e. (a, h) = (2,1), (2,2), (2,3), (2,4) and (2,5) with keeping a constant, are compared. The results of FEM calculations are shown in . It is found that the peak value of electric potential ϕmax decreases with increase in crack depth h. It is also found that the distance between two peaks H increases with increase in crack depth h.
FIGURE 3 Effect of crack depth h on electric potential distributions.
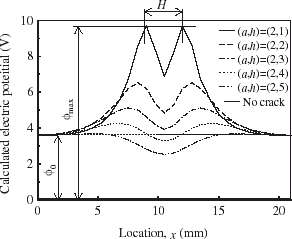
From and , the following features were found in the relationship between electric potential distribution and crack parameters.
| 1. | When the plate has a crack, the electric potential values on PVDF film are higher than that of the plate without crack, and show a characteristic distribution. | ||||
| 2. | Electric potential distribution shows symmetrical shape with two peaks, and the location of transverse crack coinciding with the point of local minimum between the two peaks. | ||||
| 3. | The value of electric potential at the peak ϕmax changes with the crack length a: ϕmax is larger for the longer crack. | ||||
| 4. | The value of electric potential at the peak ϕmax changes with the crack depth h: ϕmax is larger for the smaller crack depth. The distance between two peaks H is larger for the larger crack depth. | ||||
3. Method of Crack Identification
As the inverse analysis method for identification of cracks, the least residual method was applied. In this method, computed values ϕ(c) are compared with the measured values ϕ(m) to determine the most plausible crack location and size. As a criterion for crack identification the following square sum Rs of residual is calculated.
(--4)
Here
denotes measured electric potential value at the ith measuring point, and
(a, h, xc) denotes the electric potential values at the ith measuring point computed by the FEM, in which crack parameters are assumed to be a, h and xc. The values of a, h and xc are denoted in mm. M is the total number of measuring points. The combination of crack location and size, which minimized Rs, was employed as the most plausible one among all the assumed combinations of the crack location and size.
For effective inverse analysis, the following hierarchical calculation steps were introduced.
| 1. | In the first step, crack parameters are roughly estimated. The crack location in the x-direction xc is determined from the location of local minimum between two peaks in the electric potential distribution. In the estimation of a and c, Rs is calculated for the combinations of three crack lengths and three crack depths. It is assumed that Rs is approximated by the following quadratic function of a and h.
| ||||
| 2. | In the second step, the combination of crack parameters, which gives the minimum Rs, is searched by using the modified Powell optimization method [Citation11]. The crack parameters obtained in the above rough estimation are used as the initial values of the crack parameters for the modified Powell method. | ||||
4. Numerical Simulation Of Crack Identification
Numerical simulations are made for crack 1: (a, h, xc) = (3.2, 2.1, 11.3) and for crack 2: (a, h, xc) = (2.3, 3.1, 12.4). In actual applications, are obtained experimentally. In the present computer simulation, the measured values are obtained by the FEM analysis. Artificial noise was added to the computed values. As the noise levels, 0.5, 1.0 and 5.0% were selected. On the surface of PVDF film, electric potential was measured at 49 points placed with an interval of 0.5 (mm). The distribution for crack 1 is shown in . For crack 1 the crack location in the x-direction xc is determined to be 11.5 from the location of local minimum between two peaks in the electric potential distribution in the first step. The combination of a and h, which minimized this approximate function for Rs, is employed as the plausible combination in the rough estimation of crack parameters using Eq. (Equation4
(--4) ).
FIGURE 4 Measured electric distributions for crack 1.
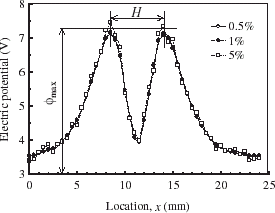
The estimated crack parameters using the least residual method with the modified Powell method are shown in . The combination of initial estimate of parameters, which is used in the modified Powell method, is shown by a circle in . Rs values for crack 1 and noise level of 5% are shown at the grid points of crack parameters. It is found from the table and the figure that the crack parameters can be estimated in a good accuracy and the crack parameters can be identified within the error of 1.0%, when the noise level of observed electric potential distribution is lower than 1.0%.
FIGURE 5 Values of residual (Noise level of 5%).
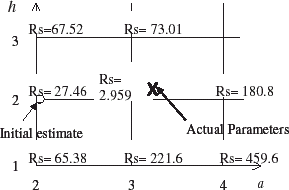
TABLE III Estimated parameters of cracks (error is defined as the ratio of the difference ▵ between actual and estimated values to actual value)
The error in the estimated value of xc is found to be smaller when compared with those in the other crack parameters, a and h. This is due to the relationship between crack parameters and electric potential distribution on PVDF film discussed in the foregoing: crack location xc can be determined from the point of local minimum between two peaks of the electric potential distribution, so the accuracy in the estimation of xc is not affected by absolute values of the electric potential value ϕmax at the peak. On the other hand, crack length a and depth h were determined from the distance of peaks H and magnitude of ϕmax. Therefore, the accuracy in the estimation of crack parameters a and h is prone to the noise in measurements.
As can be seen in and , the presence of the crack gives rise to change of electric potential on the piezoelectric film of the order of V. On the contrary when the active electric potential method [Citation6–Citation8] is applied to the specimen studied in the present study, the electric potential values are in the order of mV and the presence of crack gives rise to a change in the order of 10 µV. The present passive method is easily applied in terms of the measurement of electric potential distribution. Experimental studies on the application of the passive electric potential CT method were conducted and promising results were obtained [Citation12,Citation13].
When there are two or more cracks the present method is applicable if the interaction of the cracks is not significant. When the interaction is significant, the interaction is taken into account in the FEM analyses. The study on identifiability of two or more cracks is now underway.
Conclusions
The passive electric potential CT method was proposed, in which two- and three-dimensional cracks were identified. This method is based on a change in distribution of electric potential distribution observed on PVDF film glued on cracked material subjected to mechanical load. The electric potential distribution on PVDF film was investigated by the FEM. It was found that the electric potential distribution showed a characteristic change with crack location and size. This fact can be used for the identification of the crack. Numerical simulations were carried out for the estimation of location and size of through-thickness transverse crack. It was found that crack parameters can be identified within the error level of 1.0%, when the noise level of observed electric potential distribution was lower than 1.0%.
Acknowledgment
This work was partly supported by the Ministry of Education, Science, Sports and Culture, Japan under the Grant-in-Aid for Scientific Research.
- Kubo, S, 1988. Inverse problems related to the mechanics and fracture of solids and structures, JSME International Journal, Series 31 (2) (1988), pp. 157–166.
- Crawley, EF, and Luist, J, 1987. Use of piezoelectric actuator as elements of intelligent structures, AIAA Journal 25 (1987), pp. 1375–1385.
- Gelea, SC, Chiu, WK, and Paul, JJ, 1993. Use of piezoelectric films in detecting and monitoring damage in composites, International Journal of Intelligent Material Systems and Structures 4 (1993), pp. 330–336.
- Yin, L, Wang, X-M, and Shen, Y-P, 1995. Damage-monitoring in composite laminates by piezoelectric films, Computers and Structures 59 (4) (1995), pp. 623–630.
- Li, S-Q, Kubo, S, Sakagami, T, and Liu, Z-X, 2000. Theoretical and numerical investigation on crack identification using piezoelectric material-embedded structures, Material Science Research Int. 6 (1) (2000), pp. 41–48.
- Kubo, S, Sakagami, T, and Ohji, K, 1986. Electric potential CT method based on BEM inverse analyses for measurement of three-dimensional cracks, Computational Mechanics'86, Proc. of Int. Conf. on Computational Mechanics, Springer 1 (1986), p. V-339–V-344.
- Sakagami, T, Kubo, S, Hashimoto, T, Yamawaki, H, and Ohji, K, 1988. Quantitative measurement of two-dimensional inclined cracks by the electric-potential CT method with multiple current applications, JSME Int. J. 31 (1) (1988), pp. 76–86, Ser.I.
- Kubo, S, Sakagami, T, and Ohji, K, 1991. "The electric potential CT method for measuring two- and three-dimensional cracks". In: Current Japanese Materials Research, Fracture Mechanics. Vol. 8. Japan. 1991. p. pp. 235–254, In: H. Okamura and K. Ogura (Eds.).
- 1978. "IEEE Standard on Piezoelectricity". In: IEEE/ANSI Std. 1978.
- Tashiro, T, Tadokoro, H, and Kobayashi, M, 1981. Structure and piezoelectricity of poly(vinylidene fluoride), Ferroelectrics 32 (1981), pp. 167–175.
- Zangwill, WI, 1964. Minimizing a function without calculating derivatives, Computer J. 7 (1964), pp. 149–154.
- Shiozawa, D, Kubo, S, Sakagami, T, and Okuno, K, 2000. An experimental study on applicability of passive electric potential CT method to crack identification, Journal of The Society of Material Science Japan 51 (8) (2000), pp. 926–931.
- Shiozawa, D, Kubo, S, and Sakagami, T, 2003. "An experimental study on applicability of passive electric potential CT method to crack identification". In: International Conference on Advanced Technology in Experimental Mechanics 2003. 2003, (to be presented).