 ?Mathematical formulae have been encoded as MathML and are displayed in this HTML version using MathJax in order to improve their display. Uncheck the box to turn MathJax off. This feature requires Javascript. Click on a formula to zoom.
Abstract
The dataset "Career Records For All Modern Position Players Eligible For The Major League Baseball Hall of Fame" contains information for the 1340 major league baseball players who had retired prior to the 1993 season and who were eligible for the Major League Baseball Hall of Fame (had played in at least ten seasons). Traditional performance measures included are number of seasons played, games played, official at-bats (AB), runs scored, hits (H), doubles (2B), triples (3B), home runs (HR), runs batted in (RBI), walks (BB), strikeouts (SO), batting average (BA), on base percentage (OBP), slugging percentage (SLG), stolen bases (SB), times caught stealing (CS), fielding average (FA), and primary position played (POS). In addition, the following composite measures are included: adjusted production (AP), batting runs (BR), adjusted batting runs (ABR), runs created (RC), stolen base runs (SBR), fielding runs (FR), and total player rating (TPR). Finally, the dataset includes an indication of whether or not each player has been admitted into the Major League Baseball Hall of Fame and, if so, under what set of rules he was admitted.
1. Introduction
1 In Major League Baseball, a wide variety of performance measures are collected for individual players. These measurements, which stimulate interest in both casual and serious baseball fans, are widely disseminated and at least reasonably well understood by a large proportion of the U.S. population. Indeed, baseball phrases such as hitting a home run, striking out, and play ball! are part of our nation’s collective lexicon. Because of this broad interest, measurements of Major League Baseball player performances are particularly useful in classroom demonstrations of various statistical concepts.
2 One of the most controversial topics of debate among baseball fans is the question of which players have earned, by virtue of their career performances, membership in the Major League Baseball Hall of Fame. There are two ways in which membership may be conferred upon a player. Five years after his retirement, the player becomes eligible for election by the Baseball Writers’ Association of America (the BBWAA). At this stage a player is inducted if he can, in an annual election, gain the support of at least 75% of all writers who have belonged to the BBWAA for at least ten years. If a player is not elected by the BBWAA within twenty years of his retirement, the Veterans Committee may then consider him for induction. This is a small committee comprised of retired players, managers, coaches, and administrators with many years of experience in Major
League Baseball. The Veterans Committee also meets annually and may choose to induct any player no longer eligible for election by the BBWAA. This committee’s purpose is somewhat similar to that of the Old Timers Committee, which was disbanded a few years after the establishment of the Major League Baseball Hall of Fame because it was felt at that time that the committee had outlived its usefulness. Finally, a player must have played at least ten major league seasons to be eligible for membership in the Major League Baseball Hall of Fame.
3 Because the variable of primary interest (Major League Baseball Hall of Fame Membership) in this dataset is categorical, the dataset is appropriate for use in a course on generalized linear models, classification, or discrimination. The career performance measures for the players are suitable independent variables, and each player included in the dataset constitutes one record/observation. Additionally, the data can be (and have been) used to demonstrate concepts in descriptive statistics, basic inference, and multivariate statistics.
2. The Dataset
4 These data appear in Total Baseball (Thorn and Palmer 1993) and The Baseball Encyclopedia (CitationReichler 1993). The data include the traditional performance measures Number of Seasons Played, Games Played, Official At- Bats, Runs Scored, Hits, Doubles, Triples, Home Runs, Runs Batted In, Walks, Strikeouts, Batting Average, On Base Percentage, Slugging Percentage, Stolen Bases, Caught Stealing, and Fielding Average for each modern (post-1900) position player with at least ten years of major league experience. The Primary Position Played by the Player throughout his career, defined as the position at which the player played the most games in his career, is also included. This variable is coded in the following manner:
C = Catcher,
1 = First Base,
2 = Second Base,
3 = Third Base, S = Shortstop,
O = Outfield, and
D = Designated Hitter.
5 Additionally, an indication of the Player’s Hall of Fame Membership Status is included. This variable is coded in the following manner:
0 = Not a member,
1 = Elected by the BBWAA, and
2 = Chosen by the Old Timers Committee or Veterans Committee.
6 The Old Timers Committee, which existed for only a brief period early in the life of the Hall of Fame, was charged with selecting players whose careers were in the nineteenth century. After the demise of the Old Timers Committee, the Veterans Committee was formed and given the responsibility of selecting players overlooked by the BBWAA. Understandably, their selections have often been the source of great controversy (by definition, a player under consideration by the Veterans Committee has already been deemed undeserving by baseball writers).
7 Finally, various composite measures developed by sabermatricians including John Thorn and Pete Palmer (1984, 1993) and Bill CitationJames (1982) are included. Definitions and explanations of the composite measures follow.
Adjusted Production
Also called Production Plus, this measure equals the sum of On Base Percentage and Slugging
Percentage, each indexed by the league average (Thorn and Palmer 1993). Calculated as
Batting Runs
The difference between the linear weights-estimated number of runs generated by the player through his plate appearances and the league average (CitationThorn and Palmer 1984). Calculated as
BR = 0.47(1B) + 0.78(2B) + 1.09(3B) + 1.40(HR)
+ 0.33(BB + HBP) - 0.25(AB - H) - 0.50(OOB),
where 1B represents Singles, HBP represents Hit By Pitches, and OOB represents Outs On Base.
Adjusted Batting Runs
Batting Runs adjusted for differences in home park and indexed against the league average (Thorn and
Palmer 1984).
Runs Created
A composite estimate of run contribution from a variety of batting and base running events (CitationJames 1982). Calculated as
where TB represents Total Bases or 1B + 2(2B) + 3(3B) + 4(HR).
Stolen Base Runs
The difference between the linear weights-estimated number of runs generated by the player through his stolen base attempts and the empirically determined historical break-even success rate of .67 (Thornand Palmer 1984). Calculated as
SBR = 0.30(SB) - 0.60(CS).
Fielding Runs
The difference between the linear weights-estimated number of runs prevented by the player through his fielding chances and the league average at his position (CitationThorn and Palmer 1984).
Total Player Rating
The sum of the player’s Adjusted Batting Runs, Fielding Runs, and Stolen Base Runs minus a positional adjustment, then divided by the estimated number of runs a player of that era must generate to create an additional win for his team (CitationThorn and Palmer 1984).
8 The traditional performance measures are readily available and widely disseminated, and so they are most likely the primary objective criteria used by BBWAA and Veterans Committee members in deciding for whom they will vote. However, the composite measures have been developed in response to perceived inadequacies in the traditional measures. Although the composite measures have gained exposure in recent years, they still are not widely accepted and so are not likely to be considered explicitly by BBWAA and Veterans Committee members. In fact, some eschew the use of these measures because they believe the measures are contrived and ill conceived. However, their inclusion in this dataset is interesting because it allows for some assessment of their validity and consistency with traditional measures.
3. Classroom Use
9 I regularly teach a one-quarter (ten weeks) standard introductory business statistics course. In this course I cover basic descriptive statistical methods (numerical, graphical, and tabular), probability, sampling distributions, and confidence intervals. I have used these data extensively in this course to demonstrate descriptive statistics. For example, the data can be used to illustrate why bar charts based on relative or percentage frequencies are more meaningful than bar charts based on absolute frequencies when comparing two groups of different sizes. Back-to-back bar charts of Primary Position Played for Hall of Fame members and non-members, based on absolute frequencies, are given in .
Figure 1. Absolute Frequencies by Primary Position Played.
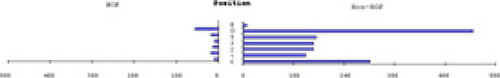
10 It is difficult, based on this graph, to discern if there is a positional bias in Hall of Fame membership. The large discrepancy in the sizes of the two groups (the dataset consists of 124 position players who are members of the Hall of Fame and 1216 who are not members) masks relative differences. However, a similar chart based on relative frequencies, such as the chart provided in , makes the bias much more evident.
Figure 2. Relative Frequencies by Primary Position Played.
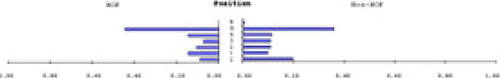
11 Using total number of players eligible as our basis, it is easy to see that outfielders and first basemen enjoy overrepresentation in the Hall of Fame, and third basemen and catchers suffer from under-representation. At this point I also discuss the importance of the basis of comparison—if we used at-bats or games played as our basis, catchers may not appear to be underrepresented. This is, of course, because the demands of the position generally limit catchers to shorter careers.
12 I also provide my students with a similar example using Total Player Rating by Hall of Fame Status (eligible but not elected, elected by the BBWAA, elected by the Veterans Committee). A sample side-by-side histogram is provided in .
Figure 3. Absolute Frequencies for Hall of Fame Membership by Total Player Rating.
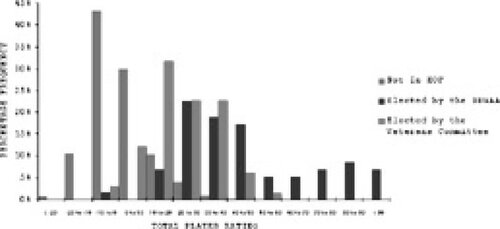
13 This side-by-side histogram does suggest that the great majority of eligible players with relatively low Total
Player Ratings are not in the Hall of Fame. However, the broad scale of the y-axis, necessitated by the large discrepancy in the size of the three groups (1216 eligible players who are not members of the Hall of Fame, 57 position players who have been elected by the BBWAA to the Hall of Fame, and 67 position players who have been elected by the Veterans Committee to the Hall of Fame) makes it difficult to draw further conclusions. Again, a similar chart based on percentage frequencies, such as the chart provided in , is more revealing.
Figure 4. Percentage Frequencies for Hall of Fame Membership by Total Player Rating.
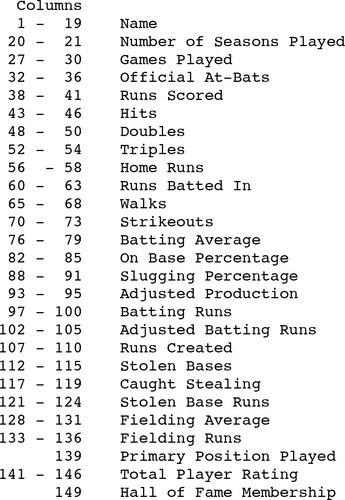
14 From this chart we can conclude that the BBWAA generally elects players with the highest Total Player Ratings. Furthermore, the Veterans Committee, choosing from players who have been passed over by the BBWAA, generally elects players from the remaining pool with the highest Total Player Ratings. Thus we observe some agreement between the composite measurement Total Player Rating and the behavior of the BBWAA and Veterans Committee. We also see potential explanations for the controversy regarding some of the selections made by the Veterans Committee.
15 Frequently I also teach a one-quarter follow-up introductory course on inferential methods for business. In this course I introduce one-sample and two-sample hypothesis testing techniques, chi-square tests of independence and equality of proportions, one-factor and two-factor analysis of variance, and simple and multiple linear regression analysis. I have used these data extensively in this course as well. For example, I ask students to consider independence of total career Strikeouts and Hall of Fame Membership Status. The resulting summary of the data could look like .
Table 1. Frequencies of Total Career Strikeouts
16 Strikeouts were not recorded in early professional baseball, so career strikeout totals are unavailable for twenty players. Ignoring these twenty players, we obtain the chi-square values in .
Table 2. Cell X2 Values for Total Career Strikeouts
17 The p-value associated with the corresponding X2 value (67.529) for six degrees of freedom is less than 0.0001, supporting rejection of the hypothesis of independence between total career Strikeouts and Hall of Fame
Membership Status. A further review of the individual cell X2 values reveals that the actual number of Hall of Fame members in the high strikeout categories (1000 - 1250, 1250 - 1500, ≥1500) greatly exceeds what would be expected if total career Strikeouts and Hall of Fame Membership Status were independent. A classroom discussion on possible explanations (length of career, relative propensity for home run hitters to strike out, etc.) for this seemingly paradoxical relationship ensues.
18 These data are also useful in multivariate statistics courses. Factor analysis of the traditional performance measurements for all players included in this dataset can be used to derive latent patterns that may represent
‘prototypes’ of baseball players with long careers. Canonical correlation analysis of the traditional performance measurements against the composite performance measurements may yield interesting insight into the reliability of the composite measures. Finally, the dataset is well suited for demonstration of generalized linear models, as well as various methods for classification and discrimination. In fact, CitationCochran and Levy (2000) have applied regression tree methodology to these data in an attempt to explain Hall of Fame membership.
19 Because of the general level of interest in baseball, these data are extremely valuable in providing examples that lend insight and promote enthusiasm among students. Those students who are fans of baseball are more engaged and motivated by such examples. While the remaining students might not share their classmates’ enthusiasm, they cannot help but be impressed by the usefulness of statistics when applied to something as ‘mundane’ as baseball.
4. Getting The Data
20 The file MLBHOF.new.dat.txt contains the raw data. The file MLBHOF-tab.new.dat.txt contains the data in tab-delimited format, and MLBHOF.new.xls is an Excel file of the data. The file MLBHOF.new.txt is a documentation file containing a brief description of the dataset.
Corrections
This article was republished with corrections in November 2000. The dataset was modified to include players recently inducted into the Major League Baseball Hall of Fame. In addition, some players who had not finished their baseball careers were inadvertently included in the original dataset and have now been removed. These additions and deletions changed counts of players in the abstract and in paragraphs 10 and 13 of the article. The figures and tables and the X2 value in paragraph 17 have been modified to reflect the changes. The original version of the article is available at http://www.amstat.org/publications/jse/secure/v8n2/datasets.cochran.cfm.
References
- Cochran, J. J., and Levy, M. S. (2000), “Who ‘Deserves’ To Be in the Major League Baseball Hall of Fame?” University of Cincinnati Working Paper # 2000–01.
- James, B. ( 1982), The Bill James Baseball Abstract 1982, New York: Ballantine Books.
- Reichler, J. L. (ed.) (1993), The Baseball Encyclopedia, New York: MacMillan Publishing Company.
- Thorn, J., and Palmer, P. (1984), The Hidden Game of Baseball: A Revolutionary Approach to Baseball and Its Statistics, New York: Doubleday.
- Thorn, J., and Palmer, P.– (1993), Total Baseball, New York: Harper Collins Publishers.
Appendix -
Key To Variables in MLBHOF.new.dat.txt
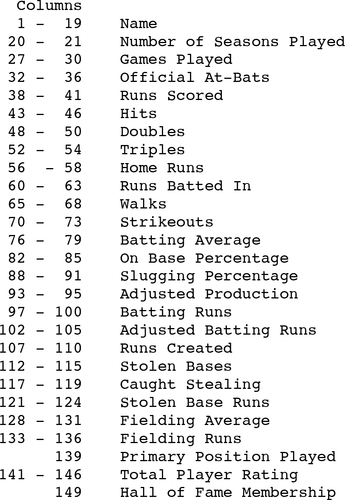
Values are column-aligned. The few missing values occur only where the data were either not collected or are unavailable. Measures such as Caught Stealing, for example, have been collected sporadically throughout Major League Baseball’s history.