
Abstract
Early exposure to data science skills, such as relational databases, is essential for students in statistics as well as many other disciplines in an increasingly data driven society. The goal of the presented pedagogy is to introduce undergraduate students to fundamental database concepts and to illuminate the connection between these database concepts and the functionality provided by the dplyr package for R. Specifically, students are introduced to relational database concepts using visualizations that are specifically designed for students with no data science or computing background. These educational tools, which are freely available on the Web, engage students in the learning process through a dynamic presentation that gently introduces relational databases and how to ask questions of data stored in a relational database. The visualizations are specifically designed for self-study by students, including a formative self-assessment feature. Students are then assigned a corresponding statistics lesson to utilize statistical software in R within the dplyr framework and to emphasize the need for these database skills. This article describes a pilot experience of introducing this pedagogy into a calculus-based introductory statistics course for mathematics and statistics majors, and provides a brief evaluation of the student perspective of the experience. Supplementary materials for this article are available online.
1 Introduction
Data wrangling and database skills are essential to statistics careers, yet many students (both majors and nonmajors) are not exposed to these concepts. Horton, Baumer, and Wickham (Citation2015) suggest that students develop data science skills early and often, beginning with the introductory course, and that early exposure is critical. Similarly, the Curriculum Guidelines for Undergraduate Programs in Statistical Science prepared by the American Statistical Association (ASA) (Citation2014) emphasize the increased importance of data science and the need for students to be “facile with database systems” (for an early discussion see Higgins (Citation1999)). Since database systems provide efficient, shared access to persistent data, the understanding of these systems is critical to asking questions about the data. Data wrangling or “data processing” converts the raw data contained in the database into meaningful information (Rudo, Citation2014), and it is an essential component in the data analysis cycle highlighted by “Tidy” and “Transform” in (Wickham and Grolemund, Citation2017, p. 3). One must strategically manipulate and process the data prior to visualization, modeling, and the communication of results, yet this part of the cycle is often omitted in an introductory course. This article will highlight an integrated set of activities to assist in introducing these essential data manipulation concepts.
Fig. 1 Featured aspects of the data analysis cycle (Wickham and Grolemund, Citation2017, p. 3) are highlighted in the rectangle.
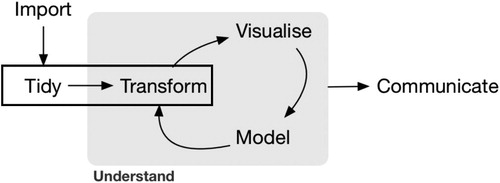
Although omitted in many statistics courses, the “Tidy” and “Transform” aspects of the data cycle (Wickham, Citation2014, p. 3) are included in newly developed data science courses. In a review and discussion of seven exemplar data science courses, Hardin et al. (Citation2015) note that these examples all include relational databases and SQL as a topic in a semester-long data science course. The data science course discussed in Baumer (Citation2015) includes a three week section on data manipulation/wrangling where students “learn to perform the most fundamental data operations in both R (R Core Team, Citation2017) and SQL and are asked to think about their connection” (Baumer, Citation2015, p. 37). An introductory statistics class does not have three weeks to focus on data manipulation.
This article reports on the experience of incorporating fundamental aspects of data manipulation within the context of an introductory statistics course. The activities presented will focus on basic data manipulation in R and its relationship to SQL. These elementary database skills are introduced by integrating the computer science education product from the Databases for Many Majors (DBMM) project (http://databasesmanymajors.faculty.asu.edu/) into a statistics classroom. The skills are then applied in the context of the dplyr statistical package (Wickham et al., Citation2017) for R to focus on the statistical application of these skills. This experience should also be useful for data science courses by providing a conceptual overview of the connection between fundamental data operations in R and SQL before delving into the deeper details of data manipulation and analysis.
The goal of the Databases for Many Majors project is to provide engaging modules to visually introduce fundamental database concepts to students with diverse backgrounds. There are three visualizations with supporting curricula that cover various database aspects. The first introduces relational databases and how they differ from spreadsheets. The second covers querying of relational databases; and the third discusses the conceptual design of data, which explains how to model data and then map the design to a relational database schema. Each of these topics is contextualized within multiple STEM domains that utilize databases, specifically in Astronomy, Computational Molecular Biology, Environmental Science/Ecology, Forensics, Geographic Information Systems, and Sports Statistics, to attract students of all majors (not just statistics/data science majors) and to promote relevance to a variety of students. This early exposure and introduction to database topics has a broad audience and can be used in any course that wants to promote early data science skills, including introductory statistics.
Data can be manipulated and queried using a number of tools. SQL is a tool used in the database field for database manipulation and querying. In statistics, R is a comprehensive open source software that is capable of all aspects of the data analysis cycle, and the dplyr package supports the process of manipulating, sorting, summarizing, and joining data frames and efficiently storing and accessing large amounts of data within R. “dplyr is a grammar of data manipulation, providing a consistent set of verbs that help you solve the most common data manipulation challenges” Wickham et al. (Citation2017) (see https://dplyr.tidyverse.org/ for more details). Although one can directly use SQL within R in package sqldf (Grothendieck, Citation2017), the desired learning objective is for students to understand how dplyr supports these fundamental database concepts and to apply this knowledge in the context of problem solving in statistics.
This article describes an experience of incorporating the database visualizations for relational databases and querying within the context of an introductory statistics course, followed by the application of these concepts in exercises within the dplyr framework. The integration of the visualizations and dplyr activities were piloted in a calculus-based Introductory Statistics Course for mathematics and statistics majors/minors.1 Section 2 overviews the concepts introduced within the database visualizations that students were asked to complete outside of class-time. Section 3 describes the connections between these database concepts and the dplyr package for R, and the corresponding statistics activities that utilize the five main dplyr verbs: select, filter, arrange, summarize, and mutate. The presented activities allow students to translate database skills learned in the visualization into the dplyr framework. The article concludes with a discussion of the experience, student perspectives, and future research directions.
2 Database Visualizations
The database visualizations are three separate but related interactive animations that introduce the concepts of relational databases and querying using SQL (Dietrich et al., Citation2015), and database design (Goelman and Dietrich, Citation2018). The objective is to provide all faculty, including introductory statistics instructors, with self-contained database animations that they can use to supplement their curricula. The visualizations can be assigned as an out-of-class activity, with each animation taking about an hour to complete. Each module contains a formative self-assessment component, known as a checkpoint, that can be assigned to students to complete before class. It is recommended to provide students with a performance goal for the checkpoints. There are additional instructor resources available that consist of cooperative learning exercises to use in class, if desired. The visualizations are also customizable and are available in different application domains to promote relevance to a variety of students. The visualizations and resources are freely available at http://databasesmanymajors.faculty.asu.edu/.
This article reports on an experience that incorporates the first two modules on relational databases and querying into an introductory statistics course. Both of these modules have been previously introduced into a computational molecular biology class as well as database courses for nonmajors and majors across two major universities. Dietrich et al. (Citation2015) supports the pedagogical effectiveness of the visualizations. After this study, the checkpoint was added to the visualizations so that students can check the status of their learning (Dietrich and Goelman, Citation2017). Students appreciate the opportunity to quiz themselves on the topics within the animations and typically use the visualizations multiple times to reinforce concepts and review for exams. The reader is encouraged to run the visualizations customized for sports statistics, specifically baseball, that are described in this section. An appendix, within the online visualization, provides the information on how to run the animations.
2.1 IntroDB: Introduction to Relational Databases
The IntroDB module promotes the basic understanding behind relational databases. Databases provide a powerful tool to ask different questions, or queries, of the data without changing the data. In this module students learn: the limitation of spreadsheets, the breakdown of spreadsheets into smaller tables to avoid redundancies, the introduction of primary and foreign keys and how a database uses keys to identify and relate information, as well as a brief introduction to asking questions over a database.
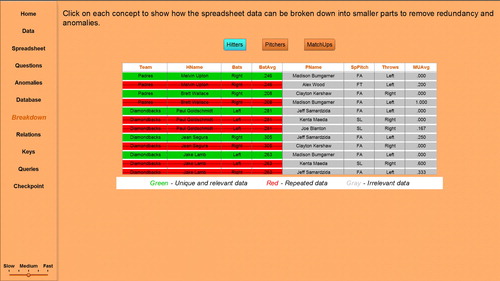
In the Sports Statistics customization of the visualization, baseball statistics relate Hitters and Pitchers with information on the match-ups between the hitter and pitcher. The visualization illustrates how spreadsheets with redundant data may have anomalous situations when updating, deleting, and inserting data. Databases avoid these issues by breaking down the data into separate tables without unnecessary repetition, as illustrated by the Breakdown topic of the visualization. shows that the given spreadsheet combines three concepts: Hitters, Pitchers, and MatchUps. The Hitters button has been selected, showing how the concept would be stored in a table, where the green rows represent the resulting data (in the Hitters table), the red strike through rows are redundant data, and the gray data are not relevant to that particular concept. By selecting each button, the user sees how the data in the database tables are created.
Fig. 2 IntroDB: Sports statistics spreadsheet breakdown.
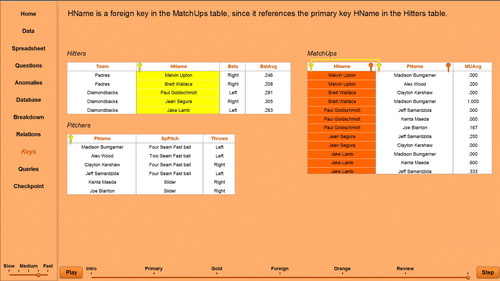
Thus, a database is a collection of tables without unnecessary repetition. These tables must be combined to answer certain questions over the data. The associations between the tables are formed with the concept of primary and foreign keys. shows a screen shot of the Baseball Statistics database, indicating the primary keys with a gold key and foreign keys with a different-shaped orange key. Primary keys are attribute(s) that uniquely identify a row in a table, such as HName in Hitters and PName in Pitchers. Typically, every table has a primary key, which may consist of one attribute or a combination of several attributes. Note that the MatchUps table has a composite primary key consisting of the combination of HName and PName (shown linked in the screen shot), uniquely identifying the matchup average for that hitter and pitcher combination. A foreign key consists of attribute(s) in a table that are referencing the value of a primary key in another table, such as HName in MatchUps and PName in MatchUps. Hitters and Pitchers do not have any foreign keys because they do not contain a primary key of another table. In the screen shot, the orange foreign key next to HName has been selected, highlighting the HName column in MatchUps in orange and highlighting the HName column in Hitters in gold. This visualizes that a value of the foreign key (HName in Matchups) must appear as a value of the primary key in the related table (HName in Hitters). Databases use this relationship between the primary and foreign keys to combine tables together when needed to answer a query, which is further elaborated on in the querying visualization.
Fig. 3 IntroDB: Baseball statistics tables with keys.
2.2 QueryDB: Introduction to Querying
The Introduction to Querying module provides a conceptual introduction to the various operations required to retrieve data from a database to answer a question. The visualization of these operations and their corresponding specification in SQL provides a strong foundation for students to use SQL to query relational databases. In this module students learn various operations for combining data to answer queries, such as common set operators, horizontal and vertical filtering, and joins. In addition, these operations are mapped to the SQL industry standard query language so students can understand basic SQL syntax.
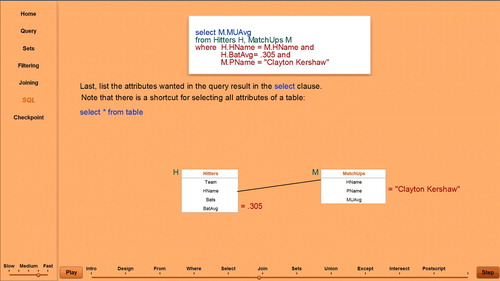
QueryDB assumes that students have already viewed the IntroDB visualization, and focuses more on how to answer queries by filtering and combining tables. When designing a query, it is important to know the tables, their attributes, and the primary and foreign keys. provides this abstraction of a database, known as a schema, for the Baseball Statistics application. This is a visual schema, showing the primary and foreign keys with these associations between the tables illustrated through links. The highlighted rows illustrate the design of the query mentioned in the screen shot, which finds the match-up average for a hitter with the given batting average against a particular pitcher. The highlighting is built dynamically as the student is walked through the design of that query using the given information and the primary-foreign key associations between the tables. The visualization then introduces by example the fundamental set operators (union, intersection, negation) that operate on tables having the same format. Students are then presented with new operators that filter the tables both horizontally and vertically as well as operators that combine tables on the primary-foreign keys to provide a larger table needed to answer a query. The latter are called joins. After introducing these various operators, the industry standard SQL for querying databases is introduced and a textual query is built up incrementally along with a visual representation of the query, as shown in . The SQL query provides the answer to the query designed in , which incorporates horizontal filtering (batting average and pitcher name) and vertical filtering (matchup average) in combination with a join (hitters name).
Fig. 4 QueryDB: Baseball statistics query design.
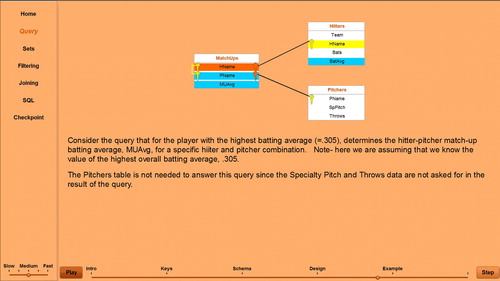
Fig. 5 QueryDB: Baseball statistics SQL query with visual representation.
The key concepts from IntroDB and the operations for manipulating and combining data in QueryDB are definitely applicable to statistics as an essential part of the data analysis cycle. The dplyr package for R also uses these concepts for data manipulation, as illustrated in the next section.
3 dplyr Connection
This introduction to data science concepts was embedded within the context of an introductory statistics course, by exposing students to questions from datasets requiring some “data wrangling” skills, which are important in both databases and statistics. In the database field, SQL is the industry standard language that provides extensive support for asking questions over data stored in the database, including some fundamental operations for data analysis, such as sum, minimum, maximum, average, and count. In statistics, R is a tool that offers extensive data visualization and analysis tools, and dplyr is the language that manipulates the data for analysis. The learning objective of the activities is for students to understand the fundamental database concepts and data manipulation operations illustrated in the visualizations and to apply these techniques to statistics activities. Although students are learning how to apply these operations in the context of the syntax of SQL and R, specifically dplyr, the ultimate goal is to have students truly understand the operations so that they can apply these concepts to other contexts and languages even as technology changes. Thus, other popular packages, such as SAS, can also be used to analyze and access a relational database utilizing the basic tools taught within the tool (SAS Institute Inc., Citation2019).
The data wrangling connections emphasized in the activities highlighted essential data manipulation of a dataset and the combination of datasets. A first step in data wrangling is the ability to perform basic data queries and to reduce the dataset to only the variables and characteristics of interest, arranging the data for communication of results. A second essential step in data wrangling is the ability to combine various datasets correctly to answer more complicated questions. shows the visualization concept and its correspondence in SQL and dplyr. Most of these connections, with the exception of the set based operations (union, intersection, difference), were incorporated within the activities assigned to the students.
Table 1 Connections between visualizations, SQL, dplyr.
The first student activity focuses on essential data wrangling without the combination of datasets. This activity should be assigned as early in the term as possible after a discussion on basic descriptive statistics and basic visualizations. The experience with the integration of the activity is described briefly in Section 4 and the activity itself is included in the supplementary materials. Students were asked to “Find the average height of human Starwars Characters” using the Star Wars characters dataset included in dplyr as the “starwars” tibble. This question requires the student to select the variable height, filter the dataset to only include human characters, and summarize to find the mean or average height. displays the corresponding dplyr and SQL syntax. Both dplyr and SQL rename the resulting column as avgheight. Note that the activities do not require the use of the pipe operator % >%. The actual activity is broken down into smaller pieces. The pipe operator is shown here to provide a unified syntax that corresponds to the SQL query.
Table 2 Syntax comparison: average height of human starwars characters.
Although not explored as part of this initial pilot activity, the students can explore entering SQL syntax directly in R utilizing the SQLdf package (Grothendieck, Citation2017). Since SQLdf uses data frames in R and not dplyr tibbles, the Starwars tibble should be exported to a data frame for use in SQLdf [Starwars = as.data.frame(starwars)]. The SQL syntax shown in would be a quoted parameter of the function sqldf. This would be an interesting connection to add to future versions of the assignment.
A second activity was created to reinforce the concept of a join, which combines datasets, within a statistical question. The second activity should be introduced after a discussion of one-way analysis of variance or linear regression. Again, the activity itself is included in the supplementary materials. A question is posed to the students using the Lahman package (Friendly, Citation2017), which provides the tables from Sean Lahman Baseball Database as R data frames, “Are higher salaries in Major League Baseball related to higher batting statistics post 1985?” To answer this question, students must first filter the Batting dataset for seasons post 1985 and then combine the Batting and Salaries data frames on the combination of attributes linking the data using a join in dplyr. compares the syntax for dplyr and SQL for the question posed to the students. Again, the pipe operator is introduced for correspondence with SQL. Also, the join connection can be further explored by asking students to provide a corresponding SQL specification of their dplyr commands, which is then tested using the SQLdf package.
Table 3 Syntax comparison: joining batting with salaries.
The connection between database and statistics is an integral component of data science. By learning fundamental database concepts and querying, statistics students will be able to apply these techniques in both contexts. Students are able to retrieve the data that they need from databases and further analyze and visualize that data using dplyr in R. The experience of integrating the above activities in the classroom, along with student’s perspectives on the experience are discussed in the next section.
4 Discussion
To briefly assess the perceived impact of the integrated materials, students (n = 30) were given a survey to answer both Likert-type and open-ended questions about the integration experience after the first activity. Student responses to the integration activity presented in were mostly positive, and most students reported that the visualizations support their learning and understanding of the problem. Representative feedback is included below.
Table 4 Student responses to the integration of the visualizations and dplyr.
“I liked how the class involved another aspect to our course such as SQL. I feel like more self taught projects and examples would be really beneficial for us the students to expand our horizons of what is out there.”
“I appreciated the chance to get a flavor of data science in the class.”
The skills learned in the animations are transferable to other platforms. For example, the first animation introduces tables that are conceptually linked using primary and foreign keys. In fact, 96% of students identified the proper composite primary key and successfully joined the two tables for analysis. The concepts presented provide a foundation for learning database querying in any language including R (see Wickham, Citation2014 for an R example). Although the querying visualization focuses on SQL, it was noted by Hardin et al. (Citation2015) (when referring to a course by Wickham) “while each language may have its own syntax the underlying operation that is being performed on the data is the same.” The animations can also assist students conducting Senior Capstone courses, like those reviewed in Martonosi and Williams (Citation2016), to bridge the gap between students’ statistical training and the data manipulation and management challenges of the real-world.
This integration of database skills in an introductory statistics course is promising. The pilot described in this article provided an initial experience with the introduction of database visualizations of fundamental concepts into an introductory statistics course. Students appreciated the visualization of the concepts and the ability to apply these concepts in R with dplyr, and were able to successfully perform a more complicated data manipulation by the second activity.
There are additional benefits of introducing database skills early in this course. After the students were able to perform basic data manipulation, larger, nontrivial datasets were used in homework assignments. Students were required to manipulate the data using the five verbs to accurately answer the questions in the homework; expanding their experience beyond the textbook.
The synergy of databases and statistics is an important learning objective for an introductory statistics course. Future work will explore additional avenues and opportunities to revise and incorporate synergistic activities into the curriculum.
Supplementary Materials
The Database handout includes a brief description of key dplyr “verbs” to Query a dataset just like the DBMM visualization. The five key data manipulation “verbs” are presented with their corresponding SQL commands. The Verb Activity is a series of questions that require the application of all five verbs presented. The Join Activity is an active learning activity that connects the Database Concepts and dplyr utilizing a sports statistics example in the R package: Lahman. This activity reinforces the concept of a join, which combines datasets, within a statistical question.
Funding
Supplemental Material
Download PDF (826.1 KB)Additional information
Funding
Notes
1 This course is a year-long introduction to statistics and probability with a calculus requirement, often referred to as Engineering Statistics. This is the students’ first course in University-level Statistics.
References
- American Statistical Association (ASA) (2014), “Curriculum Guidelines for Undergraduate Programs in Statistical Science.”
- Baumer, B. (2015), “A Data Science Course for Undergraduates: Thinking With Data,” The American Statistician, 69, 334–342. DOI:10.1080/00031305.2015.1081105.
- Dietrich, S. W., and Goelman, D. (2017), “Formative Self-Assessment for Customizable Database Visualizations: Checkpoints for Learning,” in 2017 ASEE Annual Conference & Exposition, Columbus, OH: ASEE Conferences.
- Dietrich, S. W., Goelman, D., Borror, C. M., and Crook, S. M. (2015), “An Animated Introduction to Relational Databases for Many Majors,” IEEE Transactions on Education, 58, 81–89. DOI:10.1109/TE.2014.2326834.
- Friendly, M. (2017), “Lahman: Sean ‘Lahman’ Baseball Database,” R Package Version 6.0-0.
- Goelman, D., and Dietrich, S. W. (2018), “A Visual Introduction to Conceptual Database Design for all,” in SIGCSE ’18 Proceedings of the 49th ACM Technical Symposium on Computer Science Education, Baltimore, MD. ACM, pp. 320–325.
- Grothendieck, G. (2017), “sqldf: Manipulate R Data Frames Using SQL,” R Package Version 0.4-11.
- Hardin, J., Hoerl, R., Horton, N. J., Nolan, D., Baumer, B., Hall-Holt, O., Murrell, P., Peng, R., Roback, P., Lang, D. T., and Ward, M. D. (2015), “Data Science in Statistics Curricula: Preparing Students to ‘Think With Data’,” The American Statistician, 69, 343–353. DOI:10.1080/00031305.2015.1077729.
- Higgins, J. J. (1999), “Nonmathematical Statistics: A New Direction for the Undergraduate Discipline,” The American Statistician, 53, 1–6. DOI:10.2307/2685641.
- Horton, N. J., Baumer, B. S., and Wickham, H. (2015), “Setting the Stage for Data Science: Integration of Data Management Skills in Introductory and Second Courses in Statistics,” CHANCE, 28, 40–50. DOI:10.1080/09332480.2015.1042739.
- Martonosi, S. E., and Williams, T. D. (2016). “A Survey of Statistical Capstone Projects,” Journal of Statistics Education, 24, 127–135. DOI:10.1080/10691898.2016.1257927.
- R Core Team (2017), R: A Language and Environment for Statistical Computing, Vienna, Austria: R Foundation for Statistical Computing.
- Rudo, P. (2014), “6 Important Stages in the Data Processing Cycle.”
- SAS Institute Inc. (2019), “Methods for Accessing Relational Database Data.”
- Wickham, H. (2014), “Tidy Data,” Journal of Statistical Software, 59, 1–23. DOI:10.18637/jss.v059.i10.
- Wickham, H., Francois, R., Henry, L., and Müller, K. (2017), “dplyr: A Grammar of Data Manipulation,” R Package Version 0.7.4.
- Wickham, H., and Grolemund, G. (2017), R for Data Science: Import, Tidy, Transform, Visualize, and Model Data (1st ed.), Newton, MA: O’Reilly Media, Inc.