
Abstract
The reform movement in statistics education has led to a revitalization of the undergraduate introductory statistics course. However, many students satisfy their degree requirements by taking statistics courses in “client departments” such as business, the social sciences, and the lab sciences, typically taught by non-statisticians. This article presents the findings of a metasynthesis of the existing literature on teaching statistics in these client disciplines to learn (1) what is currently being taught and how, and (2) the most important challenges for statistics teachers in other departments. Articles were reviewed using qualitative axial coding and quantitative text analysis to identify common research themes and ideas in the literature for each discipline. Research themes, attitudes toward statistics instruction, and pedagogical techniques were found to vary from discipline to discipline. Collaboration with instructors in other disciplines may be a welcome step toward improving statistics instruction across the university.
1 Introduction
A primary focus of statistics education research in the last thirty years has been the introductory statistics course, commonly referred to as “Stat 101.” While there has been great progress in modernizing the “Stat 101” course, statistics education research often misses an important segment of the student population: students taking statistics in other departments.
As George Cobb said in 1993,
“Of all subjects taught as often as statistics, surely no other subject is so often taught by faculty with so little formal training in the subject.” (Cobb Citation1993)
Cobb has not been the only statistics educator to call for increased attention to the wider statistics curriculum. Garfield et al. (Citation2002) recommended developing support for instructors in client disciplines almost a decade later. To develop such support, statistics educators need to know who is teaching statistics, and to whom. While there is no concrete data available on how many students are taking statistics courses outside of mathematics and statistics departments, some recent articles have made rough estimations. A survey of sociology department chairs at four-year colleges and universities in the United States estimated that 66% of departments taught their own introductory statistics courses (Delia Deckard Citation2017). In a study of statistical literacy skills at a large Canadian university, 15 of the available 43 courses covering statistical content were offered by the Faculty of Mathematics (McLauchlan and Schonlau Citation2017). Others in business schools estimated that 25–30% of core business statistics courses were taught by mathematics and statistics departments (Phelps and Szabat Citation2017). Based on this limited information, a reasonable estimate might be that 25–50% of students taking statistics are doing so in mathematics and statistics departments. In other words, 50–75% of students taking introductory statistics at the collegiate level are doing so somewhere else.
Not only are students routinely taught statistical content in other disciplines or departments, but they are frequently taught by faculty who do not consider themselves statisticians. McKenzie (Citation1996) estimated that 40% of business statistics courses at the MBA level were taught by people who regarded statistics as a “secondary activity.” This proportion has actually increased recently; in a similar survey conducted in 2001 it was estimated that 52% of instructors viewed statistics as secondary (McAlevey, Everett, and Sullivan Citation2001). A survey of faculty at seven research institutions and four-year colleges in the southern United States found that 6% of faculty teaching statistics had never actually taken a statistics course themselves (Doehler, Taylor, and Smith Citation2013).
Researchers in fields such as nursing (Hagen et al. Citation2013a) and psychology (Onwuegbuzie and Wilson Citation2003) have noted that while statistics is an important part of their curriculum, either as an individual course or embedded within other courses, there is often little to no field-specific research in the pedagogy of statistics. McAlevey, Everett, and Sullivan (Citation2001) called for a “rescue of statistics” in business schools in the early 2000s, and the desire for statistics reform across the university is not new.
Recently, calls for change in the use of statistics in published research have become more frequent and more passionate. Journal editors have suggested the drastic step of banning null hypothesis significance testing (Trafimow and Marks Citation2015), and the statistics community has responded with both enthusiasm (McShane and Gal Citation2016; White and Gorard Citation2017) and skepticism (Carlin Citation2016; Wasserstein and Lazar Citation2016). Simulation-based inference has become a popular alternative in the statistics education community to traditional inferential statistics (Tintle et al. Citation2015; Maurer and Lock Citation2016; Hildreth, Robison-Cox, and Schmidt Citation2018; Case, Battles, and Jacobbe Citation2019), and may help address persistent misconceptions about inference. These changes to the curriculum have been incorporated in many “Stat 101” courses, however, it is unclear what, if any, changes have been made in discipline-specific statistics courses to address both recent controversies and advances in statistics.
The purpose of this article is to investigate what statistical content is being taught in client disciplines and identify current trends and themes in the statistics education literature. This article will describe trends in research articles describing statistics instruction in the lab sciences, the social sciences, the health sciences, and in business using both qualitative and quantitative research methods. This review is intended to serve as a first step to understanding the diverse needs of statistics educators in other disciplines, as well as the current “state of statistics” university-wide.
2 Methods
Metasynthesis, the adaptation of systematic review techniques for qualitative studies (Lachal et al. Citation2017), was used to select and evaluate research articles on teaching and learning in statistics from outside of the statistics education community. The literature collection resulting from this search was analyzed using two techniques: qualitative thematic analysis and quantitative text analysis. These techniques were selected to provide a structured approach to reviewing the literature.
2.1 Selection Criteria
Articles were identified through searching four databases: Academic Search Premier, SCOPUS, Google Scholar, and Science Direct. Search terms included “statistics education,” “statistics course,” and “teaching statistics,” and a particular discipline, such as “biology,” “political science,” or “business.” Searches such as “introductory statistics” were not used, since in exploratory searches this tended to result in articles recommending that students in a particular program take a statistics course. The review focused on articles related to statistics education published in the last 20 years.
Based on this criteria, 61 articles were identified that described the teaching of undergraduate or graduate statistics in another discipline or university-wide at two-year or four-year colleges and universities, either in a stand-alone course or as part of another course (e.g., statistics and research methods). Articles that merely recommended students take a statistics course were not included in this study, however, articles that described particular content, sequencing, or teaching strategies for this course were kept.
Next, articles were classified into one of four client discipline “groups”: business, health sciences, social sciences, and STEM (science, technology, engineering, and mathematics). A fifth, “general education” category encapsulated articles that described statistics instruction in multiple major disciplines or at the university-level and appeared in nonstatistics education journals such as The Journal of College Teaching. The health sciences and STEM were treated as separate categories due to differences in the general audience and focus of the courses. Articles classified as “health sciences” articles were generally focused on preprofessional education, such as courses for students in nursing or epidemiology programs. These classes are designed for a specialized group of students, and as such are often more directly focused on health-specific applications. STEM-designated articles, on the other hand, usually did not focus on a particular statistics course. Instead, these articles addressed statistics instruction within existing courses, such as an introductory biology or chemistry course, or courses developed for students in the lab sciences.
Articles were also categorized according to the aspect of statistics education that was described: a course in statistics or research methods, faculty training in teaching statistics, programmatic or curricular requirements for statistics instruction, and review articles of previous research in teaching statistics. Article types varied somewhat by discipline, but in all discipline groups the majority of articles were based around a single course. Many of these single-course articles consisted of anecdotal descriptions only, although some described evidence-based studies of teaching and learning in statistics. There were also a few articles in each discipline that described either existing or proposed curriculum requirements. Two articles were reviews of statistics education in a particular discipline: one on evidence-based teaching practices for statistics in nursing (Hayat Citation2014) and one describing statistics anxiety research in psychology (Onwuegbuzie and Wilson Citation2003). The number of articles reviewed in each discipline and type are in .
Table 1 Article types classified by discipline.
2.2 Qualitative Analysis
Articles were reviewed and coded in two phases using a grounded theory-based approach (Strauss and Corbin Citation1998; Charmaz Citation2006). Grounded theory refers to a system of qualitative research in which qualitative data is analyzed using a cyclical, inductive approach. The research goes through several iterative coding phases to categorize the qualitative artifacts collected. Grounded theory is often used in exploratory qualitative research, where the intent is not to confirm an existing theory but identify key repeated ideas in the artifacts—in this case, the articles under review.
During the initial coding phase, detailed notes were taken on important ideas, conclusions, references, and evidence presented in each article. Based on these notes, articles were assigned four to six key terms, such as “computer labs,” or “statistics self-concept,” that emerged from repeated ideas in the notes. The number of terms assigned at each stage was determined organically, there was no set “target” number of terms for a review stage. In the secondary review phase, axial coding was used to group these key terms into larger concepts, or “themes.” Each article was eventually assigned two to three major themes, such “active learning” or “statistics anxiety.”
2.3 Quantitative Analysis
In addition to qualitative coding, articles were analyzed using quantitative text mining. Each article was imported into a plain text file, and references, figure descriptions, and table text were removed—leaving only the “narrative” of the article. Bigrams, or word pairs, were constructed using the “tidytext” library in R (Silge and Robinson Citation2016) after removing “stop words” (i.e., “the,” “and,” “in,” etc.) and references to particular colleges/universities, course designations, and semesters. The most frequently occurring bigrams from the resulting text database were considered representative “quantitative themes,” and provided a validity check against the qualitative analysis.
3 Results
Research themes varied significantly across disciplines, however, there were some commonly repeated themes: relevance of courses, statistical anxiety, and incorporation of modern pedagogical techniques (flipped classrooms and active learning). There were varying levels of interest in collaboration and involvement of statistics educators in developing courses. Many authors in the client disciplines expressed a sense of ownership and did not want outside influences in their courses. Others actively advocated for collaboration with statisticians when designing and modifying courses.
3.1 Overall Research Themes
The most common ideas in the statistics education literature vary widely by discipline. Not surprisingly, the most common theme overall was “content/curriculum,” as shown in . Many of the articles in the literature described the design or content of a particular course, or curricular recommendations for a course or program. “Active learning” was another popular theme in these articles. As colleges and universities encourage the integration of more active pedagogy into their classrooms, it is only natural that discussion of active learning has increased in the literature. Other common themes included the development of course “modules,” statistics “anxiety,” “collaboration” with other instructors, and the “relevance” of statistics.
Fig. 1 Qualitative themes and bigrams for all articles.
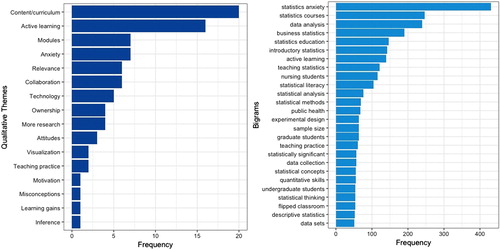
Text analysis supported the qualitative thematic conclusions. Among all articles, “statistics anxiety” was the most frequently occurring bigram—suggesting that many researchers in other disciplines are concerned about the student experience in their courses. Many of the most frequent word pairs relate to a particular discipline (“business statistics,” “nursing students,” “public health”) or common course descriptors and content (“data analysis,” “statistics courses,” “introductory statistics”). Exploring these word pairs and themes by discipline paints a clearer picture of the prevailing research ideas.
3.2 Statistics Education in Business
Research in statistics education in business schools is primarily focused on developing the content and curriculum of their courses (). Another major theme is the incorporation of technology (“technology” and “active learning”) and real-life applications. Student learning gains are often measured through course performance in business statistics classes, such as final exam scores, rather than using an externally validated assessment.
Fig. 2 Qualitative themes and quantitative bigrams for articles in business.
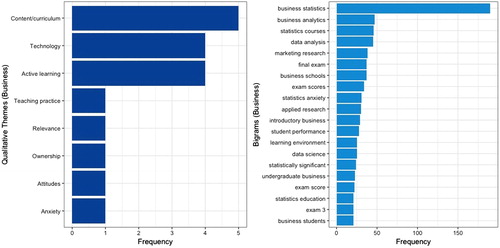
“Technology” was a common qualitative theme in business courses. Spinelli (2001) was an early proponent of introducing real-life statistical technology in business statistics and studied the use of Minitab as an alternative to a graphing calculator in the early 2000s. Currently, Excel appears to be the “standard” software used in statistics, with R becoming a popular alternative for business analytics courses (Phelps and Szabat Citation2017). There is also interest in studying the “learning environment” for statistics courses, usually attempting to improve it by incorporating “active learning” or teaching in a computer lab. However, one study in the Journal of Education for Business showed a small negative effect on course performance from teaching business statistics in a computer lab compared to a traditional classroom (Martin Citation2011). There is also some evidence that online homework has little effect on student performance in business statistics, after controlling for instructor effects (Palocsay and Stevens Citation2008). Two assessment instruments have recently been developed specifically for measuring student attitudes toward statistics in the business classroom: Business Statistics Computer Laboratory Environment Inventory (BSCLEI) and the Attitude toward Business Statistics Instrument (ABSI) (Nguyen, Newby, and Skordi Citation2015). Preliminary analysis of these scales suggested that instructors should use relevant and meaningful course examples and encourage students to solve problems in class using software and collaborate with others to improve the classroom learning environment. These recommendations likely sound familiar to statistics educators, as they are similar in spirit to the GAISE College Report Recommendations (Aliaga et al. Citation2005; Carver et al. Citation2016).
Applications are important to statistics educators in business, who make frequent references to “data analysis,” “marketing research,” and “applied research” (). Some have suggested using “headline-grabbing” news events in business statistics courses—as well as the Journal of Statistics Education as a possible source for examples (Becker and Greene Citation2001). Interesting applications are noted as being especially important in a second business statistics course, which is often more specialized (Nonis and Hudson Citation1999).
Many statistics educators in business are concerned with course assessment or using course performance as evidence of successful teaching. For example, Simmons (2014) used exam scores to compare student learning gains under three teaching models: online learning, face-to-face learning, and blended learning, and found that students in the face-to-face and blended courses were more likely to perform well in the class. Others studying course delivery methods found that students in a flipped-hybrid class performed better on a common final exam (Haughton and Kelly Citation2015). In the text analysis, this manifested as the repeated appearances of word pairs such as “final exam” and “exam scores.” This suggests that course performance is a primary measure of student success in business statistics. The BSCLEI and ABSI assessments represent a step away from using course performance and toward a more common assessment tool, however, these are relatively new instruments (Nguyen, Newby, and Skordi Citation2015).
Student attitudes toward statistics (“attitudes”) and statistics anxiety (“anxiety”) have received limited attention from business statistics researchers. One study found that international students in particular had higher statistics anxiety related to interpreting results and computing, as well as increased anxiety of asking for help (Bell 1995). However, to the author’s knowledge, there has been little discussion of statistics anxiety and attitudes since then.
3.3 Statistics Education in the Health Sciences
Like business instructors, statistics teachers in the health sciences are interested in improving the content and curriculum of their courses (). An interesting theme that emerged in the health statistics literature was a call for “more research;” this idea was expressed in four of the articles reviewed. In a 2011 paper, Epstein and her coauthors review the nursing literature on teaching statistics to undergraduate nursing students. They found that there was little published research related to the pedagogy of statistics—most research at the time was related to student and faculty characteristics, course content, and delivery methods (Epstein et al. Citation2011). Many of these themes are still present in the literature for teaching statistics in the health sciences.
Fig. 3 Qualitative themes and quantitative bigrams for articles in the health sciences.
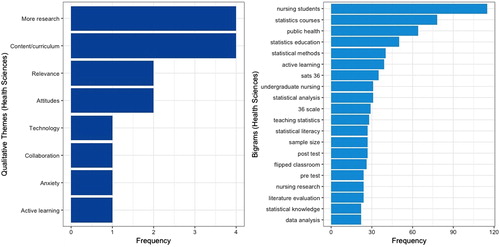
Statistics education research in the health sciences is primarily focused on professional courses, such as courses in a pharmacy program (Overholser and Sowinski Citation2010; Feild et al. Citation2015; Giuliano and Moser Citation2016), clinical and translational sciences (Oster et al. Citation2015), and nursing (Hagen et al. Citation2013a, Citation2013b; Kiekkas et al. Citation2015). Authors are interested in both the teaching and assessment of these courses, as well as considering specializing the content for students in the health sciences.
The bigram “pretest” appeared often in the health literature, suggesting that course assessment using pretests and post-tests occurs frequently in those disciplines. Evaluation of student attitudes in nursing education research often uses a familiar instrument: the SATS-36 Scale (Schau et al. Citation1995). For example, one study found that students exhibited higher affect, difficulty, interest, and effort components from the SATS-36 on post-test, and that there was a weak positive correlation between scores on the SATS-36 and performance on course exams (Kiekkas et al. Citation2015).
Another topic of interest in the health statistics education literature has been statistics anxiety. Hagen’s catchy-titled “Fear and Loathing: Undergraduate Nursing Students’ Experiences of a Mandatory Course in Applied Statistics” showed that many nursing students are scared of taking a statistics course, and that making the course relevant to nursing is one technique that can help alleviate this anxiety (Hagen et al. Citation2013b). Another study by the same author showed that nursing students may prefer several smaller, formative assessments such as low-stakes quizzes, and real-life, hands-on examples (Hagen et al. Citation2013a).
Educators appear to be primarily interested in developing students’ “statistical literacy” skills, and often describe using “active learning” or “flipped classrooms” as a technique for success (Hagen et al. Citation2013a, Citation2013b; Giuliano and Moser Citation2016). One author observed an over 10% increase in final exam scores after transitioning to a flipped course structure for pharmacy students in 2014 (Giuliano and Moser Citation2016). Applications are considered essential for increasing student confidence and ability to interpret statistics in the medical literature (Feild et al. Citation2015). Hayat (Citation2014) provided recommendations for integrating the GAISE College Report into statistics courses for nursing students, including applications using real data, and an emphasis on statistical literacy.
There is some interest in redefining what is covered in statistics courses for pre-health professionals. One article suggested customizing statistics courses to student’s previous knowledge and background, as well as their future needs. They recommend several fundamental competencies: including assessing sources of bias and variation, proposing study designs, describing basic statistical principles and their practical importance, describing concepts and implications of reliability and validity, communicating research findings, describing effect size with a measure of precision, describing the study sample and sampling methods, understanding need for reproducible research, and understanding appropriate methods of data presentation. For each competency, they rate its importance based on course and career goals using a survey of n = 18 statisticians (Oster et al. Citation2015). Another described the course development process of a first year biostatistics course, and assessment of the course using student evaluations (Overholser and Sowinski Citation2010).
3.4 Statistics Education in the Social Sciences
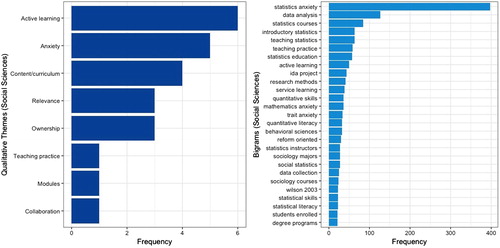
Statistics teachers in the social sciences are primarily interested in studying “statistics anxiety,” including strategies for addressing it, the effects it has on their students, and identifying which students may be most susceptible to it (“trait anxiety”). “Statistics anxiety” was one of the most common bigrams in the text data as shown in , and it is ranked much more highly in the social sciences literature than the other four discipline groups. Five of the articles studied address statistics anxiety directly, and many of the others used it as a motivating factor for their research. In fact, one of the most common word pairs in social science papers is actually a citation. “Wilson 2003” refers to Onwuegbuzie and Wilson’s work, “Statistics Anxiety: Nature, Etiology, Antecedents, Effects, and Treatments—A Comprehensive Review of Literature” (Onwuegbuzie and Wilson Citation2003), a foundational article reviewing research on statistics anxiety in the 1990s and early 2000s. Since then, researchers have worked to understand factors that can lead to increased statistics anxiety. A survey of students in an undergraduate statistics course suggested that procrastination and lower levels of reading ability may also be related to increased statistics anxiety (Chew and Dillon Citation2014). One study found that students from a non-mathematical background struggled more with statistics anxiety. These feelings of anxiety translated into general feelings of inadequacy in the course, as well as physiological symptoms of stress in the students interviewed (Malik Citation2015). Based on student responses to in-person interviews, the author wrote a poem describing a student’s feelings of statistics anxiety.
Fig. 4 Qualitative themes and quantitative bigrams for articles in the social sciences.
Stats-Anxiety Poem (Malik Citation2015, p. 129):
What is stats-anxiety?
[Stats-] anxiety to me is a fight or flight response, when your heart rate goes up and starts feeling the pressure, Fight or flight, I guess that’s the way I describe it and that’s the only way.
Situation(s) that trigger intense feelings of stats-anxiety
Probably the second I get the exam like handed to me, for they are worth more of a proportion of my course grade. The second she hands it to me I start getting all scared and worried, and everything I have learnt kinda goes away right away.
Inability to decode terminology and symbols
I think it is because I’ve never been good with numbers, and the symbols, the Greek letters, and the statistical formulas are all gibberish to me. Unless I get it told repetitiously over and over again because I don’t get it the first time, to understand fully what each letter and so on means; it takes me a second or third time.
Feelings of inadequacy
Ever since I have been an undergraduate, I’ve been feeling inadequate. By inadequate I mean… not fully able to function in math, to the level of a normal undergraduate. I know other people struggle in my class but that’s not enough to, help me with the anxiety and everything else that comes with it. It is definitely a time and grade pressure. I sometimes feel worthless but not usually, No, I do not think that I have low self-esteem, But I just really feel like an idiot.
Physiological symptoms
Whenever I have that panic attack, in that situation my mind goes blank, and I feel my heart racing. Solving a statistical problem, on the other hand to me is, really scary and nothing else. I am scared of getting the problem wrong, at that time it is about the only feeling.
Giving up
I spend more time on stats than any other class. It is sort of irritating that I spend so much time. I want to do well, and I am willing to spend that much time, And when I can’t figure out something, I start crying because I couldn’t figure it out, I put the blame on the class and I feel like dropping.
Factors that reduce stats-anxiety
Having a formula sheet is very helpful, and so is multiple-choice plus a take-home exam. Having a visual makes it easier to process the information. My instructor’s different teaching methods and her willingness to help are comforting.
Another body of research in the social sciences addresses strategies for managing anxiety and the effects statistics anxiety has on students. Some suggestions in the social sciences literature include integrating statistics across the entire curriculum, rather than in a single course (Slootmaeckers, Kerremans, and Adriaensen Citation2014). Other authors note that statistics anxiety may have a positive effect on exam performance, suggesting that statistics anxiety can be a motivating factor for improving student learning (Macher et al. Citation2013). Additional suggestions include using active learning and “monitoring students’ emotions” to improve statistics instruction and reduce anxiety (Macheski et al. Citation2008).
An interesting theme that emerged in the social sciences literature is “ownership”—who should teach statistics courses? The bulk of the literature on teaching statistics in the social sciences suggests that courses should be taught within their disciplines, rather than in a mathematics or statistics department. Common reasons given for ownership of statistics courses are relevance of statistical techniques or applications (“Relevance”) and management of statistics anxiety (“Anxiety”). An association was found in one study between teaching an introductory statistics course within a sociology department and lower levels of statistics anxiety (Delia Deckard Citation2017). Student buy-in is another motivating factor for teaching statistics courses internally. Paxton (Citation2006) claimed that students may not understand why a statistics course is important and recommends a first-day exercise using salary data to motivate learning statistics.
3.5 Statistics Education in STEM
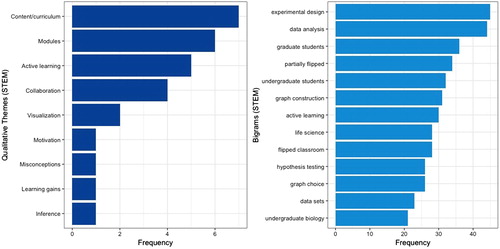
Research in STEM fields tends to be more specialized. Statistics teachers are interested in how to include a specific topic in the statistics curriculum (), such as graphing (“visualization”), data collection (“experimental design”), hypothesis testing (“inference”), or the assessment of that topic (“misconceptions,” “learning gains”).
Fig. 5 Qualitative themes and quantitative bigrams for articles in STEM.
However, one characteristic that is rather unique to the lab sciences is where statistics instruction occurs. Many articles suggest ways to integrate statistical content into an introductory science course, rather than addressing a complete course in statistics. For example, Goldstein and Flynn (Citation2011) suggested introducing hypothesis testing and data collection in lab exercises during an introductory biology course. They wrote,
“… educators have called for greater emphasis on quantitative skills, notably the use and interpretation of statistical tests. Instead of learning quantitative skills in biology courses, many biology students take separate courses in mathematics, statistics, or psychology departments. This separation between biological knowledge and quantitative skill sets often causes students to view these two fields as disconnected…. As a consequence, they do not learn how to correctly apply their mathematical knowledge to solve a scientific problem.” (Goldstein and Flynn Citation2011)
Other authors detail the use of inquiry-based learning about statistics in their biology labs (Metz Citation2008; Thompson et al. Citation2011), illustrating specific examples used in their classrooms. The interpretation of graphs was also of interest, specifically how students and faculty draw conclusions from visual representations of data (Angra and Gardner Citation2017). A recurring recommendation was to use graphs throughout the entire biology curriculum (Taylor Citation2010; Angra and Gardner Citation2017). A single introductory course was not the only avenue explored for introducing statistics: Colon-Berlingeri and Burrowes (Citation2011) described integrating statistics content into genetics and zoology courses, and Remsburg, Harris, and Batzli (Citation2014) taught statistical content in labs through a two-semester biology sequence.
The STEM fields showed the most collaboration (actual and desired) with statisticians (“collaboration”) in designing and teaching statistics courses. There has been a shift for many biology departments away from requiring calculus for their majors in favor of statistics (Cheesman et al. Citation2007). Faculty at the University of Arizona developed a calculus-based statistics course designed specifically for students in the life sciences, with an emphasis on modeling techniques in biology (Watkins Citation2010). Schlotter (Citation2013) suggested taking a critical look at the statistics required for undergraduate chemistry majors and developing courses and modules to better meet those needs. Techniques for integrating statistical content have been described at length; however, there has been relatively little evaluation of the content developed. A team of mathematicians and ecologists developed a set of course modules for teaching mathematical modeling and curve fitting in ecology, however, in post-course interviews they found the modules had no impact on content knowledge or views on integrating mathematics (Vanderklein, Munakata, and McManus Citation2016).
For the STEM disciplines, general course content is a leading topic in the research literature. Articles emphasize the study of “experimental design,” data visualization (“graph construction,” “graph choice”), and classical statistical inference (“hypothesis testing,” “central limit”—nearly always followed by “theorem”). As with the other disciplines, efforts to reform the classroom experience through active learning and flipped classrooms are present. Most discussions of course content are generic—although “hypothesis testing” is mentioned, specific procedures are rarely discussed. Two exceptions are Schlotter (Citation2013) and Remsburg, Harris, and Batzli (Citation2014). Schlotter (Citation2013) outlines topics that should be discussed in the undergraduate chemistry program at the introductory and advanced level. Some topics are typically found in “Stat 101” courses such as the normal distributions (referred to as “Gaussian or random” in the paper), t distribution, mean, standard deviation/variance, best-fit line, t-tests, and regression errors. Others, such as error propagation and the Maxwell distribution are not typically found on a traditional statistics course syllabus. Remsburg, Harris, and Batzli (Citation2014) listed learning outcomes that were part of statistics modules in a biology course. These modules focused on experimental design and data analysis:
Experimental design
Write research hypotheses that explicitly state the variables measured
Assign experimental treatments systematically when a known factor other than the independent variable influences the dependent variable
Consider how well an experiment tests the direct effects of an independent variable
Design experimental replicates that receive equivalent but independently applied experimental conditions
Understand how sample size affects the ability to detect a significant effect when there is variation in the system (signal-to-noise ratio)
Data analysis
Recognize when paired t-tests, independent t-tests, and ANOVAs are useful
Conduct independent t-tests using Excel
Interpret p-values to make appropriate conclusions regarding hypotheses
Make conclusions based on the probability that data support statistical hypotheses
Follow the format of a scientific paper: statistics included in Section 2; test statistic; degrees of freedom; p-values and appropriate graphs reported in Section 3.
4 Discussion and Implications
This analysis of the statistics education literature in client disciplines showed several interesting trends and ideas. Qualitative coding and quantitative bigram analysis yielded similar primary themes and areas of research interest in client disciplines. These research interests have several implications for our own work in statistics education and suggest future needs for collaboration and outreach.
One major idea in the literature revolved around ownership: specifically, which departments should be teaching the introductory statistics course? Opinions were mixed, largely along disciplinary boundaries. In sociology, a survey of professors indicated that a majority of instructors from departments without a statistics course believed their students would benefit (and even prefer!) taking “statistics as a sociology course” (Delia Deckard Citation2017). The author of this study continues on to say:
“When possible, undergraduate sociology majors should be introduced to statistics in the sociology department. When resources make this possible, collaborative efforts in interdepartmental centers should be pursued as a superior option to turning over statistics education to other departments.” (Delia Deckard Citation2017)
These opinions are not unique to social scientists. Instructors of statistics in the STEM fields also commented on the unique needs of their students.
“Even when students take a statistics course in the mathematics department, it does not address many of the needs of chemistry majors [emphasis added]…. When the chemistry students take statistics courses in other departments, such as from a business or psychology program, they get a different course aimed at the statistics of large discrete data sets that do not address the needs of the undergraduate chemistry major very well.” (Schlotter Citation2013)
Statistics educators interested in teaching students in client disciplines may face some resistance. Discussions with experts in those disciplines about the specific needs of their students are important to building trust and collaboration across disciplinary boundaries.
In many disciplines, there is some debate about what statistical content should be delivered, and where it should fall in the curriculum. A common suggestion in STEM fields is to incorporate statistical content into existing courses, rather than requiring a stand-alone course (Taylor Citation2010; Remsburg, Harris, and Batzli Citation2014). One common suggestion is incorporating “modules” into lab activities (Overholser and Sowinski Citation2010; Schlotter Citation2013) rather than teaching statistical content during lecture. This gives additional relevance to the statistical procedures or techniques being applied, as well as introducing active learning techniques. Within the client disciplines, there seems to be little discussion on what a consensus curriculum might look like, as there has been in the statistics education community. Research into what topics should be taught, and to whom, could help inform future curriculum design and learning interventions.
One interesting theme that emerged was the perception among students that their discipline-based statistics course was not a “real stats course.” Hagen et al. (Citation2013b) writes,
“…students were somehow aware that because they hadn’t taken a ‘scary’ statistics course focusing on formulas and numbers, that the course might not be seen as a legitimate course in statistics, despite the fact that they could articulate both the significant benefits from taking an applied statistics course.” (Hagen et al. Citation2013b)
This mirrors previous research in statistics education about statistical literacy, namely the idea of “statistical consumers” versus “statistical producers” (Gould Citation2010; Tishkovskaya and Lancaster Citation2012). As a community statistics education has largely shifted away from the computational approach to statistics to promoting critical thinking and stressing conceptual understanding (Carver et al. Citation2016; Hedges and Harkness Citation2017), however, that change in thinking and practice appears to be somewhat limited compared to the rest of the curriculum. The perception of a discipline-based statistics course as “baby stats,” especially one that stresses conceptual understanding and application, suggests that the stereotype of statistics as a collection of formulas to be applied still exists university wide. Statistics anxiety is a common motivating factor for statistics education researchers in client disciplines, especially in the social sciences. Much of the research revolves around estimating how many students suffer from statistics anxiety, and to what degree. (DeCesare Citation2007) estimated that 56.2% of students in a social statistics course felt “anxious” or “very anxious” about taking statistics. Some authors have noted an “assessment” problem in statistics anxiety research. More specifically, there seems to be a lack of differentiation between student attitudes toward statistics and anxiety about statistics (Chew and Dillon Citation2014). Some techniques that have been employed in the statistics community to reduce statistics anxiety, such as using humor (Neumann, Hood, and Neumann Citation2009), improving training for GTAs teaching statistics courses or recitations (Parker et al. Citation2017), and incorporating active and service learning experiences (Carlson and Winquist Citation2011; Henrich and Lee Citation2011), might be easily implemented in client disciplines and effective tools for improving instruction.
Readers familiar with the statistics education literature may have noticed that there has been, to this point, little discussion of “reform-oriented pedagogies” and newer ideas in statistics education, such as simulation-based inference, multivariable modeling, data science, and the GAISE Recommendations. With two exceptions, the GAISE Recommendations were not explicitly mentioned or discussed in any of the articles reviewed. Many of the ideas in the GAISE Report are discussed—active learning, working with real data, incorporating meaningful assessment—however, these recommendations mirror current trends in collegiate education overall. Ideas more unique to statistics education such as emphasizing statistical and multivariate thinking are absent.
Simulation-based inference is another topic missing from the statistics education literature outside of statistics. (Carsey and Harden Citation2015) discuss using Monte Carlo simulation in a graduate level quantitative skills course for political science, however, none of the articles studied discussed simulation in undergraduate courses. Part of this may be due to the relative newness of this curriculum style, however, it appears that, for now, statistics instruction in other disciplines relies on more traditional curricula.
However, one contribution of the statistics education literature that has begun to spread to other disciplines is the use of assessment data in making evidence-based curricular decisions. The Student Attitudes Toward Statistics, or “SATS-36” scale (Schau et al. Citation1995) has become a popular tool for measuring student attitudes toward statistics (Slootmaeckers, Kerremans, and Adriaensen Citation2014; Kiekkas et al. Citation2015). Discipline-based assessments of statistical knowledge have also been introduced recently, such as the Biostatistics and Clinical Epidemiology Skills (BACES) assessment for medical residents (Barlow et al. Citation2015). Other statistics knowledge assessment tools such as the Comprehensive Assessment of Outcomes in a First Statistics course, or “CAOS” test (DelMas et al. Citation2007) are absent from the discipline-based literature. This suggests that researchers may be more interested in student attitudes toward statistics than knowledge about statistics, or simply that they are not aware of existing assessment instruments.
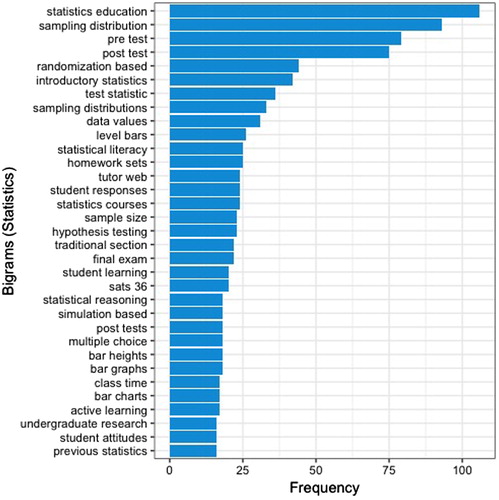
A limitation of this study is the use of published research as a primary data source. Journal articles are one representation of a research community, but they are not the only way ideas are disseminated. Blog posts, conference talks, webinars, and workshops are all possible avenues for sharing research ideas and are not represented in this work. To get a better idea of how representative bigram analysis might be of the relevant trends in a body of literature, a random sample was taken of twenty articles published in the Journal of Statistics Education between 2015–2018 (). Familiar areas of statistics education research such as simulation-based inference (“randomization based, “simulation based,” “hypothesis testing”), studying student understanding of difficult concepts (“sampling distribution,” “sampling distributions,” “hypothesis testing”), implementing GAISE Recommendations (“statistical reasoning,” “active learning,” “statistical literacy”), and assessment (“pretest,” “post-test,” “sats 36”) are frequent terms in the text data. This suggests that while text analysis of research articles is not a perfect representation of research trends, it can identify some of the major themes expected in a body of literature.
Fig. 6 Quantitative bigrams for a random sample of articles published in JSE (2015–2018).
Another limitation of using published research is the discussion of course content. With the exception of the STEM disciplines, course content was not usually a primary focus of discussion. When it was included, content was described in very generic terms. For example, several articles suggested teaching hypothesis tests in introductory psychology, and business courses—but which ones and to what level of detail was never mentioned. A possible direction for future research in the specific learning objectives and content areas within discipline-based statistics courses, and how they differ from the consensus curriculum in statistics education ().
This article has highlighted some of the major differences in statistics instruction and statistics education research across the university. There are clear differences in research priorities, and much work can be done to establish better disciplinary cooperation in statistics education. As the demand for courses in statistics and data science grows, especially beyond the introductory level, capacity to teach these courses will become a problem (and for many institutions, already has). Instruction in statistics will continue to expand across the university, not just in mathematics and statistics departments. Collaboration with other professionals is the best way to increase our capacity to improve statistics education across the curriculum.
Professional societies are a good starting resource for identifying the statistical needs of other disciplines. The National Research Council’s BIO2010: Transforming Undergraduate Education for Future Research Biologists (2010) Report states that “it is essential that biology undergraduates become quantitatively literate.” BIO2010 recommends programs in biology include probability and statistics and creating new courses that cover the necessary mathematical and statistical content in context of biology applications. The American Sociology Association also recommends including a required course in statistical analysis as a part of the sociology major (Pike et al. Citation2017). This course should include standard methods of statistical inference (chi-square tests, difference of means tests, etc.), as well as some multivariable applications. Neither report mentions best practices for teaching statistics, however, merely that statistics should be included in the curriculum.
There have been many changes and improvements in the teaching, curriculum, and assessment of introductory statistics in the last 30 years, however, this review suggests that these changes have not yet permeated through the entire breadth of statistics courses. Increased outreach and collaboration with statistics instructors in client disciplines can help meet the needs of the entire statistics student population, not just those taking our own courses. Some possible models for cooperation are (1) creating a Faculty Learning Community or other local network, (2) joining an interdisciplinary network, or (3) holding informal discussions about course content at the local level.
A possible method for increasing faculty engagement and collaboration in statistics education across the curriculum is creating a Faculty Learning Community (Parker et al. Citation2016). Faculty Learning Communities (FLCs) were formed annually for four years to investigate active learning pedagogies, learning and memory techniques, instructional design and assessment, and statistics education with the goal of improving and increasing statistics education in the life sciences. Based on pre-post assessments, participating faculty from the life sciences demonstrated increased knowledge and comfort teaching statistical concepts. Additionally, faculty participants from statistics reported increased knowledge about context used in life science courses. Another current effort with promise for linking statistics educators with faculty in client discipline is the Statistical Thinking in Undergraduate Biology, or STUB Network (https://www.causeweb.org/stub/). This new initiative is bringing together statisticians and biologists to create lab activities and other course content that can be used in courses in either discipline.
Institutional cooperation can be effective, but change can be implemented at a smaller level. At the author’s university, members of the Biology department and Mathematics department have been active partners in redesigning courses in biostatistics. Historically two courses have been offered: MATH XXX: Probability and Statistics in the Health Sciences and BIO XXX: Biostatistics. These courses cover the same essential content and serve similar student populations. In Summer 2017, faculty teaching these courses began meeting to discuss redesigning and standardizing the courses to include active learning, authentic experiences analyzing data using R, and a common set of statistical techniques, with the eventual goal of cross-listing the courses. Both courses have benefitted from these conversations, and students have responded favorably to the redesign.
This article provided a general introduction to the state of statistics instruction across the university, however, there is still work to do to understand how statistics is taught and how statistics educators can contribute to improved instruction university wide. Future work in this area could survey instructors in other disciplines directly, or review workshop and conference abstract content to further explore research trends in other departments. Additionally, there is little concrete data on who is teaching statistics, and to whom, and a comprehensive study of students taking statistics would better highlight areas for future collaboration between statisticians and non-statisticians.
Acknowledgments
The author wishes to thank the editorial team of JSE and two anonymous reviewers for valuable suggestions on a previous version of this article.
References
- Aliaga, M., Cobb, G., Cuff, C., Garfield, J., Gould, R., Lock, R., Moore, T., Rossman, A., Stephenson, B., Utts, J., Velleman, P., and Witmer, J. (2005), “GAISE College Report,” American Statistical Association.
- Angra, A., and Gardner, S. M. (2017), “Reflecting on Graphs: Attributes of Graph Choice and Construction Practices in Biology,” CBE Life Sciences Education, 16, 1–15, DOI: 10.1187/cbe.16-08-0245.
- Barlow, P. B., Skolits, G., Heidel, R. E., Metheny, W., and Smith, T. L. (2015), “Development of the Biostatistics and Clinical Epidemiology Skills (BACES) Assessment for Medical Residents,” Postgraduate Medical Journal, 91, 423–430, DOI: 10.1136/postgradmedj-2014-133197.
- Becker, W. E., and Greene, W. H. (2001), “Teaching Statistics and Econometrics to Undergraduates,” Journal of Economic Perspectives, 15, 169–182. DOI: 10.1257/jep.15.4.169.
- Carlin, J. B. (2016), “Comment: Is Reform Possible Without a Paradigm Shift?,” The American Statistician, 1. DOI: 10.1080/00031305.2016.1154108.
- Carlson, K., and Winquist, J. (2011), “Evaluating an Active Learning Approach to Teaching Introductory Statistics: A Classroom Workbook Approach,” Journal of Statistics Education, 19, 1–23. DOI: 10.1080/10691898.2011.11889596.
- Carsey, T. M., and Harden, J. J. (2015), “Can You Repeat That Please? Using Monte Carlo Simulation in Graduate Quantitative Research Methods Classes,” Journal of Political Science Education, 11, 94–107, DOI: 10.1080/15512169.2014.998093.
- Carver, R. H., Everson, M. G., Gabrosek, J., Horton, N., Lock, R., Mocko, M., Rossman, A., Roswell, G. H., Velleman, P., Witmer, J., and Wood, B. (2016), “Guidelines for Assessment and Instruction in Statistics Education: College Report,” American Statistical Association.
- Case, C., Battles, M., and Jacobbe, T. (2019), “Toward an Understanding of p-Values: Simulation-Based Inference in a Traditional Statistics Course,” Investigations in Mathematics Learning, 11, 195–206, DOI: 10.1080/19477503.2018.1438869.
- Charmaz, K. (2006), Constructing Grounded Theory: A Practical Guide Through Qualitative Analysis, London: SAGE Publications.
- Cheesman, K., French, D., Cheesman, I., Swails, N., and Thomas, J. (2007), “Is There Any Common Curriculum for Undergraduate Biology Majors in the 21st Century?,” BioScience, 57, 516–522. DOI: 10.1641/B570609.
- Chew, P. K. H., and Dillon, D. B. (2014), “Statistics Anxiety Update: Refining the Construct and Recommendations for a New Research Agenda,” Perspectives on Psychological Science, 9, 196–208, DOI: 10.1177/1745691613518077.
- Cobb, G. (1993), “Teaching Statistics,” in Heeding the Call for Change, MAA Notes No. 22, ed. L. Steen, Washington, DC: Mathematical Association of America, pp. 3–34.
- Colon-Berlingeri, M., and Burrowes, P. A. (2011), “Teaching biology through statistics: Application of statistical methods in genetics and zoology courses,” CBE Life Sciences Education, 10(3), 259–267. DOI: 10.1187/cbe.10-11-0137.
- DeCesare, M. (2007), “Statistics Anxiety” Among Sociology Majors: A First Diagnosis and Some Treatment Options,” Teaching Sociology, 35, 360–367. DOI: 10.1177/0092055X0703500405.
- Delia Deckard, N. M. (2017), “Statistics Education for Undergraduate Sociology Majors: Survey Findings Across Institutions,” Numeracy, 10, 8, DOI: 10.5038/1936-4660.10.2.8.
- DelMas, R. C., Garfield, J. B., Ooms, A., and Chance, B. L. (2007), “Assessing Students’ Conceptual Understanding After a First Course in Statistics,” Statistics Education Research Journal, 6, 28–58.
- Doehler, K., Taylor, L., and Smith, J. (2013), “A Study of Faculty Views of Statistics and Student Preparation Beyond an Introductory Class,” Journal of Statistics Education, 21, 1–21, 11889657. DOI: 10.1080/10691898.2013.
- Epstein, I., Mina, E. E. S., Gaudet, J., Singh, M. D., and Gula, T. (2011), “Teaching Statistics to Undergraduate Nursing Students: An Integrative Review to Inform Our Pedagogy,” International Journal of Nursing Education Scholarship, 8(1), 1–17. DOI: 10.2202/1548-923X.2234.
- Feild, C., Belgado, B., Dougherty, J., Doering, P., and Gong, Y. (2015), “The Use of Application-Based Learning Techniques in a College of Pharmacy-Based Biostatistics Course,” Currents in Pharmacy Teaching and Learning, 7, 599–605, DOI: 10.1016/j.cptl.2015.06.021.
- Garfield, J., Hogg, B., Schau, C., and Whittinghill, D. (2002), “First Courses in Statistical Science: The Status of Educational Reform Efforts,” Journal of Statistics Education, 10(2), 1–14. DOI: 10.1080/10691898.2002.11910665.
- Giuliano, C. A., and Moser, L. R. (2016), “Evaluation of a Flipped Drug Literature Evaluation Course,” American Journal of Pharmaceutical Education, 80, 66, DOI: 10.5688/ajpe80466.
- Goldstein, J., and Flynn, D. F. B. (2011), “Integrating Active Learning & Quantitative Skills Into Undergraduate Introductory Biology Curricula,” The American Biology Teacher, 73, 454–461, DOI: 10.1525/abt.2011.73.8.6.
- Gould, R. (2010), “Statistics and the Modern Student,” International Statistical Review, 78, 297–315, DOI: 10.1111/j.1751-5823.2010.00117.x.
- Hagen, B., Awosoga, O., Kellett, P., and Dei, S. O. (2013), “Evaluation of Undergraduate Nursing Students’ Attitudes Towards Statistics Courses, Before and After a Course in Applied Statistics,” Nurse Education Today, 33, 949–955, DOI: 10.1016/j.nedt.2012.11.005.
- Hagen, B., Awosoga, O. A., Kellett, P., and Damgaard, M. (2013), “Fear and Loathing: Undergraduate Nursing Students’ Experiences of a Mandatory Course in Applied Statistics,” International Journal of Nursing Education Scholarship, 10, 27–34, DOI: 10.1515/ijnes-2012-0044.
- Haughton, J., and Kelly, A. (2015), “Student Performance in an Introductory Business Statistics Course: Does Delivery Mode Matter?,” Journal of Education for Business, 90, 31–43, DOI: 10.1080/08832323.2014.968518.
- Hayat, M. (2014), “Guidelines for Assessment and Instruction in Statistics Education (GAISE): Extending GAISE Into Nursing Education,” Journal of Nursing Education, 53, 192–198. DOI: 10.3928/01484834-20140325-01.
- Hedges, S., and Harkness, S. S. (2017), “Is GAISE Evident? College Students’ Perceptions of Statistics Classes as ‘Almost Not Math’,” Statistics Education Research Journal, 16, 337–356.
- Henrich, A., and Lee, K. (2011), “Reducing Math Anxiety: Findings From Incorporating Service Learning Into a Quantitative Reasoning Course at Seattle University,” Numeracy, 4, 9, DOI: 10.5038/1936-4660.4.2.9.
- Hildreth, L. A., Robison-Cox, J., and Schmidt, J. (2018), “Comparing Student Success and Understanding in Introductory Statistics Under Consensus and Simulation-Based Curricula,” Statistics Education Research Journal, 17, 103–120.
- Kiekkas, P., Panagiotarou, A., Malja, A., Tahirai, D., Zykai, R., Bakalis, N., and Stefanopoulos, N. (2015), “Nursing Students’ Attitudes Toward Statistics: Effect of a Biostatistics Course and Association With Examination Performance,” Nurse Education Today, 35, 1283–1288, DOI: 10.1016/j.nedt.2015.07.005.
- Lachal, J., Revah-Levy, A., Orri, M., and Moro, M. R. (2017), “Metasynthesis: An Original Method to Synthesize Qualitative Literature in Psychiatry,” Frontiers in Psychiatry, 8, 269, DOI: 10.3389/fpsyt.2017.00269.
- Macher, D., Paechter, M., Papousek, I., Ruggeri, K., Freudenthaler, H. H., and Arendasy, M. (2013), “Statistics Anxiety, State Anxiety During an Examination, and Academic Achievement,” British Journal of Educational Psychology, 83, 535–549, DOI: 10.1111/j.2044-8279.2012.02081.x.
- Macheski, G. E., Lowney, K. S., Buhrmann, J., and Bush, M. E. L. (2008), “Overcoming Student Disengagement and Anxiety in Theory, Methods, and Statistics Courses by Building a Community of Learners,” Teaching Sociology, 36, 42–48. DOI: 10.1177/0092055X0803600106.
- Malik, S. (2015), “Undergraduates’ Statistics Anxiety: A Phenomenological Study,” The Qualitative Report, 20, 120–133.
- Martin, L. R. (2011), “Teaching Business Statistics in a Computer Lab: Benefit or Distraction?,” Journal of Education for Business, 86, 326–331, DOI: 10.1080/08832323.2010.529958.
- Maurer, K., and Lock, D. (2016), “Comparison of Learning Outcomes for Simulation-Based and Traditional Inference Curricula in a Designed Educational Experiment,” Technology Innovations in Statistics Education, 9, 1–20. DOI: 10.5811/westjem.2011.5.6700.
- McAlevey, L., Everett, A., and Sullivan, C. (2001), “Evolution in Business Statistics Curricula: Learning From the “Making Statistics More Effective in Schools of Business” Conference,” Journal of the Royal Statistical Society, Series D, 50(3), 321–333. DOI: 10.1111/1467-9884.00281.
- McKenzie, J. (1996), “Required and Elective Statistics Courses for MBA Students,” in 11th Annual Conference Making Statistics Effective in Schools of Business, Anchorage.
- McLauchlan, C., and Schonlau, M. (2017), “Statistical Literacy in the Classroom: Should Introductory Statistics Courses Rethink their Goals?,” Statistics, Politics and Policy, 7, 99–115, DOI: 10.1515/spp-2017-0001.
- McShane, B. B., and Gal, D. (2016), “Blinding Us to the Obvious? The Effect of Statistical Training on the Evaluation of Evidence,” Management Science, 62, 1707–1718, DOI: 10.1287/mnsc.2015.2212.
- Metz, A. M. (2008), “Teaching statistics in biology: Using inquiry-based learning to strengthen understanding of statistical analysis in biology laboratory courses,” CBE Life Sciences Education. DOI: 10.1187/cbe.07-07-0046.
- Neumann, D. L., Hood, M., and Neumann, M. M. (2009), “Statistics? You Must Be Joking: The Application and Evaluation of Humor When Teaching Statistics,” Journal of Statistics Education, 17, 1–16. DOI: 10.1080/10691898.2009.11889525.
- Nguyen, T. H., Newby, M., and Skordi, P. G. (2015), “Development and Use of an Instrument to Measure Students’ Perceptions of a Business Statistics Learning Environment in Higher Education,” Learning Environments Research, 18, 409–424, DOI: 10.1007/s10984-015-9192-3.
- Nonis, S. A., and Hudson, G. I. (1999), “The Second Course in Business Statistics and Its Role in Undergraduate Marketing Education,” Journal of Marketing Education, 21, 232–241, DOI: 10.1177/0273475399213008.
- Onwuegbuzie, A. J., and Wilson, V. A. (2003), “Statistics Anxiety: Nature, Etiology, Antecedents, Effects, and Treatments—A Comprehensive Review of Literature,” Teaching in Higher Education, 8, 195–209. DOI: 10.1080/1356251032000052447.
- Oster, R. A., Lindsell, C. J., Welty, L. J., Mazumdar, M., Thurston, S. W., Rahbar, M. H., Carter, R. E., Pollock, B. H., Cucchiara, A. J., Kopras, E. J., Jovanovic, B. D., and Enders, F. T. (2015), “Assessing Statistical Competencies in Clinical and Translational Science Education: One Size Does Not Fit All,” Clinical and Translational Science, 8, 32–42, DOI: 10.1111/cts.12204.
- Overholser, B. R., and Sowinski, K. M. (2010), “Development and Student Evaluation of an Introductory Biostatistics Course as a Required Course in the Doctor of Pharmacy Curriculum,” Currents in Pharmacy Teaching and Learning, 2, 171–179, DOI: 10.1016/j.cptl.2010.04.006.
- Palocsay, S. W., and Stevens, S. P. (2008), “A Study of the Effectiveness of Web-Based Homework in Teaching Undergraduate Business Statistics,” Decision Sciences Journal of Innovative Education, 6, 213–232, DOI: 10.1111/j.1540-4609.2008.00167.x.
- Parker, L. C., Gleichsner, A. M., Adedokun, O. A., and Forney, J. (2016), “Targeting change: Assessing a Faculty Learning Community Focused on Increasing Statistics Content in Life Science Curricula,” Biochemistry and Molecular Biology Education, 44, 517–525, DOI: 10.1002/bmb.20974.
- Parker, N., Fry, E., Garfield, J., and Zieffler, A. (2017), “Graduate Teaching Assistants’ Beliefs, Practices, and Preparation for Teaching Introductory Statistics,” Statistics Education Research Journal, 16, 294–319.
- Paxton, P. (2006), “Dollars and Sense: Convincing Students That They Can Learn and Want to Learn Statistics,” Teaching Sociology, 34, 65–70. DOI: 10.1177/0092055X0603400106.
- Phelps, A. L., and Szabat, K. A. (2017), “The Current Landscape of Teaching Analytics to Business Students at Institutions of Higher Education: Who Is Teaching What?,” The American Statistician, 71, 155–161, DOI: 10.1080/00031305.2016.1277160.
- Pike, D. L., Ciabattari, T., Messineo, M., Monson, R. A., Salam, R. A., Wagenaar, T. C., Chin, J., Ferguson, S. J., Weigers Vitullo, M., Archer, P., Atkinson, M. P., Ballantine, J. H., Calhoun, T. C., England, P., Erickson, R. J., Hunt, A. N., Lowney, K. S., Maurer, S. B., Senter, M. S., and Sweet, S. (2017), The Sociology Major in the Changing Landscape of Higher Education: Curriculum, Careers, and Online Learning, Washington, DC: American Sociological Association.
- Remsburg, A. J., Harris, M. A., and Batzli, J. M. (2014), “Statistics Across the Curriculum Using an Iterative, Interactive Approach in an Inquiry-Based Lab Sequence,” Journal of College Science Teaching, 44(2), 72–81. DOI: 10.2505/4/jcst14_044_02_72.
- Schau, C., Stevens, J., Dauphinee, T. L., and Del Vecchio, A. (1995), “The Development and Validation of the Survey of Attitudes Toward Statistics,” Educational and Psychological Measurement, 55, 868– 875. DOI: 10.1177/0013164495055005022.
- Schlotter, N. E. (2013), “A Statistics Curriculum for the Undergraduate Chemistry Major,” Journal of Chemical Education, 90, 51–55, DOI: 10.1021/ed300334e.
- Silge, J., and Robinson, D. (2016), “tidytext: Text Mining and Analysis Using Tidy Data Principles in R,” The Journal of Open Source Software, 1, 37, DOI: 10.21105/joss.00037.
- Slootmaeckers, K., Kerremans, B., and Adriaensen, J. (2014), “Too Afraid to Learn: Attitudes Towards Statistics as a Barrier to Learning Statistics and to Acquiring Quantitative Skills,” Politics, 34, 191–200, DOI: 10.1111/1467-9256.12042.
- Strauss, A., and Corbin, J. (1998), Basics of Qualitative Research: Techniques and Procedures for Developing Grounded Theory (2nd ed.), Thousand Oaks, CA, US: Sage Publications, Inc.
- Taylor, M. F. (2010), “Making Biology Teaching More “Graphic,” The American Biology Teacher, 72, 568–570, DOI: 10.1525/abt.2010.72.9.9.
- Thompson, E. D., Bowling, B. V., Whitson, M., and Naczi, R. F. (2011), “Engaging Students in Natural Variation in the Introductory Biology Laboratory via a Statistics-based Inquiry Approach,” The American Biology Teacher, 73, 100–104, DOI: 10.1525/abt.2011.73.2.8.
- Tintle, N., Chance, B., Cobb, G., Roy, S., Swanson, T., and VanderStoep, J. (2015), “Combating Anti-Statistical Thinking Using Simulation-Based Methods Throughout the Undergraduate Curriculum,” The American Statistician, 69, 362–370, DOI: 10.1080/00031305.2015.1081619.
- Tishkovskaya, S., and Lancaster, G. (2012), “Statistical Education in the 21st Century: A Review of Challenges, Teaching Innovations and Strategies for Reform,” Journal of Statistics Education, 20, 1–4. DOI: 10.1080/10810730150501413.
- Trafimow, D., and Marks, M. (2015), “Editorial,” Basic and Applied Social Psychology, 37, 1–2, DOI: 10.1080/01973533.2015.1012991.
- Vanderklein, D., Munakata, M., and McManus, J. (2016), “Crossing Boundaries in Undergraduate Biology Education,” Journal of College Science Teaching, 45, 41–47. DOI: 10.2505/4/jcst16_045_03_41.
- Wasserstein, R. L., and Lazar, N. A. (2016), “The ASA’s Statement on p-Values: Context, Process, and Purpose,” The American Statistician, 70, 129–133, DOI: 10.1080/00031305.2016.1154108.
- Watkins, J. C. (2010), “On a Calculus-based Statistics Course for Life Science Students,” CBE—Life Sciences Education, 9, 298–310, DOI: 10.1187/cbe.10.
- White, P., and Gorard, S. (2017), “Against Inferential Statistics: How and Why Current Statistics Teaching Gets It Wrong,” Statistics Education Research Journal, 16, 55–65.