Abstract
As the demand for skilled data scientists has grown, university level statistics and data science courses have become more rigorous in training students to understand and utilize the tools that their future careers will likely require. However, the mechanisms to assess students’ use of these tools while they are learning to use them are not well defined. As such, a framework to assess statistical computing actions was created. Using task-based interviews of students who completed a second course in statistics, the framework was used to determine the ways in which students utilize statistical computing tools, specifically R, while going through problem solving phases. Patterns that emerged are discussed. Supplementary materials for this article are available online.
1 Introduction
Moore (Citation1997) defined two groups of tools that are used in statistics: those that are meant to help learn statistics and those that are meant for doing statistics. Software such as TinkerPlots, Fathom, CODAP, and StatCrunch are examples of those meant for learning statistics. R, Julia, and Python are examples of tools meant for doing statistics (McNamara Citation2016). Extensive research has been conducted on designing curricula to teach students when interacting with tools meant for learning statistics, and how to assess students’ thinking and interaction with these tools (Ben-Zvi Citation2006; delMas, Garfield, and Zieffler Citation2014; Lee et al. Citation2014).
With the advancement of data science education, many instructors and field experts have designed successful curricula that utilize tools meant for doing statistics such as R, Julia, and Python (e.g., Nolan and Temple Lang Citation2010; Chance et al. Citation2014; Horton, Baumer, and Wickham Citation2014; Pruim, Kaplan, and Horton Citation2014). In fact, a recent study suggests that utilizing statistical software packages (beyond Excel and calculators) for doing work with data and statistics is a critical learning outcome across undergraduate disciplines to develop students’ data acumen (Bargagliotti et al. Citation2020). However, the research on how to assess students’ thinking and interaction with these tools is not as evolved as the research that has been conducted on students’ thinking with statistical learning tools (e.g., TinkerPlots, Fathom, CODAP, StatCrunch).
The study described herein was conducted to test a framework created from both statistics and computing literature for understanding and assessing the actions students take while using statistical computing tools to help solve statistical problems. There are three major goals of this article:
Present a framework that can be used to assess students’ actions while interacting with statistical computing tools.
Use data from task-based interviews to determine if, how, and when students are using the actions defined in the framework when solving statistical problems.
Identify statistical computing actions that help lead students toward higher levels of computational sophistication.
2 Statistical Computing Framework
As Bargagliotti et al. (Citation2020) have pointed out, employing technology tools is essential in undergraduate experiences in data science and statistics. From their research, they suggested two learning outcomes specifically related to statistical computing tools (p. 204, Table 8).
Students use current statistical software or statistical packages that are appropriate to the discipline and context beyond basic Excel or a calculator to manage data, extract information from data, and carry out statistical analyses with data.
Students write a program (using a programing language) to manage and curate data by finding, managing, analyzing data, or extracting information from the data.
Assessment of students’ work with statistical computing tools has been largely limited to whether students complete tasks with the tools and the responses they give with the output they have produced. For us to better understand what our students know in relation to those above learning objectives, we need to move beyond grading what students have done to how they are using the statistical computing tools.
Our first goal was to develop a framework to describe the actions one could take while utilizing statistical computing tools, thus making them statistical computing actions. These actions were identified through various sources in the computing and statistics literature (Wing Citation2006; Brown and Kass Citation2009; Nolan and Temple Lang Citation2010; International Society for Technology in Education; Computer Science Teachers Association Citation2011; Biehler et al. Citation2012; Baglin Citation2013; Wolfram Citation2016), and were organized to create the proposed framework in . Our synthesis of the literature resulted in four categories of potential statistical computing actions: (1) automation of computational procedures, (2) computational thinking, (3) utilizing new methods, and (4) pattern recognition and decision making. These categories are summarized in , with more detailed information about the development of each category following.
Table 1 Framework for identifying statistical computing actions in student’s work.
2.1 Automation of Computational Procedures
Automation of calculations and graphing has long been touted as a primary benefit for how technology tools can assist students and teachers in focusing on higher level concepts and problem solving in statistics (e.g., Ben-Zvi Citation2000; Chance et al. Citation2007). One reason researchers support the use of technology in education is that, when used properly, it can automate computational procedures and help to reduce cognitive load (Baglin Citation2013). Cognitive load is defined as the short-term memory resources that are required to complete a task or activity (Kalyuga and Liu Citation2015). The fewer mental resources that are needed, the more likely it is that an individual will be able to complete the task.
There are two types of cognitive load: intrinsic and extraneous. Intrinsic cognitive load is the load that is needed to achieve specific learning goals.
Extraneous cognitive load is the load that is irrelevant to learning and is present only because instruction is designed in a way that requires learners to engage in cognitive processes and activities that are not actually required for acquisition of intended schemas. (Kalyuga and Liu Citation2015, p. 2)
To be able to automate computational procedures, the technology should reduce the intrinsic load on the student while not adding any extraneous load.
When cognitive load is reduced, students are able to focus their extra working memory on being able to understand key statistical concepts. The details of drawing a graph or calculating numbers for an analysis are minimized by the software (Biehler et al. Citation2012). For example, students can more easily explore trends in the data through exploratory data analysis when they are not worried about the nuances of how a graph is constructed (Chance et al. Citation2007). Additionally, students can spend more time interpreting and understanding why the results of a statistical study make sense since they have not spent all their cognitive capacity trying to manually compute the results of that analysis.
However, the criteria to demonstrate automation for computational procedures are not met when there are high levels of extraneous cognitive load and a student needs to spend several minutes understanding the syntax of a command to create a graph or conduct an analysis. This is because the purpose of the technology should be to reduce the burden of extraneous load. In reality, that load is being shifted from having to remember the nuances of creating a graph by hand, to instead having to remember the nuances of coding the technology to create the graph.
2.2 Increased Computational Thinking
The second category of statistical computing actions is computational thinking. Computational thinking is a problem solving process that includes formulating solutions in a way that is logically organized to be conveyed to a computer (International Society for Technology in Education; Computer Science Teachers Association Citation2011; Wolfram Citation2016). This could be broken down into its two parts of formulating a logically organized plan, and being able to implement it.
Additionally, Wing (Citation2006) defined computational thinking as a mixture of mathematical, scientific, and engineering thinking that is not constrained by the bounds of reality. It allows one to think critically and abstractly about real world problems while utilizing the power of the computer to solve problems that might not otherwise have solution strategies in the real world.
As an example of computational thinking, a student may state that they need to build the linear model and then summarize the results to determine if there is a difference between groups. If they could not convey this plan to the statistical software, they would still be demonstrating computational thinking, as they have formulated a computational solution strategy. It would be desirable if they could convey it to the computer as well, but not necessary to meet this criteria.
The criteria to demonstrate computational thinking are not met when a student simply copies the programming actions of their instructor, or a script that they found on the internet without understanding the process behind the steps (Nolan and Temple Lang Citation2010). While this would help a student to convey a solution strategy to the computer and obtain a solution to the problem, the student is not the one thinking about how to logically order their strategy and converse with the computer.
2.3 Utilizing New Methods to Explore Concepts
The third statistical computing action that was identified was whether students utilize new methods to explore concepts. In using this action, students are not just repeating processes shown to them by their instructor. They can address a new problem by using a set of tools that fit their conceptual understanding of the problem.
Computers are continuously becoming more powerful, which opens the door to alternate techniques to solving problems that have been unavailable in the past. This lends itself to the third statistical computing action. For example, using simulation-based methods used to be relatively computationally expensive and intensive; however with pedagogical and computational advancement, it has become a popular and effective teaching technique in statistics classrooms (delMas, Garfield, and Chance Citation1999; Holcomb et al. Citation2010; Lane-Getaz Citation2010; Tintle et al. Citation2011; Garfield, delMas, and Zieffler Citation2012).
While the technology may provide the resources to support new methods, students may become overcome with the amount of material and the number of methods there are to solve problems (Witmer Citation2016). Due to the almost limitless amount of material on the internet, searching for new methods can become overwhelming to students. Thus, a key criterion of utilizing new methods is being able to parse the information in a search and be able to make sense of any materials and methods that are being adopted by the student.
2.4 Recognizing Patterns and Making Decisions
The final statistical computing action identified through the literature is being able to recognize patterns and make decisions based on the patterns that are identified. In regards to statistics, this could refer to actions taken in the statistical computing process. According to Nolan and Temple Lang (Citation2010), statistical computing is an interactive process where each step is determined by the information gained from previous steps of that process. As users of statistical computing tools, it is our job to make sense of data by finding patterns in our output and determining what steps to take next in the statistical decision making process.
In regards to computing, pattern recognition and decision making could refer to understanding the logical connections between different software or knowing which software might be best for specific actions that need to be taken in an analysis. Nolan and Temple Lang (Citation2010) argued that the main goal in teaching programming is for students to be able to extract concepts from a specific problem and transfer concepts to the specifics of other languages and environments. When programming languages are taught together, students can see the patterns that emerge between them and get a better understanding of programming as a general concept instead of the idiosyncrasies of individual languages.
Brown and Kass (Citation2009) claimed that success in statistics requires that students have adaptable strategies for solving problems. However, our students have a tendency to “attack problems using blunt instruments and naïve attitudes” (p. 105). By teaching statistical computing to our students, we hopefully give them sharp tools and the knowledge of when to use them.
3 Problem Solving With Statistical Computing
The second goal of this article was to use information from task-based interviews to determine if, how, and when students are using the actions defined in the framework, when solving statistical problems. If they are not using the statistical computing actions, how does this affect their ability to solve these problems? To understand this better, it was helpful to use a structure of phases of problem solving.
Several authors have proposed methods for problem solving structures, but for the purposes of this study we began with the structure created by Lee and Hollebrands (Citation2006) based on the work of Schoenfeld (Citation1985). The phases in this structure include analysis, planning, implementation, assessment, verification, and organization. During analysis of the students’ work in this study, a seventh phase of problem solving emerged–research. While these types of problem solving activities were initially thought of as planning, it became clear that in the context of statistical problem solving with computational tools, there was considerable research students were doing to gather information they could use to inform their work. Thus, we added the research phase and its definition to the problem solving descriptions from Lee and Hollebrands. Summaries of these phases can be found in . It is important to note that the phases do not occur in any set order, and it is expected that students may revisit phases throughout their problem solving.
Table 2 Problem solving phases.
4 Methods
To determine how statistical computing is used to aid in problem solving, a small-scale, IRB approved, qualitative research study was conducted.
4.1 Setting
Participants for this study came from a small private women’s college in the southeastern United States who took a second course in statistics during the fall semester of 2016. This course is a continuation of introductory statistics. It includes topics of one- and two-sample inference, two-way tables, simple and multiple linear regression and one and two factor ANOVA. Students were also taught introductory statistical computing practices in RStudio Team (Citation2015) and were expected to use it during several homework assignments and on assessments during this course. Fourteen students completed the course with the first author as their instructor.
After the course was completed, all students in the study were emailed and asked if they would be willing to participate in a task-based interview that would cover a topic that was discussed in their second course in statistics. A $10 gift card was offered as an incentive. In total, five students (pseudonyms used) volunteered to participate in interviews with the first author during the spring semester following the completion of the course. Despite being a volunteer and convenience sample, the variation among the students made for a rich collective case.
describes the statistical and computational backgrounds of these students in addition to their experiences in the first and second courses in statistics. The students are listed from the most experienced to the least experienced as far as total knowledge of computing and statistics. These rankings are based on information gained from the interview and a demographic survey, as well as observations made by the first author while the students were in the second statistics course. The order that the students are listed in the table is by the total sum of ranks, in ascending order.
Table 3 Participant background information.
4.2 Data Collection
In the semester following the second course in statistics, task-based interviews were conducted with the five students. The interviews began with informing students that their actions would be recorded both by video and by screen capture. They were then instructed to try to solve the problems to the best of their ability and were encouraged to talk about what they were thinking as they worked.
In trying to make the process as similar as possible to a usual homework or lab setting, the computer that the students used during the interview had RStudio and access to the internet, which students were told they could use at any time. However, contrary to their usual homework setting, the interviewer was present to ensure they continued to verbalize their thinking. If students asked the interviewer questions about the problem, the questions were either redirected with leading questions, or answered with “I cannot tell you the answer to that.” The interviewer only gave direct information to the students when it was deemed they would not be able to move forward in the problem solving process and would give up otherwise.
Students were provided with the problem in and given time to read and make sense of the problem.
Fig. 1 Interview task.

They were then given the instruction to conduct a “full statistical analysis,” using the data and script that were provided to them (). It was left up to the interpretation of the student as to what a “full statistical analysis” may be.
Fig. 2 Script of the data provided to students.
Before the interviews were conducted, the researchers devised a list of the steps that they believed to be necessary in procuring a “full statistical analysis,” a term that was left to the student to interpret. This list was used as a way of confirming/disconfirming whether a student employed an aspect of statistical analysis that we, as researchers, anticipated would be needed for the task:
Identify that the problem requires a one-way ANOVA procedure.
Graph the data in a meaningful way to determine if there is a potential relationship between the weather report and the percentage of the total bill given as a tip.
Check the conditions for inference for ANOVA to see if the statistical analysis was appropriate. These conditions include:
Subjects must be randomly assigned to groups and that the groups must be independent.
The quantitative value within each group must be normally distributed or the sample within each group must be sufficiently large for the central limit theorem to apply.
The variances for each group should be equal.
There are no outliers that influence the results unduly.
Format the data for deeper analysis. This included concatenating the given quantitative variable and creating a categorical variable that describes the type of weather report given.
Use R to conduct the one-way ANOVA procedure.
Interpret the results that the computer had given in the context of the problem.
The data were intentionally given in the particular format in to add a complication to the usual statistical inference procedures that students would have conducted in a class. Normally, students would be given data where the response variable was a single vector of values, with a second vector comprising the explanatory variable. While students never needed to do a procedure to create a new variable through concatenation in their prior class, they were given tools, such as the concatenation [c ()] function and the replicate [rep ()] function, that could assist with such a process if they realized it needed to be done.
This was done to see if students could apply functions learned in other domains to problems they were facing in the present, as suggested by Chance (Citation1997). A help file was created prior to the interviews, utilizing a script that formatted the data properly so students could use it for the analysis. This file was only given to students to assist them at this point in the interview if they were unable to move forward in the interview without it. This file contained the following script:
group <-c(rep(“good”, 20), rep(“bad”, 20), rep(“none”, 20))
tips <-c(good.report, bad.report, no.report)
4.3 Data Analysis
A video file of each interview, including the screencast of the student’s work and the video of the student, was compiled. Each task-based interview was then examined at least three times for the purposes of this analysis by the first author. In the first pass through the interviews, the videos were coded for instances of statistical computing as described in the framework in . Each video was inspected a second time for accuracy of these codes, with a sample of students’ work viewed and discussed among both authors until agreement was met. In the third iteration of the videos, students’ work was categorized into the original six problem solving phases defined in . In the final pass through the interviews, it became evident that students were using the technology for planning in ways not previously characterized in problem solving phases. It was agreed upon by both authors that another category, research, was needed, and was added to the problem solving phases. Since students were asked to use a computer to aid in solving a statistical problem, they had access to the internet and each of them used it to research potential scripting code to solve the problem. Initially, these instances were identified as planning. However, it was later given its own category to distinguish it from a plan the students created on their own versus a plan they created in conjunction with doing research with external sources.
5 Data Summaries and Visualizations
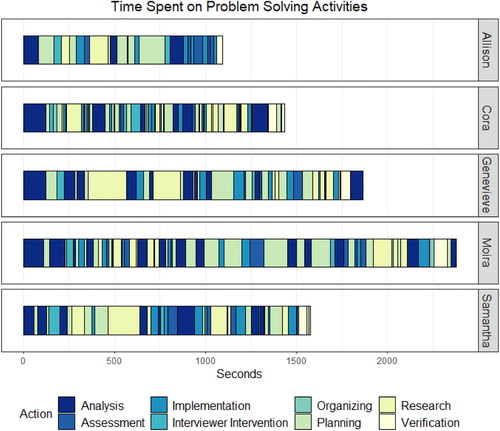
Analysis of the interview data involved condensing and displaying the coded work of the students in ways that could assist us in making sense of how the actions they were engaging may or may not have assisted them in problem solving during the interview task. The graphic in gives information about the sequence in which students engaged in problem solving phases, how long students spent in each phase, and how long (in seconds) students spent overall in the interview solving the problem.
Fig. 3 Sequence of problem solving phases in the task-based interviews.
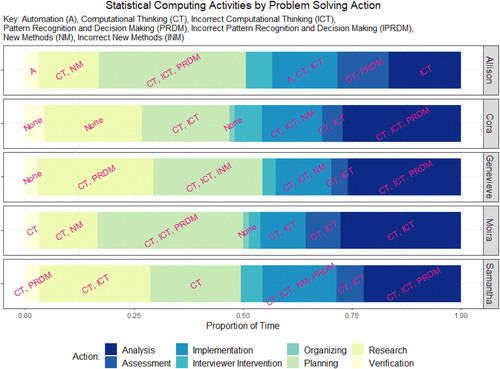
Additionally, the Ribbon chart in visualizes the proportion of time, during their interview, a student spent in each of the problem solving phases, and the types of statistical computing actions utilized in each phase. The order of the phases from left to right are reverse alphabetical order by category name (i.e., verification begins on left, assessment is farthest to right). Any statistical computing action that occurred during these problem solving phases is overlaid in the area representing the proportion of time from the entire interview a student spent in a given phase. Note that a given statistical computing category was not necessarily observed every time a student was in a particular problem solving phase, but it showed up at some point in that phase during the course of the interview.
Fig. 4 Proportion of time each student spent in problem solving phases with statistical computing actions overlaid.
Finally, describes which of the intended steps of the problem the students
Table 4 Completion of anticipated steps by student.
Were able to complete on their own; (✓)
Attempted, but needed intervention from the interviewer to complete; (■)
Partially completed; (∼)
Did not attempt. (✗)
6 Results
In this section, we will discuss findings from the interviews as they pertain to students’ use of the statistical computing actions. We look at when these actions were performed as pertains to the different problem solving phases, and what these actions might look like in the different phases.
6.1 Automation of Computational Procedures
Recall that automation of computational procedures includes students creating graphs or summaries to make sense of the data or using the technology to conduct the analysis to make proper inference, all while maintaining a reduced cognitive load. A prominent consequence of this statistical computing action is that it indicates students are proficient enough at programming the software that they can do it without much thought, and they do not lose sight of the goal of the problem. This means that the technology is helping the student solve the problem, not standing in their way of trying to do what they wish to accomplish. We can see from that automation of computational procedures was only utilized in the implementation and verification problem solving phases and only by Allison.
Allison utilized automation for computational procedures twice in the implementation phase. In one example, she was trying to use the technology to create a graph so that she could determine if conducting a one-way ANOVA procedure was necessary. She discussed her plan to visualize the data in side-by-side boxplots to determine if it was reasonable to attempt a one-way ANOVA procedure.
Allison: Do I need to look at the histograms to see?
Interviewer: If that’s what you feel like you need to do, then you can go ahead and do that.
Allison: If you looked at boxplots or the five number summaries of each one and you compared. You know what I mean? If you compared each thing, just so, first off you can see if there is a really obvious difference between them. Because if there isn’t, usually, I don’t know. I just like to graph.
After creating the graph, Allison was convinced that there appeared to be a difference between the boxplots and that conducting the analysis would be appropriate.
Allison: So looking at this, you can definitely tell that there is a difference in the average tip given between those (moves the curser between the first and second group) and so that, I think it’s worth looking at.
This is a prime example of using automation of computational procedures because Allison had no trouble creating the graphs, and once they were prepared, she was able to interpret them and use the information she had found to inform her next step in the analysis. In contrast, while Moira was able to create the side-by-side boxplot for this problem, it was not a purposeful action. She created it by accident while trying to find commands to conduct ANOVA. Additionally, she never interpreted the results that were found, and did not give any indication that the graph was used to guide her analysis. Thus, creating the graph was not considered as an automating computational procedures action for Moira.
Even though Allison was able to automate computational procedures in some parts of her interview, she still struggled to format the data properly when it came to conducting inference. In fact, all five students struggled with this, and spent a significant amount of time trying to format the data in a way that could be used for inference in R. This led to students forgetting the goal of the problem (not maintaining reduced cognitive load) and having to stop what they were doing to remind themselves of their goal several times. We can see this in , with the multitude of times students had to go back to the analysis phase of problem solving.
For example, it took Samantha almost 28 minutes from the start of the problem until she found the output for the analysis. By the time she had gotten to that point, she had forgotten that she was just trying to see if there was a difference in the groups as opposed to which group had the largest tip percentages.
Samantha: My p-value is less than 0.01. So that would mean that is significant, in which case I need to do one of those three methods, I think.
Interviewer: Okay. So does the question ask you to figure out which one is bigger, or if one is bigger?
Samantha: No. I don’t think so. Wait. (reads the prompt again) Okay, yeah, the data supports that there are differences because I have a p-value that is less than 0.01.
Note that while Samantha had been able to tell the interviewer that there were differences, she did not give any context to the problem when stating her results. Paired with the fact that she could not remember in general what it was she was trying to find from the problem, it is probably not a coincidence that she did not give specific details about the context of the problem when interpreting her results. This is also why she only received a “partially complete” assessment for the interpreting results step of the intended steps process (see ).
6.2 Computational Thinking
Recall that computational thinking entails three characteristics (see ). The first characteristic is that students can create a computational solution strategy, as opposed to a statistical solution strategy, for the problem. Second, students who are thinking computationally can communicate their solution strategy to the computer. The third aspect of computational thinking is being able to think critically or abstractly about a concept that the technology is demonstrating.
It should be no surprise to the readers that computational thinking was often seen in the planning and implementing phase of problem solving. Being able to create a solution strategy is essentially the student devising a plan for what they want to program, while communicating that solution strategy to the computer is equivalent to them implementing their plan. These two items were not always observed together, though. Several times, students would give a computational solution strategy, but then were never able to implement it.
For example, when Moira reached the point in the interview where she discovered the data were not formatted properly, she knew that she needed to join the data together into one vector. She even presented a pseudo plan for how to do this using SQL.
Moira: I remember this happening. I do. What was it? I’m getting it confused with my computer science stuff. I mean, we do a JOIN table kind of thing.
In this planning phase, Moira had a computational strategy, but she could not remember how to implement it in R. Even though she did not implement her proposed plan, she was still credited with computational thinking.
While not a common occurrence, thinking critically and abstractly while utilizing the computer, was also observed. In a discussion with Allison about concatenating the data in a planning phase, she was attempting to visualize what the data would look like after she ran the concatenation. Even though her thinking was not completely correct, she was still thinking abstractly about the data management before she ran the script.
Allison: If we did c parentheses all of these, then it would be all of them together. That’s probably not real.
Interviewer: So what would that look like? You’ve taken linear algebra. What would that look like as a vector?
Allison: Well currently we have three vectors, one for each thing. Oh, so it would just be a 3 by however many tip matrix… But I just want it to be one column.
Based on her dialog, we can tell that Allison is abstracting a matrix that consists of 3 rows by 20 columns. While this does not fit her plan of creating one long vector, it eventually helps her toward the desired data format to conduct the analysis.
While computational thinking was seen in each of the problem solving phases except organization (which did not include any statistical computing constructs), an interesting pattern occurred in which students were utilizing computational thinking. Each student found herself at some point struggling with how to write a piece of the script necessary to solve the problem. This led each student to a sequence that included research, planning, implementation, and assessment. Essentially, students would use the internet to research example scripts, they would plan what they thought they should script to mimic and apply their research results to their problem, they would then implement that plan and check results they obtained to see if they made sense.
This is one of the reasons why incorrect computational thinking (ICT) was so prevalent in the students’ work (see instances of ICT in ). For example, students were coded as having incorrect computational thinking in the research phase if they did not search for an appropriate example script that would help them to solve the problem. The student was coded as having incorrect computational thinking in the planning phase if they had found an example script they thought would work, but misinterpreted what they thought the script actually did. Students were coded as having incorrect computational thinking in the implementation phase if they were unable to communicate their planned script to the computer. Finally, students were coded as having incorrect computational thinking in the assessment phase if they incorrectly interpreted what an error meant.
Students had most of their incorrect computational thinking in the planning and implementation phases. However, even though students struggled to determine what a script was doing or how to tell the computer to perform certain actions, Allison, Cora, and Moira, more so than Samantha and Genevieve, were able to use the information they gained from their incorrect work to move forward in the problem solving process. This means that a student having incorrect computational thinking may not be a bad thing, as long as they were learning from it. It was a matter of the student’s persistence level as to how far this strategy helped them.
6.3 Pattern Recognition and Decision Making
Recall that pattern recognition included students being able to recognize patterns either in the computer code or in results. Decision making was defined as students using the output from the technology to influence their decision of where to go next in the analysis. While identified in other problem solving phases, pattern recognition and decision making was seen most often in planning and analysis.
As an example of pattern recognition in student work, we can look back to Moira’s conversation about trying to format the response variable properly. When she was creating a strategy for how to format the data in a planning phase, she fell back to her SQL knowledge to describe how she might format the data appropriately for the analysis.
One point of interest about this situation was the little amount of time and effort it took Moira to formulate her plan. Even though she was strategizing in the wrong programming language, she did not struggle to think of a way to format the data in a way that she could use to help solve the problem. She thought about how to use the tools in her toolbox, as opposed to the “blunt instruments” (Brown and Kass Citation2009) in front of her, to help answer the question. If she had been allowed to use SQL to solve the problem, or if she had known that SQL commands could be used with certain R packages, she may have been able to format the data properly without any programming hints.
Another way in which pattern recognition and decision making was identified was in the research phase, when students were trying to determine how something was scripted in an example they found online, then adapted it to fit the structure needed for the problem they were trying to solve. While it was not common, we note the distinction between how pattern recognition and decision making were found in research versus planning. For example, when Genevieve was trying to determine how to join her quantitative variables together, she found an example online of the concatenate function and accurately compared the variables on the website to the ones she had in her problem.
Genevieve: Okay, let’s say n ands, n would be good message, and the s would be the bad one, so here they’re just combining good and the bad.
Pattern recognition and decision making was also seen when students were trying to make sense of their problem in the analysis phase. For example, after a long struggle with getting the data into the appropriate format, Cora could not get the regression analysis to run. This was because she had inadvertently switched her explanatory and response variables in her script and R cannot build a linear model with a categorical response variable with the commands she had inputted. After doing some research online, she found an example that she was able to compare to the problem. She could not see where she was going wrong with her script, so the following conversation ensued between her and the interviewer:
Interviewer: So the model in the example that you are looking at online, which variable is the explanatory variable and which is the response variable?
Cora: So they’re saying weight is the response variable. Does that help me? Oh! So I did it backwards.
Even though the interviewer prompted Cora to think about the explanatory and response variables in the model problem, she was the one that took what she saw on the screen and used it as a model to understand and make a decision about the way the variables should be used in her analysis. Hence, pattern recognition and decision making helped her with her analysis phase. Similar conversations occurred with Samantha and Genevieve in their interviews.
6.4 Utilizing New Methods
Utilizing new methods to explore concepts involved students not following a prescribed set of procedures to answer a question or coming up with their own methods and reasons for using the technology in analysis. While six instances of new methods were noted in the students’ work, specifically in the implementation and research phases of problem solving, not enough information was found to be able to identify potential patterns about the use of this statistical computing action in the problem solving phases. However, an example that comes from Samantha gives good warning to students who are trying to find new ways to solve problems through research on the internet.
After Samantha had determined that she needed to do a one-way ANOVA procedure that included first creating the linear model, she found a website that demonstrated how to build a linear model in R. Unfortunately for her, not all websites provide accurate or appropriate information about linear models. The particular website that she had found gave her the computer script lm(x ∼ y) ().
Fig. 5 Website with misleading information utilized by Samantha (http://www.endmemo.com/r/lm.php).
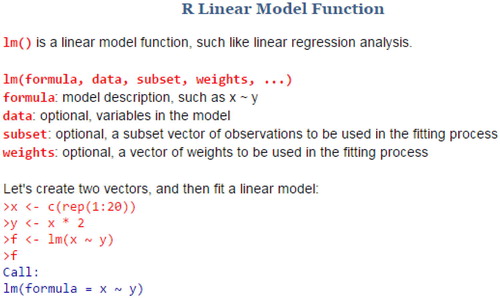
From her statistics background, she recognized that x represents the explanatory variable and y represents the response variable. She was able to then match that to the explanatory and response variables that she had defined previously from her problem. Samantha used this computer script without recognizing the computational error. In this case, having some good statistical knowledge but poor statistical computing sophistication left the student without the ability to check her solution. Fortunately, due to the nature of the data (Group being categorical and Tips being quantitative) R gave her an error when she later ran her script. Through a guess and check procedure to fix the error that she did not understand, she switched the variables around and came to the appropriate solution.
7 Discussion
In this section, we discuss what the results mean in terms of the research question and some implications for teaching.
7.1 How Do Students Use Statistical Computing Actions to Solve Problems?
It is clear from the results of this study that students use statistical computing actions differently to solve problems. Three themes about students’ use of statistical computing actions were identified. They are:
Automating computational procedures is a foundational statistical computing action in problem solving.
Students use computational thinking to form solution strategies.
Students lack of automating procedures and computational thinking inhibits statistical problem solving.
7.1.1 Automating Computational Procedures Is a Foundational Statistical Computing Action in Problem Solving
While only one student, Allison, demonstrated that she could use the statistical computing technology to automate procedures, we do have evidence that other students may also be able to do this. It would be ideal if all of our students could automate computational procedures, so that the technology is helping, not hindering, their problem solving (Chance et al. Citation2007). However, even Allison was only able to automate her procedures three times during the course of the interview. This included creating and interpreting the results of her boxplot, conducting the ANOVA procedure, and interpreting results of the analysis. It appears that while students can get to this point, utilizing automation of computational procedures can be elusive to those that lack experience and understanding in both statistics and computing.
This is important to note because students that are using statistical computing technologies to solve problems may be struggling to remember the programming necessary to complete the problem, as was seen in several of the examples given above. If they are lacking in either statistical or computational knowledge, the student may spend several minutes just trying to communicate basic statistical commands to the computer.
As we saw with Cora, for example, the order of the response and explanatory variables in the function were keeping her from obtaining a solution. Being able to communicate this to the computer had little to do with a student’s statistical knowledge, but it was frustrating for her as she struggled to get the appropriate output from the computer. Remember too, that Cora had taken a course in statistical computing and she still had some difficulty with some of the basic commands in R. If she struggled with scripting these commands, students with little to no experience will likely have much more trouble than she did.
7.1.2 Students Use Computational Thinking to Form Solution Strategies
Despite the struggle that these students face in recalling the syntax of the command-based languages, it is encouraging to know that students who are not yet able to automate procedures still have a method to solve problems using technology. As was discussed above, each of the students, in at least one point during their interview, utilized computational thinking, either correctly or incorrectly, in the problem solving strategy of research-planning-implementing-assessment. We saw that students were using the output from this process to help them revise their programming strategy and implement something new, to work toward a solution. These students were using computational thinking to help them solve the problem. Cora and Moira in particular used this method iteratively several times in their interview. Because they were persistent in this method, it did not matter that they were not yet able to automate the computational procedures in R. This strategy helped them come to a solution.
Encouraging students to use this sort of process at least gives them a strategy to solve problems when nothing else seems to be working. However, this does require a certain level of both statistical and computational knowledge. If the student does not have any clue as to what to research, or whether a source they have found is reliable, they will struggle to find a script that they can mimic in the remaining problem solving phases. It is therefore important that students are strong both statistically and computationally.
In addition to using computational thinking, Moira also demonstrated that having extra programming knowledge is helpful in a pattern recognition and decision making action. She recognized that the problem she needed to solve had a solution in SQL and used that information to help her come up with a solution strategy for R.
7.1.3 Students Lack of Automating Procedures and Computational Thinking Inhibits Statistical Problem Solving
Finally, when students are unable to automate procedures and their computational thinking is limited to creating a solution strategy without being able to convey it to the computer, students will not make forward progress on statistical problems they need to solve with computing tools. This was seen with both Samantha and Genevieve. In Samantha’s case, it is unclear as to whether this was due to a lack of statistical knowledge or computational knowledge as she seemed lost throughout the entire interview. In Genevieve’s case, it was clear that she knew what statistical actions needed to be taken, but she either did not possess the appropriate computational ability, or did not feel comfortable trying actions that may be perceived as incorrect in front of an interviewer.
7.2 Implications for Teaching
We agree with Bargagliotti et al. (Citation2020) that use of appropriate statistical packages beyond Excel should permeate undergraduate disciplines aimed at developing data acumen. Using statistical computing technologies can be helpful for students who are planning future careers in statistics, or who may need the technologies in future classes, hence the appeal for introducing industry standard software in introductory statistics classes (Baumer et al. Citation2014; Horton, Baumer, and Wickham Citation2014). However, the results from our small interview study should provide educators with cautious optimism. Starting students using these technologies too soon may be more of a hindrance to their statistical problem solving ability than it is a help, as we saw in the cases of Genevieve and Samantha.
As should be expected, it appears that students who struggle the least in using statistical computing technologies may be those that are the most comfortable with technology in general. Allison, who was familiar with statistics and computing, Cora, who had taken statistical computing, and Moira, who was familiar with computer programming, all found solutions to the interview task without too much prompting from the interviewer. For statistics instructors planning on using statistical programming languages in their classrooms, it may be advantageous to require a computer programming course before the students take the statistics course, or as a co-requisite.
Since curriculum changes are more difficult to navigate than changes within a course, it is likely that changes at the course level are more realistic. This research shows that statistical programming languages can add extraneous cognitive load to the problem solving process and it may be wise with novices to instead utilize a statistical technology meant for learning statistics. If a statistical programming language is to be used, then instructors should create structured assignments that help to build statistical computing skills within problem solving. For example, students could be required to write down or discuss their plan for how they think a problem should be solved. Then they would provide code or pseudocode for how they think their plan should be conveyed to the computer (Peltsverger and Debnath Citation2019). Instead of focusing on repeating keystrokes they have seen, students will be thinking about the process without the extra burden of having to remember specific pieces of code to get a result. This may help to build their statistical computing skills, but will also be helpful to the instructor in diagnosing whether issues students are having are due to statistical or computational aspects of the problem.
The interviews also demonstrated that when a student becomes stuck while solving a problem, they might easily get frustrated (Nolan and Temple Lang Citation2010) and ask for help before really trying anything on their own. This was evident in the interviews when Genevieve became verbally agitated that the interviewer would not answer her questions. At one point when she was struggling, the interviewer asked her what her normal strategy would be when unable to solve a problem. She told the interviewer that she would ask the teacher for help. However, this seems to have hindered her ability to script a solution in the end. In the activities teachers develop for students, perhaps structure them so that students may struggle and see how frustrating programming can be, but provide them with strategies to help overcome their struggles and build confidence in their statistical computing skills.
7.3 Future Research
This article presented research findings from a small study of five students. While we were able to establish some patterns in the ways these students utilize statistical computing actions while solving problems, more in-depth research should be done in this area. The framework of statistical computing actions could be used to frame additional research and development of instructional materials to assist students in developing their abilities in statistical problem solving. One of the complications in determining what was helping students to do well or not do well in the interviews was the mixed level of statistical and computational knowledge. Since students were at different levels of each, it was difficult at times to tell what was actually helping them solve problems or hindering them. Additionally, having the course instructor as the interviewer may have helped in easing student fears about the interview process, but in some cases, the familiarity may have been what deterred students from attempting the problem on their own. Future studies could use students with very similar statistical backgrounds, but potentially different computing backgrounds, to see how the differences in computing skill affects one’s sophistication in solving statistical problems. This would be helpful to confirm or refute results that were found herein.
Supplemental Material
Download PDF (485.3 KB)Supplementary Materials
Timelines of the interviews with statistical computing and problem solving actions are available online.
References
- Baglin, J. (2013), “Applying a Theoretical Model for Explaining the Development of Technological Skills in Statistics Education,” Technology Innovations in Statistics Education, 7.
- Bargagliotti, A., Binder, W., Blakesley, L., Eusufzai, Z., Fitzpatrick, B., Ford, M., Huchting, K., Larson, S., Miric, N., Rovetti, R., Seal, K., and Zachariah, T. (2020), “Undergraduate Learning Outcomes for Achieving Data Acumen,” Journal of Statistics Education, 28, 197–211. DOI: 10.1080/10691898.2020.1776653.
- Baumer, B., Cetinkaya-Rundel, M., Bray, A., Loi, L., and Horton, N. J. (2014), “R Markdown: Integrating a Reproducible Analysis Tool Into Introductory Statistics,” Technology Innovations in Statistics Education, arXiv:1402.1894.
- Ben-Zvi, D. (2000), “Toward Understanding the Role of Technological Tools in Statistical Learning,” Mathematical Thinking and Learning, 2, 127–155. DOI: 10.1207/S15327833MTL0202_6.
- Ben-Zvi, D. (2006), “Scaffolding Students’ Informal Inference and Argumentation,” in Proceedings of the Seventh International Conference on Teaching Statistics, pp. 1–6.
- Biehler, R., Ben-Zvi, D., Bakker, A., and Makar, K. (2012), “Technology for Enhancing Statistical Reasoning at the School Level,” in Third International Handbook of Mathematics Education, New York: Springer, pp. 643–689.
- Brown, E. N., and Kass, R. E. (2009), “Statistical Training and Curricular Revision,” The American Statistician, 63, 105–110. DOI: 10.1198/tast.2009.0019.
- Chance, B. (1997), “Experiences With Authentic Assessment Techniques in an Introductory Statistics Course,” Journal of Statistics Education, 5. DOI: 10.1080/10691898.1997.11910596.
- Chance, B., Ben-Zvi, D., Garfield, J., and Medina, E. (2007), “The Role of Technology in Improving Student Learning of Statistics,” Technology Innovations in Statistics Education, 1, 1–26.
- Chance, B., Cohen, S., Grimshaw, S., Hardin, J., Hesterberg, T., Hoerl, R., Horton, N., Malone, C., Nichols, R., and Nolan, D. (2014), Curriculum Guidelines for Undergraduate Programs in Statistical Science, Alexandria, VA: American Statistical Association.
- delMas, R. C., Garfield, J., and Chance, B. L. (1999), “A Model of Classroom Research in Action: Developing Simulation Activities to Improve Student’s Statistical Reasoning,” Journal of Statistics Education, 7.
- delMas, R. C., Garfield, J., and Zieffler, A. (2014), “Using TinkerPlots to Develop Tertiary Students’ Statistical Thinking in a Modeling-Based Introductory Statistics Class,” in Mit Werkzeugen Mathematik und Stochastik lernen—Using Tools for Learning Mathematics and Statistics, eds. T. Wassong, D. Frischemeier, P. R. Fischer, R. Hochmuth, and P. Bender, Wiesbaden: Springer Spektrum, pp. 405–420.
- Garfield, J., delMas, R., and Zieffler, A. (2012), “Developing Statistical Modelers and Thinkers in an Introductory, Tertiary-Level Statistics Course,” ZDM, 44, 883–898. DOI: 10.1007/s11858-012-0447-5.
- Holcomb, J., Chance, B., Tietjen, A. R., and Cobb, G. (2010), “Introducing Concepts of Statistical Inference via Randomization Tests,” in Proceedings of the Eighth International Conference on Teaching Statistics, Voorberg: International Statistical Institute.
- Horton, N. J., Baumer, B. S., and Wickham, H. (2014), “Teaching Precursors to Data Science in Introductory and Secondary Courses in Statistics,” in Proceedings of the Ninth International Conference on Teaching Statistics, Flagstaff, AZ.
- International Society for Technology in Education; Computer Science Teachers Association (2011), Operational Definition of Computational Thinking, National Science Foundation, available at http://csta.acm.org.
- Kalyuga, S., and Liu, T.-C. (2015), “Managing Cognitive Load in Technology-Based Learning Environments,” Journal of Educational Technology and Society, 18, 1–8.
- Lane-Getaz, S. J. (2010), “Linking the Randomization Test to Reasoning About p-Values and Statistical Significance,” in Eighth International Conference on Teaching Statistics, Ljubjana, Slovenia; Voorburg, The Netherlands.
- Lee, H. S., and Hollebrands, K. F. (2006), “Students’ Use of Technological Features While Solving a Mathematics Problem,” The Journal of Mathematical Behavior, 25, 252–266. DOI: 10.1016/j.jmathb.2006.09.005.
- Lee, H. S., Kersaint, G., Harper, S. R., Driskell, S. O., Jones, D. L., Leatham, K. R., Angotti, R. L., and Adu-Gyamfi, K. (2014), “Teachers’ Use of Transnumeration in Solving Statistical Tasks With Dynamic Statistical Software,” Statistics Education Research Journal, 13, 25–52.
- McNamara, A. (2016), “On the State of Computing in Statistics Education: Tools for Learning and Doing,” arXiv no. 1610.00984.
- Moore, D. S. (1997), “New Pedagogy and New Content: The Case of Statistics,” International Statistical Review, 65, 123–137. DOI: 10.1111/j.1751-5823.1997.tb00390.x.
- Nolan, D., and Temple Lang, D. (2010), “Computing in the Statistics Curricula,” The American Statistician, 64, 97–107. DOI: 10.1198/tast.2010.09132.
- Peltsverger, S., and Debnath, S. (2019), “Instructional Pseudocode Guide to Teach Problem-Solving,” in Proceedings of the 2019 ACM Conference on Innovation and Technology in Computer Science Education, p. 319.
- Pruim, R., Kaplan, D., and Horton, N. (2014), “Mosaic: Project MOSAIC (mosaic-web.org) Statistics and Mathematics Teaching Utilities,” R Package Version 0.9-1-3, available at http://CRAN.R-project.org/package=mosaic.
- RStudio Team. (2015), RStudio: Integrated Development for R, Boston, MA: RStudio, Inc., available at http://www.rstudio.com/.
- Schoenfeld, A. H. (1985), Mathematical Problem Solving, Orlando, FL: Academic Press.
- Tintle, N., VanderStoep, J., Holmes, V.-L., Quisenberry, B., and Swanson, T. (2011), “Development and Assessment of a Preliminary Randomization-Based Introductory Statistics Curriculum,” Journal of Statistics Education, 19. DOI: 10.1080/10691898.2011.11889599.
- Wing, J. M. (2006), “Computational Thinking,” Communications of the ACM, 49, 33–35. DOI: 10.1145/1118178.1118215.
- Witmer, J. A. (2016), “Concept Maps in Introductory Statistics,” Teaching Statistics, 38, 4–7. DOI: 10.1111/test.12083.
- Wolfram, S. (2016), “How to Teach Computational Thinking,” available at http://blog.stephenwolfram.com/2016/09/how-to-teach-computational-thinking/.