Abstract
This report describes the development and evaluation of a range of polyethyleneglycol and polyethyleneglycol-peptide liposome formulations that effectively target liver in vivo. A 19-amino-acid sequence from the N-terminal region of the circumsporozoite protein of Plasmodium berghei was attached to the distal end of di22:1-aminopropane-polyethyleneglycol3400, and incorporated into liposomes containing di22:1-phosphatidylcholine and di22:1-phosphatidylethanolamine-polyethyleneglycol5000. By systematically varying the mole fractions of both the lipid-polyethyleneglycol and the lipid-polyethyleneglycol-peptide conjugates, and screening for serum-induced aggregation in vitro, a serum-stable range of formulations was established. These stable formulations were tested for binding to Hepa 1-6 liver cells in culture, and from these results three formulations were prepared for intravenous administration in mice. All three formulations exhibited effective liposome targeting to the liver, with approximately 80% of the total injected dose recovered in the liver within 15 min. Uptake by liver cells was more than 600-fold higher than uptake by those in the heart, and more than 200-fold higher than uptake by lung or kidney cells. Effective targeting to liver in vivo was successful after repeated (up to three) administrations to the host at 14-day intervals. All formulations prepared for in vivo administration were stable in the presence of serum, as measured by complete retention of entrapped calcein dye. The formulation with the lowest mole fractions of peptide and polyethyleneglycol was the most cost-effective in terms of encapsulation efficiency and minimal use of peptide and polymer compounds. The in vitro biophysical screening, followed by cell culture testing, reduced the number of animals required to develop an effective set of targeted liposome formulations for in vivo application.
INTRODUCTION
Active targeting of therapeutic nanoparticles to tissues or organs is an important objective of current research to develop drug and gene delivery systems intended for systemic administration in vivo. Liposomes represent one class of nanoparticles that have been extensively investigated as vehicles for targeted drug delivery, as the liposomal lipid bilayer allows for the entrapment of therapeutically useful compounds within the aqueous interior (Gabizon Citation2003; Moghimi and Szebeni Citation2003; Allen and Martin Citation2004; Barratt Citation2003; Marcucci and Lefoulon Citation2004). In addition, conjugates of lipid and targeting ligand can be assembled into a liposome nanoparticle by hydrophobic interactions (Maruyama Citation2002; Park Citation2002; Sapra and Allen Citation2003; Gabizon et al. Citation2004). The strong hydrophobic forces that exist within the liposome bilayer minimize dissociation of the complexes in serum and blood, and also minimize leakage of entrapped contents.
We recently reported that a 19-amino-acid peptide from the N-terminal region of the circumsporozoite protein of Plasmodium berghei could successfully target systemically administered liposomes to mouse liver (Longmuir et al. Citation2006), with > 80% of the liposomal material delivered to hepatocytes. However, it was apparent that considerable research and development would be required to incorporate this targeting strategy into an effective in vivo drug delivery system. In particular, the peptide caused severe serum-induced liposome aggregation, even when attached to the distal end of a lipid-polyethyleneglycol (PEG) conjugate. Also, multiple issues regarding the suitability of these peptide-containing nanoparticles as targeted drug delivery vehicles were not addressed, including encapsulation efficiencies, surface properties, contents leakage as a function of peptide concentration, contents leakage as a function of lipid acyl chain length, the range of compositions that were both safe (non-aggregating) and effective for in vivo administration, determination of the more cost-effective formulations, and effectiveness upon repeat administration to the host. These issues are addressed in this communication.
MATERIALS AND METHODS
Peptide Synthesis
The peptide acetyl-CKNEKKNKIERNNKLKQPP-amide consisted of an N-terminal acetylcysteine followed by 18 amino acids of the N-terminal region (76 through 93) of the circumsporozoite protein of Plasmodium berghei, Anka strain (Swiss Protein entry name: CSP_PLABA; Primary accession number: P23093). This peptide was synthesized by Fmoc chemistry using a FastMoc™ protocol (Fields et al. Citation1991) on an ABI 431A peptide synthesizer, with all Fmoc amino acids (Anaspec, San Jose, CA) double-coupled to MBHA Rink-amide resin (Novachem, Newton, MA) (0.5 meq per g resin, 0.25 mmol scale synthesis).
The peptide was cleaved from the resin with 10 mL trifluoroacetic acid, 1.0 mL water, 1.0 mL phenol, 0.25 mL thioanisole, and 0.25 mL 1,2-ethanedithiol overnight at room temperature (Guy and Fields Citation1997). The peptide was purified by repeated precipitation in cold t-butyl methyl ether, dried, redissolved in 1 mM HCl, and chromatographed on a 75-mL column of Sephadex G-25 in 1 mM HCl. Fractions positive for cysteine (Ellman's reagent) were combined, filter-sterilized through a 0.22 μ m filter, and lyophilized in 2 ml glass vials containing approximately 5 μ mol peptide each. Mass spectrometry (Beavis, Chaudhary, and Chait Citation1992; Longmuir et al. Citation2006) indicated a single molecular species with the expected mass+1 of 2351.
Lipid Synthesis
1,2-dierucoyl-sn-3-phosphatidylethanolamine (di22:1-PE)
Di22:1-PE was synthesized by base-exchange of dierucoylphosphatidylcholine (di22:1-PC, Avanti Polar Lipids, Alabaster, AL) with ethanolamine, catalyzed with Streptomyces sp. Phospholipase D (Sigma, St. Louis, MO) (Sato et al. Citation2004).
1,2-dierucoyl-sn-3-aminopropane (di22:1-AP)
The synthesis of di22:1-AP was carried out in three steps. First, sn-3-aminopropanediol (Aldrich, Milwaukee, WI) was converted to sn-3-(t-Boc)aminopropanediol by reacting with 2-(tert-butoxycarbonyloxyimino)-2-phenylacetonitrile (Boc-ON,™ Aldrich, Milwaukee, WI) according to the protocols provided by the manufacturer. The product was acylated with erucic acid to form 1,2-dierucoyl-sn-3-(t-Boc)aminopropane by standard carbodiimide chemistry with dimethylaminopyridine catalyst (Otera Citation2003), then purified by LH-20 Sephadex chromatography in a solvent system of reagent alcohol/water (95:5). The t-Boc group was removed by treating with dichloromethane/trifluoroacetic acid (90:10) overnight at room temperature to form 1,2-dierucoyl-sn-3-aminopropane. The product was purified by removal of volatile compounds by drying in vacuo for 24 h.
di22:1-PE-PEG5000 and di22:1-aminopropane-PEG3400- maleimide
Ten μ mol di22:1-PE in 0.5 mL dry, distilled dichloromethane was combined with 20 μ mol of the N-hydroxysuccinimidyl (NHS) ester of mPEG5000 (Nektar, Huntsville, AL) and 100 μ mol of distilled triethylamine for 1.5 h at room temperature. The product was precipitated with 10 mL distilled t-butyl methyl ether, centrifuged, and the ether removed. This PE-PEG conjugate, containing excess unreacted PEG, was dissolved in 1.5 mL deionized water and applied to a 75 mL column of G-75 Sephadex in deionized water. Fractions (3 mL) were collected and analyzed by tlc (silica gel 60) in a solvent system of chloroform/methanol 16:3. The di22:1-PE-PEG5000 conjugate eluted first due to its propensity to form micelles in water and was well separated from the unreacted PEG. The fractions containing the di22:1-PE-PEG5000 were pooled, lyophilized, weighed (yield 95%), and stored at −70°C in distilled reagent alcohol.
The preparation of di22:1-aminopropane-PEG3400-maleimide (yield 74%) was carried out exactly as described above for the di22:1-PE-PEG5000. The NHS ester of PEG3400-maleimide was obtained from Nektar.
di22:1-aminopropane-PEG3400-succinyl-peptide Conjugate
In a typical coupling reaction, 4 μ mol of the peptide was adjusted to a volume of 400 μ L of dimethylformamide (dmf). Aliquots of di22:1-AP-PEG3400-maleimide, dissolved in dmf at a concentration of 20 μ mol/mL, were added until analysis with Ellman's reagent showed less than 2% of the initial concentration of free -SH. The concentration of lipid-PEG-succinyl-peptide conjugate was then calculated based upon the μ mol of peptide, the final volume, and the amount removed for DTNB analysis. Typically, a 1.1-fold molar excess of lipid-PEG-maleimide was required for the reaction to proceed to completion.
di22:1-aminopropane-Bodipy-FL and -TR-X
In a typical preparation, 2 μ mol di22:1-aminopropane was reacted with 3 μ mol Bodipy-FL succinimidyl ester (Molecular Probes, Eugene, OR) or 3 μ mol Bodipdy-TR-X succinimidyl ester in 200 μ L dmf. The reaction was initiated with the addition of 5 μ L triethylamine and allowed to react 1 h at room temperature. The mixture was diluted to 1 mL with reagent alcohol and the product purified on a 150 mL column of LH-20 Sephadex in 95:5 reagent alcohol/water. Concentrations were determined by absorbance (504 nm for Bodipy-FL, ε = 68,000 M− 1 cm− 1; 585 nm for Bodipy-TR-X, ε = 80,000 M− 1 cm− 1).
Preparation of Liposomes
Aliquots of lipids and lipid-peptide conjugates (dissolved in chloroform, reagent alcohol, or dmf) were placed in glass tubes, the solvents evaporated (N2 gas), then dried in vacuo at < 100 μ bar pressure for > 1 h at room temperature. For biophysical studies, the lipid residues were suspended in 10 mM Hepes, pH 7.4, with 5% glucose (“Hepes-glucose”). For cell culture and in vivo studies, the lipid residues were suspended in 5% glucose only. The suspensions were treated with two freeze-thaw cycles, then were extruded 5× through a double stack of 80 nm Nuclepore filters (Whatman, Clifton, NJ). The liposome solutions were filter-sterilized through 0.22 μ m filters. For in vivo administration, the solutions were concentrated by centrifugation at 4,000 × g in sterile Amicon Ultrafree-MC centrifugal filter devices with Biomax 100,000 MWCO filters (Millipore, Bedford, MA) and adjusted to a final concentration of 1 μ mol liposomal lipid per 50 μ L.
For calcein leakage experiments, liposomes were prepared as described above in Hepes-glucose plus 50 mM calcein dye. After extrusion through 80 nm Nuclepore filters, unencapsulated calcein was removed by column chromatography of the liposomes through a 20 mL column of G-75 Sephadex with Hepes-glucose buffer.
Size, polydispersity index, and zeta potentials were measured using a Malvern Nano ZS instrument with Malvern disposable zeta cells (Malvern USA, Southborough, MA). Solutions were typically 0.3 to 0.5 μ mol liposomes in 1 mL Hepes-glucose.
Serum-Induced Leakage of Calcein
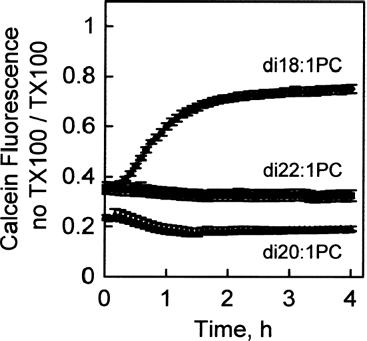
Approximately 10 nmol liposomes with entrapped calcein in 0.02 mL Hepes-glucose were added to 0.18 mL bovine serum in the 96-well assay plate (n = 4). Control wells consisted of 0.18 ml serum + 0.02 mL Hepes-glucose; 0.18 mL serum + 0.02 mL Hepes-glucose + 2% Triton X-100, and 0.18 mL serum + 0.02 mL liposomes + 2% Triton X-100 (all n = 4). Plates were placed in a Tecan Genios plate reader at 37°C, and fluorescence measured every 5 min for 4 h to monitor the increase in calcein fluorescence due to calcein leakage from the liposomes. The fluorescence values were imported into Excel worksheets. Serum-only values were subtracted from liposome values and the data expressed as the ratio of fluorescence without Triton X-100 divided by the fluorescence with Triton X-100 at each time point (see ).
FIG. 1 Serum-induced calcein leakage from di18:1-PC, di20:1-PC, and di22:1-PC liposomes in 90% bovine serum. Increase in calcein fluorescence due to serum-induced leakage was measured every 5 min over 4 h with a plate reader with a chamber temperature maintained at 37°C. Data are expressed as the fluorescence without Triton X-100 detergent, divided by the fluorescence with Triton X-100, which fully disrupts the liposomes and eliminates the calcein self-quenching at the high concentration inside the liposomes. Values are mean ± SEM, n = 4.
Alternatively, serum-induced leakage was monitored by mixing calcein-containing liposomes with 90% bovine serum and incubating 4 h at 37°C. Fluorescence emission scans (λex = 480 nm; λem = 500 to 600 nm) were obtained with a Cary Eclipse fluorometer at time = 0 h and 4 h. Emission scans from 4 experiments were averaged before comparison of fluorescence intensities at 0 and 4 h (see ).
Entrapment efficiencies were obtained by measuring the fluorescence of entrapped calcein dye and the fluorescence of liposomal Bodipy-TR-X after lysis with Triton X-100 (2% final volume). Nmol calcein and μ mol lipid were determined by comparison with standard curves of calcein (λex = 480 nm; λem = 515 nm) and 22:1-AP-Bodipy-TR-X (λex = 585 nm; λem = 620 nm), respectively.
Aggregation of Liposomes by Serum
Liposomes were diluted to 0.3 μ mol in 0.3 mL of Hepes-glucose, mixed with 0.7 mL calf serum, then incubated at 37°C for 1 h. Turbidity was evaluated by absorbance at 500 nm. Zero absorbance was set with Hepes-glucose alone. Control samples consisted of 0.7 mL serum plus 0.3 mL Hepes-glucose without liposomes. The average control value was then subtracted from all experimental values.
Liposome-Cell Incubation and Fluorescence Measurements
The mouse liver hepatoma cell line Hepa 1-6 was obtained from the American Type Culture Collection (#CRL-1830). Cells were maintained in Eagle's Minimal Essential Medium supplemented with 10% fetal bovine serum. Cells were dissociated from stock plates with trypsin and seeded into 96-well tissue culture plates, 10K cells per well with 250 μ L medium + serum, 48 h prior to addition of liposomes. For liposome-cell incubations, 50 nmol liposomes in 50 μ L 5% glucose were added directly to the medium + serum of each well, mixed, and incubated for 3 h at 37°C. At the end of the incubation period, wells were rinsed 3x with 250 μ l PBS, then the cells were lysed with the addition of 250 μ L PBS + 2% Triton X-100. Liposome uptake was measured by fluorescence with a Varian Cary Eclipse fluorometer with a wellplate reader accessory, as the liposomes contained 1% di22:1-aminopropane-Bodipy-TR-X.
Mouse Injection, Blood Collection, and Tissue Perfusion
All in vivo protocols were reviewed and approved by the University of California, Irvine, Institutional Animal Care and Use Committee (IACUC) prior to conducting the experiments. Balb/c female mice, 20 to 25 g, were injected via the tail vein with a mixture of 0.8 μ mol of peptide-containing liposomes plus 0.8 μmol of control liposomes (without peptide) in a total volume of 80 μ L of 5% glucose. For subsequent quantitative analysis of blood clearance and tissue uptake, peptide-containing liposomes also contained Bodipy-TR-X fluorescent probe, and control liposomes contained Bodipy-FL fluorescent probe (see for complete formulations). After 15 min, mice were deeply anesthetized with sodium pentobarbital (∼ 50 mg/kg; i.p.), then, after taking a blood sample, perfused through the heart with 5 mL/min saline for 2 min. The liver, lung, spleen, kidney, and heart were removed and placed in ice-cold phosphate-buffered saline for subsequent lipid extraction and fluorescence measurements, as described below.
TABLE 1 Molecular components and formulations used in this investigation.
Lipid Extraction of Mouse Tissue and Fluorescence Measurements
Weights were recorded for the entire liver, lung, spleen, kidney, and heart. A portion of each organ (0.05 to 0.2 g each) was weighed, then homogenized in 1 mL phosphate-buffered saline with a Teflon-glass homogenizer. The lipids were extracted by a modification of the method of Bligh and Dyer (Citation1959) as described in detail previously (Longmuir et al. Citation2006).
Fluorescence spectra of the extracted tissue lipids were obtained with a Varian Eclipse fluorometer. Bodipy-FL was measured by excitation at 485 nm and scanning for emission from 500 to 600 nm. Bodipy-TR-X was measured by excitation at 585 nm and scanning for emission from 600 to 700 nm. For all samples, absorption spectra were obtained over the same wavelength regions (Varian Cary 50 spectrophotometer). Emission and absorption spectra were recorded digitally (0.5 nm step size) and imported into Excel spreadsheets. Fluorescence intensities were calculated by subtracting the spectrum of the solvent only, correcting the emission spectrum for inner filter effects using the method of Lakowicz (Citation1999), then integrating the spectrum over the 100 nm emission wavelength range. Nmol of liposomes was calculated by comparison with the fluorescence emission spectrum of the extracted lipid from the aliquot of liposomes, of known quantity, used for injection.
Plasma fluorescence was obtained by centrifugation of the blood samples at 4,000 × g for 5 min. Then, 3 μ L of plasma was diluted to 1.0 mL with phosphate-buffered saline, and the Bodipy-FL and Bodipy-TR-X emission spectra recorded digitally as described above. The integrated fluorescence spectra were quantitatively compared to the spectra of a known quantity of injected liposomes, also diluted to 1.0 mL of phosphate-buffered saline.
Histological Analysis
For light microscopic studies, mice (n = 3) were euthanized by vascular perfusion 15 min after intravenous injection of liposomes. Animals were perfused through the heart with saline followed by 25 mL 4% paraformaldehyde, using a perfusion pump at a rate of 5 ml/min. Samples of liver tissue were collected and cut into 2- to 3-mm thick blocks, and these tissue blocks were post-fixed in 4% paraformaldehyde before being transferred to a 30% sucrose solution overnight at 4°C for cryo-protection. Tissue blocks were cut on a Reichert-Jung Cryostat at a section thickness of 10 to 12 μ m and sections were mounted directly onto subbed slides. Sections were inspected using a Nikon fluorescence microscope equipped with rhodamine and fluorescein filter sets. Images were captured using a Nikon DS 5M digital camera and imported into Adobe PhotoShop.
Statistical Analysis
Data for uptake of peptide-containing liposomes by Hepa 1-6 cells in culture () were compared to the uptake of control liposomes (without peptide) by performing an unpaired, two-tailed t-test for each formulation. Data for the clearance of liposome formulations in vivo from blood () were compared for significant differences using Analysis of Variance.
TABLE 2 Clearance of peptide-containing liposomes from blood compared with control.
Data for the uptake of liposome formulations by liver and other organs were compared for significant differences using Analysis of Variance (ANOVA) (n = 4 for each formulation). As presented in the Results section, for peptide-containing liposomes, there were no significant differences among the three formulations tested in vivo with respect to uptake by each organ examined (). Hence, for further analysis, the data for the three formulations tested in vivo were pooled (to give n = 12 for each organ). Differences in uptake between liver and other organs were then examined by unpaired, two-tailed t-tests. For control liposomes (without peptide), there were also no significant differences among the three formulations tested in vivo with respect to uptake by each organ examined (). The data for each organ were pooled for further analysis.
Differences between the organ distributions for first vs. third injection () were analyzed by unpaired, two-tailed t-tests.
TABLE 3 Organ distribution of liposomes—comparison of first injection to third injection
RESULTS
The lipid and peptide components used in this investigation are listed in . The abbreviations for each component are also listed in .
Stability of Monoenoic PC Liposomes in Serum
An important objective of the formulation development was for the liposomes to be in the fluid state at 37°C, but non-leaky when exposed to serum. Fluid-phase liposomes allow for the lipid-anchored targeting peptide to dynamically adjust its conformation and arrangement within the liposome, in order to maximize its interaction with the in vivo target (Eliaz et al. Citation2004).
Three symmetric phosphatidylcholines with monounsaturated fatty acids with increasing acyl chain length were tested for leakage of entrapped calcein dye in the presence of serum at 37°C. These were dioleoylphosphatidylcholine (di18:1-PC, chain melting phase transition temperature −18°C) (Cevc Citation1993), dieicosenoylphosphatidylcholine (di20:1-PC, phase transition temperature −4.5°C), and dierucoylphosphatidylcholine (di22:1-PC, phase transition temperature 13°C). As indicated in , liposomes of di18:1-PC were leaky in the presence of serum, losing most of the entrapped calcein within 1 h. However, liposomes of di20:1-PC and di22:1-PC fully retained entrapped calcein in the presence of serum for 4 h at 37°C. All subsequent formulations contained di22:1-PC as the principal glycerophospholipid.
Serum-Induced Aggregation of Liposomes
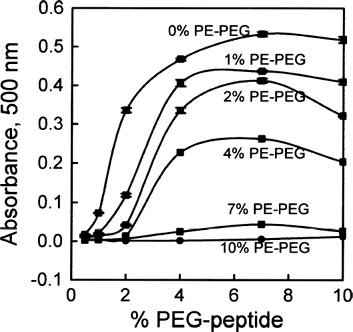
Thirty-six formulations of lipid suspensions were prepared containing a) di22:1-AP-PEG3400-peptide with mole percentages from 0.5% to 10%, b) di22:1-PE-PEG5000 with mole percentages from 0 to 10%, and c) di22:1-PC. These suspensions were extruded through 80 nm filters and the resulting liposomes stored at room temperature in Hepes-Glucose buffer. In this buffer system, all formulations were stable and their solutions remained optically clear over several days. These formulations were then tested for aggregation by calf serum at 37°C. As shown in , many of the formulations exhibited rapid and substantial aggregation (as measured by turbidity at 500 nm) when mixed with serum. However, inclusion of 7 or 10 mol% di22:1-PE-PEG5000 produced formulations that were stable in serum for di22:1-AP-PEG3400-peptide concentrations ranging from 0.5 to 4 mol%. Formulations of 4% di22:1-PE-PEG5000 with 0.5% or 1% di22:1-AP-PEG3400-peptide also did not show serum-induced aggregation.
FIG. 2 Aggregation of liposomes in serum due to di22:1-AP-PEG3400-peptide conjugate, and prevention of aggregation by addition of di22:1-PE-PEG5000. Formulations of di22:1-PC were prepared with increasing concentrations of 22:1-AP-PEG3400-peptide conjugate from 0.5 mol% to 10 mol %, as indicated by x-axis. Formulations also contained di22:1-PE-PEG5000, ranging from 0 to 10 mol%, as indicated by the labels for each curve. Samples were incubated with serum for 1h at 37°C, and aggregation measured by the increased absorbance at 500 nm due to turbidity. Error bars are mean absorbance ± SEM, n = 3. In most cases error bars are eclipsed by the size of the symbol for each datapoint.
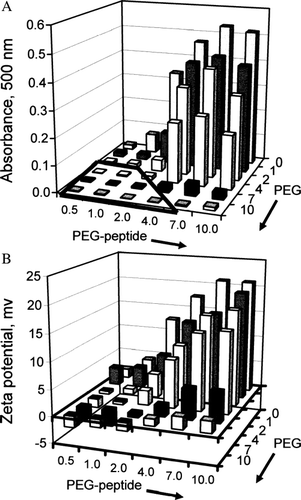
and present a side-by-side comparison of the serum-induced aggregation data with the zeta potential measured for each formulation. Those formulations that were stable in serum are indicated within the polygon shown in . As shown in , these serum-stable formulations exhibited zeta potentials from approximately −3 to +3 millivolts.
FIG. 3 Comparison of serum-induced aggregation of liposomes with zeta potential. (A) Three-dimensional view of turbidity data presented in . Region where peptide-containing liposomes were stable in serum is indicated by the polygon in the lower-left portion of graph. Relative to control values (serum + buffer without liposomes) these preparations displayed turbidities at 500 nm of less than 0.01 absorbance units. (B) Corresponding zeta potentials of all formulations. Each zeta potential indicated on the graph is the mean of three determinations.
Cell Culture Testing of Serum-Stable Formulations
The subset of formulations that were stable in the presence of serum were then tested for binding to Hepa 1–6 mouse liver hepatoma cells in culture. Hepa 1–6 cells were seeded into 96-well plates, and, after 48 h, 50 nmol of liposomes were added directly to the medium + serum and incubated with the cells at 37°C. The liposomes also contained 1% di22:1-AP-Bodipy-TR-X in order to quantitate liposome binding to cells. After 3 h, the wells were rinsed 3× with PBS, the cells were lysed with PBS + 2% Triton X-100, and the fluorescence measured quantitatively on a fluorometer with a 96-well plate reader.
shows the liposome uptake (as measured by fluorescence intensity) for the various liposome formulations that were tested. Liposomes without lipid-PEG-peptide conjugate showed low uptake of liposomes. All formulations with peptide exhibited significantly higher binding (p < 0.001 in all cases) compared to those without peptide. The two formulations that exhibited the highest binding contained a 7:2 ratio or a 10:4 ratio of PEG to PEG-peptide.
FIG. 4 Uptake of serum-stable liposome formulations by Hepa 1-6 cells in culture. (A) Uptake of individual serum-stable formulations. (B) Uptake of liposomes as a function of the ratio of lipid-PEG-peptide to lipid-PEG.
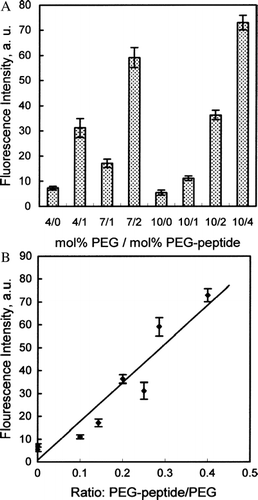
presents the cell-binding data plotted as a function of the ratio of PEG-peptide to PEG. There was a strong linear correlation (r = 0.95) between binding and the ratio of PEG-peptide to PEG, as seen by the linear regression line also indicated on the graph. The analysis indicated that the serum-stable formulations that bound most effectively had the highest ratio of PEG-peptide to PEG.
In Vivo Testing of Serum-stable Formulations
The three formulations that exhibited the highest levels of binding to Hepa 1-6 cells in culture were then prepared for in vivo administration, as summarized in . The corresponding control formulations (without PEG-peptide) were also prepared (). Prior to injection, the peptide-containing liposomes were mixed with an equal quantity of the corresponding control liposome formulation, to give 0.8 μ mol each in a total volume of 80 μ L 5% glucose. Animals (n = 4 for each formulation) were injected via the tail vein, then were euthanized after 15 min. A blood sample was collected for analysis of serum, and tissues taken for lipid extraction and measurement of uptake of liposomes.
The data in indicate that, relative to control liposomes, the peptide-containing liposomes were > 90% cleared from the circulation within 15 min. There was no statistically significant difference among the three formulations tested with respect to blood clearance (p = 0.38).
indicates that the three peptide-containing formulations tested in vivo effectively targeted the liver, approaching 80% of the injected dose after 15 min. There was no statistically significant difference among the three formulations with respect to liver uptake (p = 0.22). Between 5% and 10% of the injected dose was found in spleen, and less than 1% was found in the heart, kidney, and lungs. As with the liver, there was no significant difference among the three formulations with respect to uptake by the other organs. When the data from all peptide-containing formulations were pooled, the uptake of peptide-containing liposomes by liver was calculated to be 608 ± 102 times greater than heart, 236 ± 29 times greater than kidney, 253 ± 36 times greater than lung, and 13 ± 2 times greater than spleen (mean ± SEM, n = 12). Differences between liver and all other organs examined were highly statistically significant (p < 1 × 10− 14).
FIG. 5 Quantitative uptake (15 min following intravenous administration) of peptide-containing liposomes by various organs in balb/c mice, compared to control liposomes. Data are expressed as a percentage of total injected dose. Values are mean ± SEM, n = 4 mice. (A) Organ uptake of the three most effective, serum-stable, peptide-containing formulations, as determined from the data in : Solid bar: 10% PEG/ 4% PEG-peptide; Dotted bar: 7% PEG/2% PEG-peptide; Clear bar: 4% PEG/1% PEG-peptide. (B) Organ uptake of the corresponding liposomes without peptide. Solid bar: 10% PEG; Dotted bar: 7% PEG; Clear bar: 4% PEG.
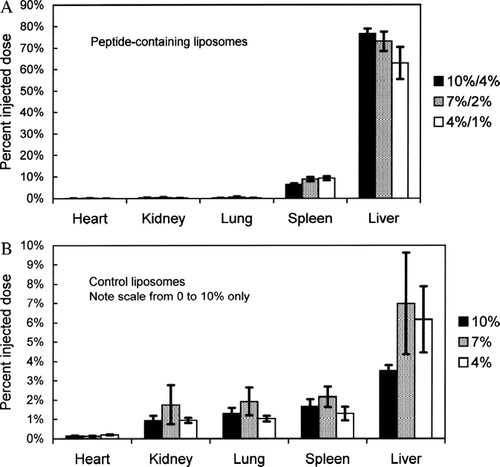
indicates that the three corresponding control formulations (without peptide) that were tested in vivo were not taken up to a large extent by any organ. There were no statistically significant differences among the three formulations with respect to any of the organs examined. When the data from all control formulations were pooled, uptake of control liposomes by liver was 34.0 ± 7.3 times greater than heart, 5.5 ± 1.4 times greater than kidney, 3.8 ± 0.9 times greater than lung, and 3.7 ± 0.9 times greater than spleen (mean ± SEM, n = 12).
Repeat AdministrationIn Vivo
The liposomes containing the intermediate levels of PEG and PEG-peptide (“7%/2%,” see ) were injected intravenously into a set of 3 mice at 14 day intervals, and compared to mice injected once. presents the comparison of the organ distributions determined after a single injection versus after three injections. Compared with a single administration, no statistically significant difference was found for the organ distribution of the liposomes after repeat administration.
Histology
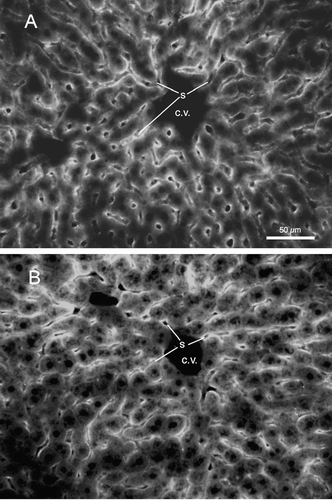
In order to determine the distribution of intravenously injected liposomes within the liver tissue, mice were injected with the “7%/2%” peptide-containing formulation () either once or three times at 14-day intervals. Mice were euthanized 15 min after the final injection, followed by vascular perfusion with saline followed by 4% paraformaldehyde. presents a fluorescence image that illustrates the distribution of liposomes in liver tissue following a single injection of liposomes. Intense labeling was observed along the borders of the liver sinusoidal capillaries, with lighter levels of labeling within the cytoplasm of hepatocytes. presents a fluorescence image indicating the distribution of liposomes following a third injection at 14-day intervals. By inspection, no difference in the pattern of labeling was observed between a single injection and repeat injections. Additional sections from both single-injected and repeat-injected livers were collected and stained with hematoxylin and eosin for analysis of general tissue features and for evidence of infiltration of mononuclear blood cells. Comparisons of the two sets of liver tissue sections revealed no differences in apparent edema or vacuolization of the tissue, and no differences in the numbers of stained mononuclear cells. These results indicate that general inflammatory processes in the liver did not occur from the repeated injections.
FIG. 6 Fluorescence image, using rhodamine optics, of 12 μ m crytostat sections of liver showing patterns of liposome labeling in an mouse euthanized 15 min following intravenous injection of the “7%/2%” formulation of peptide-containing liposomes (see ). Note the intense liposome labeling along the sinusoidal borders, and the lighter labeling within the cytoplasm of hepatocytes. S: sinusoidal capillaries; C. V.: central vein; calibration bar = 50 μ m. (A) Single injection. (B) Third injection of liposomes at 14-day intervals.
Encapsulation Properties
Encapsulation efficiencies for the three formulations tested in vivo were evaluated by measuring, by fluorescence spectroscopy, the nmol of entrapped calcein dye (from a 50 mM calcein solution used for preparation of the liposomes) per μ mol of lipid. The formulation with the lowest percentage of PEG and PEG-peptide exhibited the highest calcein entrapment, 2.5 greater compared to the formulation with the highest percentage of PEG and PEG-peptide. Size differences among the formulations () were small (approximately 5% to 10% differences in Z-average diameters). The data suggest that the higher mole fractions of PEG and PEG-peptide excluded a significant amount of interior volume that would otherwise be available for entrapment of aqueous solutions.
TABLE 4 Encapsulation properties of liposome formulations.
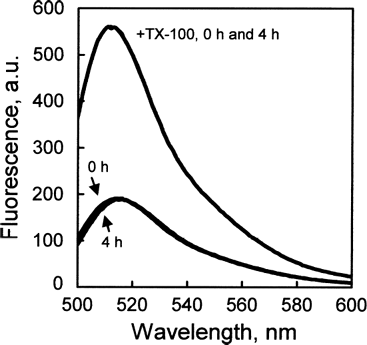
The encapsulation efficiency differences were not the result of leakage that may have occurred during the course of the preparation and measurements. All three formulations were non-leaky in the presence of serum at 37°C. shows a representative fluorescence emission scan (for the “10%/4%” formulation) of the entrapped calcein at t = 0 h, and after 4 h in the presence of 90% bovine serum at 37°C. No significant leakage of entrapped dye was observed with any of the three formulations.
FIG. 7 Example of retention of calcein dye by liposomes in the presence of serum. Liposomes with the 10%/4% PEG/PEG-peptide formulation were mixed with 90% calf serum and incubated at 37°C for 4 hours. Emission scans (λex = 480 nm; λem = 500 to 600 nm) were obtained at 0 h and 4 h. Also shown is relief of fluorescence quenching by the addition of Triton X-100 (2% final concentration). The scans shown are the average of four separate experiments. There was no significant difference between the fluorescence intensities of the scans at 0 h and 4 h (p = 0.33).
DISCUSSION
Strategy for Active Targeting to Liver
The active targeting strategy reported here is based upon the highly effective liver targeting exhibited by sporozoites of the microorganism Plasmodium. When introduced into the circulation, the sporozoites are cleared by the liver within minutes (Shin et al., Citation1982), and infection with as few as 10 sporozoites can subsequently lead to malaria (Ungureanu et al. Citation1977). The organ specificity is attributed primarily to the circumsporozoite protein (CSP) found on the surface of the sporozoites (Menard 2000; Mota and Rodriguez Citation2002). The CSP contains two conserved amino acid sequences, termed regions I and II, that are found in the various species that infect mammalian hosts (Tewari et al. Citation2002). Recently, a peptide containing the conserved region I amino acids (KLKQP), plus the basic amino acid domain upstream from region I, has been shown to bind strongly to affinity columns of heparin and heparan sulfate (Ancsin and Kisilevsky Citation2004). Peptides sequences containing both the conserved amino acids and the heparan sulfate binding region upstream are referred to as “region I plus”. These sequences are proposed to be at least partially responsible for Plasmodium targeting in vivo by binding to the highly-sulfated heparan sulfate proteoglycans (HSPG's) found in liver (Pradel, Garapaty, and Frevert Citation2002; Pinzon-Ortiz et al. Citation2001; Lyon, Deakin, and Gallagher Citation1994). These HSPG's are located primarily on the basolateral side of the hepatocytes and within the space of Disse (Soroka and Farquar Citation1991).
The liposome formulations reported here contained a peptide with the amino acid sequence from the “region I plus” domain of the CSP of Plasmodium berghei, a species that infects rodents. As we report here, when administered intravenously into mice, peptide-containing liposomes were rapidly cleared from the blood and were targeted specifically to the liver. Uptake by liver was more than 600-fold higher than uptake by heart, and more than 200-fold higher than uptake by lung or kidney.
Complexity of the Formulation and Optimization
The liposome formulation consists of three functional components: 1) a phosphatidylcholine, di22:1 PC, 2) a lipid-PEG conjugate (di22:1 PE-PEG5000), and 3) a lipid-PEG-peptide targeting ligand (di-22:1 AP-PEG3400-peptide). The forth component, the fluorescent lipid, is necessary for evaluating the properties of the liposomes during research and development, but would not be expected to be a component of an eventual therapeutic formulation. Some liposome formulations currently approved for clinical use also contain three functional components, such as Caelyx® which contains a phosphatidylcholine, cholesterol, and a phosphatidylethanolamine-PEG bioconjugate (Charrois and Allen Citation2004). For these formulations, targeting is based upon passive mechanisms, where the liposomes accumulate preferentially at the sites of tumors due to increased leakiness of the endothelial bed, as well as impaired lymphatic clearance within the tumor itself. The results of our experiments reported here show promise that liposome formulations for eventual therapeutic use can be developed that incorporate active targeting strategies, with the same number of components compared to the passive targeting liposome formulations currently approved for clinical use.
With a three component liposome formulation, considerable research and development was required for formulation optimization, as we report here. Optimization was required because it was found that the lipid-PEG3400-peptide alone promoted extensive liposome aggregation in the presence of serum. To stabilize the liposomes in the presence of serum, additional PEG, in the form of PE-PEG5000, was required. In vivo testing of all the formulations prepared for this investigation, containing a range of mole fractions of both PE-PEG and lipid-PEG-peptide, would have required a prohibitively large number of animals. In vitro screening offered a clearly advantageous alternative to extensivein vivo experimentation. The combination of biophysical testing for non-aggregating formulations, followed by cell culture testing for targeting, resulted in the selection of a small number of candidate formulations that were found to be effective when tested in vivo. By this procedure, relatively few animals were required to achieve the research objectives.
Other investigators have reported active targeting liposome formulations that also contain targeting ligand in the form of lipid-PEG-ligand plus additional lipid-PEG without ligand. In particular, optimization of formulations for liposome targeting to folate receptors has required the inclusion of both lipid-PEG-folate ligands and additional lipid-methoxyPEG (Gabizon et al. Citation1999; Gabizon et al. Citation2004). These studies have determined that a mole fraction of lipid-PEG-folate of less than 1% is optimal for receptor binding, whereas the mole fraction of lipid-PEG required for serum stabilization and prolonged circulation of the liposomes is upwards of 5%. Also, it is reported that effective targeting is achieved when the folate is placed on a PEG chain (PEG3350) that is longer than the surrounding lipid-PEG (PEG2000). In contrast, in this investigation, the targeting ligand (at the distal end of PEG3400) was surrounded by lipid-PEG of longer chain length (PEG5000). Surrounding the lipid-PEG-peptide with shorter lipid-PEG chains, such as PEG2000, did not prevent serum-induced aggregation (unpublished observations).
Future Directions
In order to develop this peptide-based targeted delivery system for eventual therapeutic use, particularly for repeat administration, the potential antigenicity and inflammatory characteristics of the system must be investigated. We are encouraged by the results presented here showing that the liposomes continued to target liver effectively upon repeat administration, and that there was no evidence of inflammation within the liver tissue. These studies must be followed up with ELISA tests to detect possible antibodies against the peptide present in the host following repeat administration. Markers of inflammation, such as inflammatory cytokines, should be measured upon single and repeat liposome administrations as well.
Second, the results presented here indicate that when the lipids contain a sufficiently long monoenoic acyl chain (C20:1 or longer), the liposomes can be passively loaded with compounds soluble in aqueous medium, in this case the dye calcein. These calcein loaded liposomes were non-leaky in the presence of serum for several hours at 37°C. Clearly the next step is to demonstrate that the liposomes can be actively loaded (via a pH gradient across the bilayer) with amine-containing therapeutically-useful compounds such as the chemotherapeutic agents doxorubicin and vincristine (Abraham et al. Citation2005). These experiments are now in progress.
This work was supported by the National Institutes of Health EB-003075.
REFERENCES
- Abraham S. A., Waterhouse D. N., Mayer L. D., Cullis P. R., Madden T. D., Bally M. B. The liposomal formulation of doxorubicin. Methods Enzymol. 2005; 391: 71–97
- Allen T. M., Martin F. J. Advantages of liposomal delivery systems for anthracyclines. Semin. Oncol. 2004; 31: 5–15
- Ancsin J. B., Kisilevsky R. A. Binding site for highly sulfated heparan sulfate is identified in the N terminus of the circumsporozoite protein: Significance for malarial sporozoite attachment to hepatocytes. J. Biol. Chem. 2004; 279: 21824–21832
- Barratt G. Colloidal drug carriers: Achievements and perspectives. Cell. Mol. Life Sci. 2003; 60: 21–37
- Beavis R. C., Chaudhary T., Chait B. Alpha-cyano-4-hydroxycinnamic acid as a matrix for matrix-assisted laser desorption mass-spectrometry. Org. Mass Spectrom. 1992; 27: 156–158
- Bligh E. G., Dyer W. J. A rapid method of total lipid extraction and purification. Can. J. Biochem. Physiol. 1959; 37: 911–917
- Cevc G. Phospholipids Handbook. Marcel Dekker Inc., New York 1993; 946
- Charrois G. J. R., Allen T. M. Drug release rate influences the pharmacokinetics, biodistribution, therapeutic activity, and toxicity of pegylated liposomal doxorubicin formulations in murine breast cancer. Biochim. Biophys. Acta 2004; 1663: 167–177
- Eliaz R. E., Nir S., Szoka F. C. Interactions of hyaluronan-targeted liposomes with cultured cells: Modeling of binding and endocytosis. Methods Enzymol. 2004; 387: 16–33
- Fields C. G., Lloyd D. H., Macdonald R. L., Otteson K. M., Noble R. L. HBTU activation for automated Fmoc solid-phase peptide synthesis. Peptide Res. 1991; 4: 95–101
- Gabizon A., Horowitz A. T., Goren D., Tzemach D., Mandelbaum-Shavit F., Qazen M. M., Zalipsky S. Targeting folate receptor with folate linked to extremities of poly(ethyleneglycol)-grafted liposomes: In vitro studies. Bioconj. Chem. 1999; 10: 289–298
- Gabizon A. Emerging role of liposomal drug carrier systems in cancer chemotherapy. J. Liposome Res. 2003; 13: 17–20
- Gabizon A., Shmeeda H., Horowitz A. T., Zalipsky S. Tumor cell targeting of liposome-entrapped drugs with phospholipid-anchored folic acid-PEG conjugates. Adv. Drug Deliv. Rev. 2004; 56: 1177–1192
- Guy C. A., Fields G. B. Trifluoroacetic acid cleavage and deprotection of resin-bound peptides following synthesis by Fmoc chemistry. Methods Enzymol. 1997; 289: 67–83
- Lakowicz J. R. Principles of Fluorescence Spectroscopy, 2nd ed. Kluwer Academic/Plenum Publishers, New York 1999; 54
- Longmuir K. J., Robertson R. T., Haynes S. M., Baratta J. L., Waring A. J. Effective targeting of liposomes to liver and hepatocytes in vivo by incorporation of a Plasmodium amino acid sequence. Pharm. Res. 2006; 23: 759–769
- Lyon M., Deakin J. A., Gallagher J. T. Liver heparan sulfate structure. A novel molecular design. J. Biol. Chem. 1994; 269: 11208–11215
- Marcucci F., Lefoulon F. F. Active targeting with particulate drug carriers in tumor therapy: Fundamentals and recent progress. Drug Discov. Today 2004; 9: 219–228
- Maruyama K. PEG-immunoliposome. Biosci. Rep. 2002; 22: 251–266
- Ménard R. The journey of the malaria sporozoite through its hosts: Two parasite proteins lead the way. Microbes Infect. 2000; 2: 633–642
- Moghimi S. M., Szebeni J. Stealth liposomes and long circulating nanoparticles: Critical issues in pharmacokinetics, opsonization and protein-binding properties. Prog. Lipid Res. 2003; 42: 463–478
- Mota M. M., Rodriguez A. Invasion of mammalian host cells by Plasmodium sporozoites. Bioessays 2002; 24: 149–156
- Otera J. Esterification: Methods, Reactions, and Applications. Wiley-VCH, Weinheim 2003
- Park Y. S. Tumor-directed targeting of liposomes. Biosci. Rep. 2002; 22: 267–281
- Pinzon-Ortiz C., Friedman J., Esko J., Sinnis P. The binding of the circumsporozoite protein to cell surface heparan sulfate proteoglycans is required for Plasmodium sporozoite attachment to target cells. J. Biol. Chem. 2001; 276: 26784–27791
- Pradel G., Garapaty S., Frevert U. Proteoglycans mediate malaria sporozoite targeting to the liver. Mol Microbiol. 2002; 45: 637–651
- Sapra P., Allen T. M. Ligand-targeted liposomal anticancer drugs. Prog. Lipid Res. 2003; 42: 439–462
- Sato R., Itabashi Y., Fuhishima H., Okuyama H., Kuksis A. Simple synthesis of diastereomerically pure phosphatidylglycerols by phospholipase D-catalyzed transphosphatidylation. Lipids 2004; 39: 1025–1030
- Shin S. C., Vanderberg J. P., Terzakis J. A. Direct infection of hepatocytes by sporozoites of Plasmodium berghei. J. Protozool. 1982; 29: 448–454
- Soroka C. J., Farquar M. G. Characterization of a novel heparan sulfate proteoglycan found in the extracellular matix of liver sinusoids and basement membranes. J. Cell Biol. 1991; 113: 1231–1241
- Tewari R., Spaccepelo R., Bistoni F., Holder A. A., Crisanti A. Function of region I and II adhesive motifs of Plasmodium falciparum circumsporozoite protein in sporozoite motility and infectivity. J. Biol. Chem. 2002; 277: 47613–47618
- Ungureanu E., Killick-Kendrick R., Garnham P. C., Branzie P., Romanescu C., Shute P. G. Prepatent periods of a tropical strain of Plasmodium vivax after inoculations of tenfold dilutions of sporozoites. Trans. R. Soc. Trop. Med. Hyg. 1977; 70: 482–483