
 ?Mathematical formulae have been encoded as MathML and are displayed in this HTML version using MathJax in order to improve their display. Uncheck the box to turn MathJax off. This feature requires Javascript. Click on a formula to zoom.
Abstract
Agomelatine is a new antidepressant having very low oral drug bioavailability less than 5% due to being liable to extensive hepatic 1st pass effect. This study aimed to deliver agomelatine by transdermal route through formulation and optimization of microemulsion gel. Pyramidal screening was performed to select the most suitable ingredients combinations and then, the design expert software was utilized to optimize the microemulsion formulations. The independent variables of the employed mixture design were the percentages of capryol 90 as an oily phase (X1), Cremophor RH40 and Transcutol HP in a ratio of (1:2) as surfactant/cosurfactant mixture ‘Smix’ (X2) and water (X3). The dependent variables were globule size, optical clarity, cumulative amount permeated after 1 and 24 h, respectively (Q1 and Q24) and enhancement ratio (ER). The optimized formula was composed of 5% oil, 45% Smix and 50% water. The optimized microemulsion formula was converted into carbopol-based gel to improve its retention on the skin. It enhanced the drug permeation through rat skin with an enhancement ratio of 37.30 when compared to the drug hydrogel. The optimum ME gel formula was found to have significantly higher Cmax, AUC 0–24 h and AUC0–∞ than that of the reference agomelatine hydrogel and oral solution. This could reveal the prosperity of the optimized microemulsion gel formula to augment the transdermal bioavailability of agomelatine.
Introduction
Major depressive disorder (MDD) is a kind of depression characterized by a persistent severe depressed mood for most of time for a two-week period or more (Andrews et al., Citation2005). It causes disability and interfering with the ability to eat, sleep, study and work (Dempster et al., Citation2014; Du et al., Citation2015). Selective serotonin reuptake inhibitors (SSRI), the first choice for the treatment of depression, act by inhibiting the presynaptic reuptake of serotonin thus increasing the free serotonin available to bind to postsynaptic receptors (Preskorn, Citation1997; Ban, Citation2001).
Agomelatine is a novel drug acting as an agonist to the melatonergic receptors and antagonist to the serotonergic 5-HT2c receptors (Millan et al., Citation2003). The recommended dose of agomelatine is 25 mg once daily taken at bedtime. During its development, agomelatine showed high safety profile and tolerability. This could be related to its novel mechanism of action that avoids the systemic serotonin release (Loo et al., Citation2002; Kennedy & Emsley, Citation2006; Montgomery, Citation2006; Rouillon, Citation2006). Agomelatine is well and rapidly absorbed after oral administration (80%) but it has low absolute bioavailability (less than 5%) due to extensive first pass metabolism (Zupancic & Guilleminault, Citation2006; Anurag et al., Citation2010).
Transdermal drug delivery system increases patient compliance, avoids gastrointestinal irritations, reduces first pass metabolism of drugs, sustains drug action and reduces side effects. So, there are many researches in recent years about it (McNeill et al., Citation1992; Azeem et al., Citation2009a). The stratum corneum restricts the transport of most drugs through the skin and considered as a main obstacle against drug permeation. Therefore, various techniques are used to enhance transdermal drug permeation, including the use of nanocarriers (e.g. microemulsions, nanoparticles and liposomes), penetration enhancers and physical techniques, such as iontophoresis, microneedles and electroporation, alone or in combination with other method (Essa et al., Citation2004; Wang et al., Citation2007; Balaguer-Fernandez et al., Citation2010; Vaghani et al., Citation2010; Nair et al., Citation2011). Drug carriers, such as microemulsions, nanoparticles and liposomes are a common and useful for transdermal drug delivery as they can alter the physical characteristics of applied drug and increases its transport across the skin (Nicoli et al., Citation2001; Lee & Langer, Citation2003; Essa et al., Citation2004; Liu et al., Citation2008; Xing et al., Citation2009; Tsai et al., Citation2010).
Microemulsions (ME) are thermodynamically stable and optically isotropic systems consisting of oil, water, surfactants and cosurfactant. They are thermodynamically stable and easily manufactured. Moreover, they enhance drugs solubility and permeability (Lehmann et al., Citation2001; Wu et al., Citation2001; Paolino et al., Citation2002; Peltola et al., Citation2003; Yuan et al., Citation2006; Spernath et al., Citation2007; Liu et al., Citation2008; Tsai et al., Citation2010). D-optimal mixture design was found to be the most suitable for microemulsion systems when compared to other designs as microemulsions are composed of three components which are oil, Smix and water. Moreover, the use of D-optimal design facilitated setting different constraints for different factors where the sum of all components is constant (i.e.100% w/w) (Barot et al., Citation2012).
The aim of this study was to develop an optimized ME formula able to overcome the shortcomings of the oral agomelatine delivery. Pyramidal screening was adopted to select the most suitable oil, surfactant and cosurfactant. This technique was found to be superior over the discrete screening, which depends on the drug solubility in each individual component, in the aspect of considering the power of the used surfactant and cosurfactant to emulsify the incorporated oil (Azeem et al., Citation2009b). After screening and selection of formulation components, D-optimal mixture design was utilized to statistically optimize agomelatine loaded MEs. The optimized ME dispersion had been designed to be transformed into gel and then, characterized for its in vivo behavior regarding enhancement of the drug bioavailability.
Materials and methods
Materials
Agomelatine was kindly gifted by Hikma Pharma Co., Cairo, Egypt. Capryol 90®, Lauroglycol 90®, Labrafac Lipophile WL®, Labrafac CC®, Labrafil M 11944 Cs®, Labrasol®, Transcutol HP®, Plurol diisostearique® were obtained as a gift from Gattefosse Co., Saint-Priest, France. Squalene, castor oil, isopropyl alcohol, isopropyl myristate (IPM), Cremophor EL® and Cremophor RH40® were purchased from Sigma-Aldrich Co., St. Louis, MO. Carbopol Ultrez 21® was purchased from Lubrizol Co., Wickliffe, OH. Tweens, spans and propylene glycol were purchased from El-Nasr Pharmaceutical Chemical Co., Cairo, Egypt. All other chemicals and solvents were of analytical grade and used without further purification.
Screening of oils, surfactants and cosurfactants
Screening of oils
For poorly soluble drugs, the loading of drug per formulation affects the total weight of formula used in delivering the therapeutic dose of drug (Azeem et al., Citation2009b). To choose the oil with the highest solubilizing capacity for agomelatine, the saturation solubility of agomelatine in different oils, such as Capryol 90, Lauroglycol 90, Squalene, Castor oil, IPM, Labrafil M1944 Cs was performed. Excess agomelatine was added to 2 mL of various oils, mixed with vortex mixer and then kept in shaking water bath at temperature 25 ± 0.5 °C for 72 h. Dispersions were centrifuged at 4000 rpm for 10 min and the agomelatine concentration was measured in the supernatant using UV–VIS spectrophotometer (UV-1601, Shimadzu, Kyoto, Japan) after suitable dilution with ethanol at ʎmax 276.6 nm. Diluted solutions of oils were taken as blank. The oil with the highest solubilizing capacity for agomelatine was selected for further studies (Barot et al., Citation2012).
Screening of surfactants
The surfactant for developing agomelatine MEs was selected based on its solubilizing capacity for the selected oil. Briefly, aliquots of 10 µL of oil were added to 2.5 mL of 15% (w/w) aqueous solution of surfactant with vigorous vortexing till the appearance of turbidity. The solubility was determined using the following equation (Georgeta et al., Citation2015):
(1)
(1)
where v represents the volume (mL) of the selected oil added till the appearance of the turbidity, d is the density of the selected oil (g/mL) and Q is the quantity of surfactant contained in 2.5 mL of 15% (w/w) aqueous solution of surfactant.
Screening of cosurfactants
Choice of the cosurfactant was performed based on its ability to form the biggest ME region. The selected surfactant was mixed with 4 types of cosurfactants (Transcutol HP, propylene glycol, span 80 and Plurol diisostearique). At Smix ratio of 1:1 w/w, the pseudoternary phase diagrams were plotted using the weight ratios of oil, Smix as follow: 90:10, 80:20, 70:30, 60:40, 50:50, 40:60, 30:70, 20:80 and 10:90 w/w. The ME components percentages were then calculated and the pseudoternary phase diagrams were constructed. The transparent ME areas were determined.
Selection of the optimum Smix ratio
Titration method was used to construct pseudoternary phase diagrams to select the most suitable Smix ratio having the largest ME area (Barot et al., Citation2012). Altered ratios of Smix (1:1, 1:2 and 2:1) were prepared. Then, the oil was mixed with these mixtures to give the weight ratios of 10:90, 20:80, 30:70, 40:60, 50:50, 60:40, 70:30, 80:20 and 90:10 w/w. These mixtures were titrated with distilled water drop wise while being magnetically stirred at ambient temperature. The mixtures were examined for clarity after each addition. The titration was continued until the solutions became cloudy or turbid. The quantity of water which made the mixtures turbid was recorded (Barot et al., Citation2012).
Design and preparation of the ME formulations
D-optimal mixture experimental study was designed based on the three components, the selected oil (X1), the selected Smix (X2) and water (X3). The range of each ME component was selected, based on the previous results obtained from the pseudoternary phase diagrams, as follows: The oil ranged from 5 to 10% and the Smix was in the range of 30–55%. The highest percentages of water (40–60%), able to form ME with the remaining components, were adopted to increase the hydration of stratum corneum layer and so, facilitate the drug permeation. A group of candidate points were chosen by the software and this resulted in 11 formulations with five replicates, as shown in . The study was designed using Design-Expert software version 7 (Stat-Ease, Inc., Minneapolis, MN).
Table 1. The composition of ME formulations based on the D-optimal mixture design and the measured characteristics.
The surfactant and cosurfactant with the selected Smix ratio were mixed with the oil in different proportions and the resultant mixtures were vortexed (JULABO Labortechnik, Seelbach, Germany) at ambient temperature. The drug was dissolved in these mixtures followed by the addition of the predetermined amount of distilled water.
Evaluation of the prepared MEs
Determination of globule size (GS), polydispersity index (PDI), zeta potential (ZP) and optical clarity
Development of ME formulations with the minimal GS was a critical target for enhancing the transdermal permeation. On the other hand, PDI and ZP were considered as indicators for the particle size variability and the system physical stability, respectively. The GS, PDI and ZP of agomelatine loaded MEs were measured using Malvern Zetasizer (Zetasizer Nano ZS-90, Malvern instruments, Worcestershire, United Kingdom). Finally, the optical clarity of the prepared ME formulations was measured spectrophotometrically at 400 nm, using distilled water as a blank. Three samples were taken from each formula and analyzed and the average values ± standard deviation were recorded.
Ex vivo permeation
The ex vivo study was approved by Research Ethics Committee, Faculty of pharmacy, Cairo university, PI 1456. Skin samples were obtained from scarified newly born albino Wistar rats, and then examined for being intact without any cut or holes. After that, every sample was wrapped in aluminum foil, placed in polyethylene bags and stored in deep freezer at −20 °C till further use. To bring the skin pieces to room temperature before starting the permeation study, they were soaked in phosphate buffered saline (pH 7.4) at room temperature for 1 h (Wagner et al., Citation2000). The rat skin was clamped between the donor and the receptor chambers of modified Franz diffusion cells (area = 0.95 cm2), where the stratum corneum side faced the donor compartment and the dermal side faced the receptor compartment. The receptor compartment was filled with 10 mL 50% v/v ethanoic phosphate buffer saline (pH 7.4) to maintain sink conditions for agomelatine (saturated solubility = 0.5 mg/mL) (Magnusson & Koskinen, Citation2000; Raza et al., Citation2013b). The receptor chambers were thermostatically heated to 37 ± 0.5 °C and their content was magnetically stirred at 100 rpm through the whole experiment time. Each ME formulation (500 mg) containing 5 mg agomelatine was placed in the donor chamber. At time intervals of 0.5, 1, 2, 4, 6, 8 and 24 h, all the receptor chamber solution was withdrawn and immediately replaced with equal volume of fresh medium. The concentration of agomelatine in the withdrawn samples was determined using HPLC (Shimadzu, Kyoto, Japan) equipped with an isocratic pump and a reversed phase C18 column (3.9 × 300 mm, particle size 5 µm; Waters, MA) at ʎmax of 230 nm. A mixture of 50:50 v/v acetonitrile and potassium dihydrogen phosphate buffer (15 mMol) was used as a mobile phase (pH 3.5), running at a flow rate of 1.0 mL/min (Liu et al., Citation2013). The analysis method had been validated.
For each formulation, the cumulative amount permeated of agomelatine (mg/cm2) was plotted as a function of time (t). Drug flux at a steady state (Jss) was calculated by dividing the slope of the most linear part of the graph by the area of the employed diffusion cell. Enhancement ratio (ER) was calculated using the following equation (Xie et al., Citation2017):
(2)
(2)
Where the control formula was aqueous suspension equivalent to 5 mg agomelatine.
Optimization of the ME formulations
The mean GS (Y1), optical clarity (Y2), cumulative amount permeated after 1 h (Q1, Y3), cumulative amount permeated after 24 h (Q24, Y4) and ER (Y5) were utilized as the traced responses (dependent variables). Linear, quadratic and special cubic models are the most appropriate models for mixture designs consisting of three components. The best model was selected based on higher values of adjusted R2 and predicted R2. Adjusted R2 and predicted R2 should be within 0.2 of each other to ensure the validity of the model. The term ‘Adequate precision’ indicates signal to noise ratio, and it is desirable to be more than 4 (Huang et al., Citation2004). The optimum formulation was selected to have the smallest GS, the highest optical clarity, cumulative amount permeated after 1 h (Q1), cumulative amount permeated after 24 h (Q24) and enhancement ratio (ER).
Preparation and characterization of the ME gel formula
The optimum ME formula was converted into gel to improve the retention of formula on the skin. This was done by adding carbopol® Ultrez 21 (0.2% w/w) into the optimized ME formula and it was left overnight to allow dissolution and swelling of the gelling agent followed by dropwise addition of tri-ethanolamine (0.3%). The prepared agomelatine ME gel formula was characterized through measuring its GS, optical clarity and ex vivo characteristics (Q1, Q24 and ER) in comparison with 0.2% w/w carbopol gel containing the same amount of the suspended drug (Agomelatine hydrogel).
Moreover, samples were taken from the ME gel formula and transferred into rheometer plate having a CPE-41 spindle (Brookfield viscometer HBDV-I, Middleboro, MA). The applied rotation per minute ranged from 2 to 100 keeping the % torque within the acceptable limits (Morsi et al., Citation2014). Viscosity and shear stress values were determined at each corresponding rate of shear. The power model was used to analyze and characterize the flow properties of the test formula.
(3)
(3)
Where τ is the shear stress (dyne/cm2), K is the consistency index (dyne/cm2.sn), γ is the rate of shear (s−1) and n is the flow index. Flow index higher than unity could indicate Newtonian flow whereas shear-thinning flow is pinpointed if the value was less than 1. On the other hand, the flow index value could exceed the unity in case of shear thickening systems (Ye et al., Citation2017).
Imaging by transmission electron microscope (TEM)
The optimized ME gel formula was examined using transmission electron microscope (JEM-1230, Jeol, Tokyo, Japan). Samples were taken from the formula and spread over a carbon coated copper grid. Then, phosphotungistic acid 2% w/v solution was utilized to stain the placed samples. Finally, samples were left to dry at room temperature and visualized at 100 kV.
In vivo bioavailability of optimized ME gel formula
Study design
Nine white rabbits (weight ≈ 3–4 kg) were used in the study. The protocol of the study was reviewed and approved (PI 1456) by research ethics committee, Faculty of Pharmacy, Cairo University (REC-FOPCU). The rabbits were housed two per cage at room temperature with free access to food and water with a 12 h light–dark cycle. The dorsal hair was removed using hair removal cream to facilitate application of the formula to the skin, then the rabbits were divided into three groups. Three-way, three-period, crossover design was applied with one-week washout period. An equivalent dose of 1 mg from either the ME gel formula or the reference agomelatine hydrogel was applied on the dorsal skin of each animal of the 1st and 2nd groups, respectively. On the other hand, equivalent drug solution (1 mg/mL) was orally administered to the third group. The applied dose was calculated based on dose translation from animal to human studies (Reagan-Shaw et al., Citation2008). At time intervals 0.25, 0.5, 1.0, 1.5, 2.0, 2.5, 3.0, 4.0, 5.0, 6.0, 8.0 and 24.0 h following application, blood samples were withdrawn from the marginal ear vein after local anesthetic cream is applied on the collection site 10 min prior to sampling. The blood samples were collected in 2 mL vacutainer tubes containing EDTA and then centrifuged at 4000 rpm for 10 min. The supernatant was transferred into another PE tubes, sealed and stored at −20 °C until assayed.
Assay method
Agomelatine was analyzed in plasma samples using Triple Quadrupole LC/MS/MS Mass Spectrometer (Micromass, Manchester, United Kingdom). Plasma samples (0.5 mL) were placed in 7 mL glass tubes, and then 100 µL of internal standard solution (1.6 µg/mL Clonazepam) was added. Samples were then vortexed. The extraction solvent (4 mL ethyl acetate) was added then samples were vortexed for 1 min. Samples were then centrifuged at 4000 rpm for 10 min at 4 °C (Eppendorf centrifuge 5804 R, Hamburg, Germany). The organic layer was separated into clean Wassermann tubes and dried using vacuum concentrator (Eppendorf 5301, Hamburg, Germany). The dried residues were reconstituted through vortexing with 200 µL of the mobile phase for1 min. and finally, placed into the autosampler of the LC-MS/MS. Samples of 20 µL were injected into a Shimadzu Prominence (Shimadzu, Japan) series LC system equipped with degasser (DGU-20A3) using sunfire column (50 mm ×5 µm). The isocratic mobile phase (80% acetonitrile + 20% 0.01 M Ammonium formate) was delivered at a flow rate of 1.0 mL/min into the mass spectrometer’s electrospray ionization chamber. Quantitation was achieved by MS/MS detection in positive ion mode for both agomelatine and clonazepam (IS) using a MDS Sciex (Foster City, CA) API-3200 mass spectrometer, equipped with a Turbo Ionspray interface at 500 °C. The ion spray voltage was set at 5500 V. Detection of the ions was performed in the multiple reactions monitoring (MRM) mode, monitoring the transition of the m/z 244.03 precursor ion to the m/z 185.30 for agomelatine and m/z 315.96 precursor ion to the m/z 270.00 for the internal standard. The Q1 and Q3 quadrupoles were set on unit resolution. The analytical data were processed by Analyst software version 1.4.2 (AB Sciex Pte. Ltd., Woodlands, Singapore).
Pharmacokinetic parameters and statistical analysis
The mean concentrations of agomelatine in plasma were plotted against time. The peak plasma concentration (Cmax) as well as the time to reach this peak (tmax) was determined for each employed animal. The areas under agomelatine concentration-time curve till last time (AUC0–24 h) and till infinity (AUC0–∞) were calculated using the trapezoidal method. Elimination half-life (t1/2) and mean residence time (MRT) were calculated using Kinetica software program version 4.4.1 (Thermo Fisher Scientific Inc., Waltham, MA). Results were expressed as mean values ± standard deviations. The obtained pharmacokinetic data were analyzed using SAS® (SAS Inc., Cary, NC) university edition through the general linear model (GLM) to calculate the arithmetic means and standard deviation of all continuous variables. The utilized SAS code was as follows (Choi et al., Citation2014):
proc glm data = agomelatine;
class formulation subject period sequence;
model logX= sequence subject (sequence) period formulation;
estimate “test-ref” formulation −1 + 1;
test h = sequence e = subject(sequence);
lsmeans formulation/adjust = t pdiff = control(“R”) CL alpha = 0.10;
run;(4)
Where X was entered as Cmax, AUC0–24 h or AUC0–∞.
Results and discussion
Screening of oils, surfactants and cosurfactants
Screening of oils
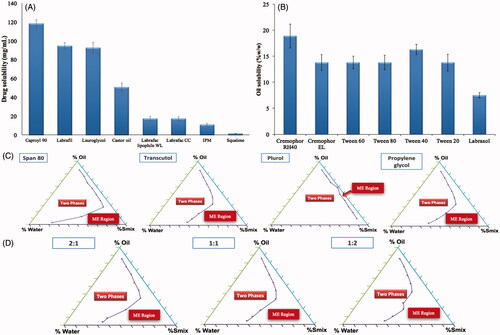
When ME is formulated using an oil having high drug solubilizing power, a lesser amount of oil could be used to dissolve the desired drug dose. Consequently, lower surfactant concentration will be needed to solubilize the oil and this could increase the safety and tolerability of the system (Georgeta et al., Citation2015). Capryol 90 showed the highest solubilizing power for agomelatine as demonstrated in . It is a semi-synthetic medium chain derivative having surfactant properties (Constantinides, Citation1995). This could be considered as an added value supporting the selection of Capryol 90 as an oily phase for the development of ME formulation.
Figure 1. Screening of oils (A), surfactants (B) and cosurfactants (C), in addition to selection of the optimum Smix ratio (D).
Screening of surfactants
The surfactant selection is critical for the development of MEs, as it is an important factor for controlling the spontaneous formation of a stable ME formulation. The surfactants act by forming a film at the oil water interface, which leads to the reduction of interfacial tension and consequently spontaneous formation of MEs (Chen et al., Citation2004). It is crucial to select the surfactant with a proper HLB value but with a minimum necessary concentration. Nonionic surfactants were selected because of their safety, biocompatibility, high stability, low sensitivity to pH changes or the presence of electrolytes or charged molecules and biocompatible nature (Constantinides, Citation1995; Georgeta et al., Citation2015). In our study, selection of surfactant was governed by its solubilization efficiency for the selected oil phase. Cremophor RH40 showed the highest solubilizing efficiency for Capryol 90 as shown in and so, it was selected for further studies.
Screening of cosurfactants
Addition of cosurfactants leads to an additional reduction in the interfacial tension and increases the fluidity of surfactant layer, thus expanding the microemulsion area (Lawrence & Rees, Citation2012; Georgeta et al., Citation2015). The microemulsion area in the pseudo-ternary phase diagrams was used to evaluate the emulsification potential of the cosurfactants. presents the pseudoternary phase diagrams constructed for Capryol 90 (oil phase), water, Cremophor RH40 and four different cosurfactants (Transcutol HP, propylene glycol, span 80 and Plurol diisostearique) at a fixed Smix ratio (1:1). Transcutol HP was chosen as the cosurfactant of choice for agomelatine MEs construction as it had shown the largest ME area in the ternary phase diagram.
Selection of the optimum Smix ratio
Pseudo-ternary phase diagrams were plotted for the three selected Smix ratios 1:1, 1:2 and 2:1 w/w surfactant to cosurfactant. Clear and stable MEs were obtained by the three Smix ratios but the one which gave the largest area was 1:2 w/w, as illustrated in . Therefore, this ratio was selected for further studies.
Evaluation of the prepared MEs
Determination of globule size (GS), polydispersity index (PDI), zeta potential (ZP) and optical clarity
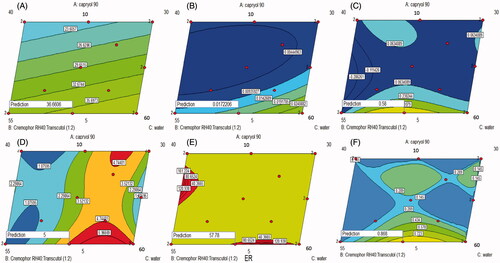
GS of the ME affects its stability, skin penetration and hence in vivo efficacy (Xi et al., Citation2009; Wang et al., Citation2012). As shown in , the GS of the various ME formulations ranged from 15.8 to 46.8 nm. Linear model was the most suitable one fitting the Y1 values (p value = .0335) with non-significant lack of fit (p value = .3789) and adequate precision of 5.3 indicating the model ability to navigate the design space with the minimal pure error (Elbary et al., Citation2011). ANOVA analysis on GS (nm) of ME (Y1) shows that linear mixture components have a significant effect on GS (p value < .05). Formula 11 which showed the smallest GS was composed of 10% oil, 50% Smix and 40% water as illustrated in . This may be due to the low content of water and high content of Smix which allows more reduction of the interfacial tension, which results in better reduction of ME GS (Shah et al., Citation2009; Xi et al., Citation2009). Decreasing the GS could increase the contact surface area between the skin and the ME system, and so facilitate the drug transport across the skin (Khurana et al., Citation2013). The regression equation relating different factors and interactions for the GS in terms of coded variables was as follows:
(5)
(5)
Figure 2. Contour diagrams for the effect of formulation variables on the globule size (A), optical clarity (B), Q1 (C), Q24 (D), ER (E) and desirability (F).
As shown in , the PDI of various ME formulations varied between 0.13 and 0.38. This low PDI values indicated the uniformity of the GS within each formulation (Biruss et al., Citation2007). Moreover, the ZP values of various ME formulations varied between −12.8 and −25.7 mV indicating the reasonable physical stability of most ME formulations prepared (White et al., Citation2007).
The optical clarity of the different ME formulations ranged between 0.005 and 0.039 nm, as displayed in . The high optical clarity of MEs could indicate the effective emulsification of Capryol 90 into water which resulted in the formation of isotropic MEs (Date & Nagarsenker, Citation2008). The quadratic model adopted for the analysis of the obtained optical clarity values. It had been validated through its high adequate precision (9.775) and its non-significant lack of fit (p value = .5251). Factorial ANOVA of the optical clarity values showed that the linear mixture had a significant effect on the traced response values (p value = .0037) with significant interactions between oil/Smix and oil/water percentages. It could be observed from that decreasing water with increasing the oil and the Smix percentages could increase the optical clarity of the prepared ME formulations. The regression equation describing the effect of different factors of the traced response was as follows:
(6)
(6)
Ex vivo permeation
As shown in , the Q1 of the various ME formulations varied between zero and 0.580 mg/cm2, the Q24 of different ME formulations ranged from 0.6 to 5.0 mg/cm2 and the ER of the various ME formulations varied between 0.26 and 57.78. The cubic model was the most fitting one to the values of three responses Q1 (Y3), Q24 (Y4) and ER (Y5). The lack of fit was non-significant relative to the pure error (p value > .05) with high adequate precision (> 4) in each of the three responses indicating the adequate signal to noise ratio (Barton, Citation2013). The factorial equations correlating the studied factors to the measured responses were as follow:
(7)
(7)
(8)
(8)
(9)
(9)
ANOVA analysis on Q1 (Y3), Q24 (Y4) and ER (Y5) of MEs showed that the linear mixture was significant (p value < .05) with significant interactions between each of the three components, i.e. oil, water and Smix. It could be noticed from ) that decreasing the oil and increasing the Smix could increase Q1, Q24 and ER. Decreasing oil percentages could minimize the affinity of agomelatine as a lipophilic drug to remain in the ME phase and enforce its partitioning to the stratum corneum (Yuan et al., Citation2006). Moreover, increasing Smix content could facilitate the fluidization of the lipid bilayer within skin and so, support the drug permeation into the systemic circulation (Hua et al., Citation2004).
Selection of the optimized ME formulation
The aim of the optimization of pharmaceutical formulations was to obtain a high quality system based on the predetermined levels of variables (Basalious et al., Citation2010). A numeric analysis was used to select the optimum formula using the design expert software. shows an optimum region which covered the requirement of the traced responses. Based on the selection criteria, MEs which have the smallest GS optical clarity, and the highest Q1, Q24 and ER were chosen. Upon assessment of the available solutions, desirability function was used to select the optimum composition. A ME formulation satisfying these criteria with a desirability of 0.868 had X1, X2 and X3 values of 5, 45 and 50%, respectively, which was the composition of formula F2 already employed in the design. The ME formula with the optimum composition had been prepared to be subjected to further processing and characterization.
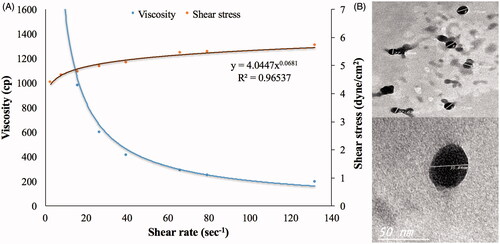
Figure 3. Rheological (A) and morphological (B) characteristics of the optimized ME gel formula.
Characterization of the ME gel formula
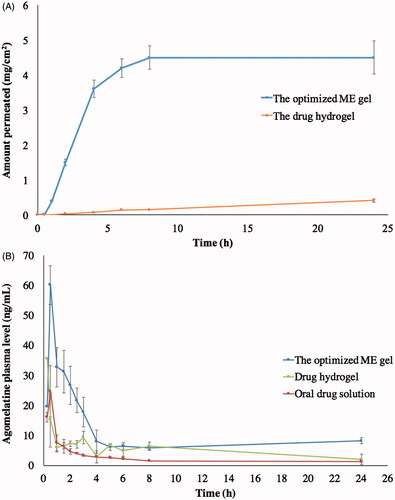
Globule size (35.82 nm) and optical clarity (0.012 nm) of the optimized formula had not been significantly altered after gelling (p value > .05). Significant enhancement of permeation was observed in case of the optimum ME gel relative to the drug suspended in carbopol gel, as demonstrated in , with Q1, Q24 and ER of 0.4, 4.5 mg/cm2 and 37.30, respectively. This might be due to the nano-size of the optimum formulation in addition to the presence of surfactant and cosurfactant which might lead to a significant disruption of the lipid bilayer present in the stratum corneum (Ustundag Okur et al., Citation2017). Regarding the rheological characteristics, viscosity of the ME gel formula decreased upon increasing rate of shear, as shown in . This was confirmed through the very low value of the flow index (0.0681) which revealed the shear thinning behavior of the investigated gel. This could be beneficial for physical stability of the dispersion minimizing the possibility of globule aggregation and size growth during storage. Furthermore, the decreased viscosity with rubbing could facilitate spreading of the applied gel to form a thin layer on the skin. Finally, viscosity would increase again after application keeping the drug in contact with the skin for longer time and sustaining the drug release from the globules (Abdelrahman et al., Citation2015).
Figure 4. Ex vivo (A) and in vivo (B) permeation profiles of optimized ME gel in comparison with the drug hydrogel and the oral drug solution.
Imaging by transmission electron microscope (TEM)
TEM imaging shows the ME gel globules in the range of 27–38 nm, as shown in , going in harmony with the Z-average measured by Zetasizer. The imaged globules were almost spherical with smooth surface. There was no observed aggregation indicating a good dispersibility of the ME globules. This might be referred to the reasonable ZP on the globules surfaces (Dehghani et al., Citation2017).
In vivo bioavailability of optimized ME gel formula
The mean agomelatine concentrations in rabbits’ plasma after administration of the optimum ME gel formula, agomelatine hydrogel and oral solution (reference) are displayed in . The optimum ME gel formula was found to have higher Cmax, AUC0–24 h, AUC0–∞ than the agomelatine hydrogel and oral solution, as shown in . These data were analyzed using SAS software (SAS Inc., Cary, NC) and the output indicates the significance difference between the test and the reference hydrogel in aspects of the AUC0–24 h, AUC0–∞ with p values of .0493 and .0146, respectively. On the other hand, the Cmax difference was non-significant between the two formulations (p value = .0839). Furthermore, the point estimates calculated for the Cmax, AUC0–24 h and AUC0–∞ were 236.41, 213.99 and 245.15%, respectively. These obtained findings could emphasize the superior ability of the optimized ME gel over the reference hydrogel to enhance the agomelatine transdermal permeability. On the other hand, oral agomelatine solution showed significantly lower Cmax, AUC0–24 h and AUC0–∞ than the transdermally applied either ME gel or hydrogel. This could be referred to the previously stated extensive 1st pass metabolism limiting the absolute bioavailability of oral agomelatine to be 5% only (Du et al., Citation2013). Moreover, the elimination half-life and the MRT of the optimal ME gel formula was significantly higher than the reference hydrogel (p value < .0001) indicating the sustainment of the drug permeation all over the experiment time (Elshafeey et al., Citation2009).
Table 2. Pharmacokinetic parameters of the optimized ME gel formula in comparison with the drug hydrogel and oral solution (A) and SAS analysis of Cmax, AUC0–24 h and AUC0–∞ (B).
Conclusions
In this study, ME components were screened and selected based on a stepwise pyramidal screening to ensure the selection of the most suitable oil, surfactant and cosurfactant for the incorporated drug. D-optimal mixture design was applied to obtain the optimal agomelatine loaded ME composition having the smallest GS and the highest optical clarity Q1, Q24 and ER. The optimized ME formulation was composed of 5% oil, 45% Smix (Cremophor RH40: Transcutol HP in ratio 1:2 w/w), 50% water. Ex vivo and in vivo permeation results could highlight that the optimized ME gel formula could be considered as a promising carrier for the transdermal delivery of agomelatine.
Disclosure statement
The authors confirm that this article content has no conflicts of interest.
Related Research Data
References
- Abdelrahman FE, Elsayed I, Gad MK, et al. (2015). Investigating the cubosomal ability for transnasal brain targeting: in vitro optimization, ex vivo permeation and in vivo biodistribution. Int J Pharm 490:281–91.
- Andrews G, Poulton R, Skoog I. (2005). Lifetime risk of depression: restricted to a minority or waiting for most? Br J Psychiatry 187:495–6.
- Anurag J, Bhatia MS, Shruti S, Pankaj K. (2010). Agomelatine: a new antidepressant with a novel mechanism of action. Delhi Psychiatry J 13:170–8.
- Azeem A, Khan ZI, Aqil M, et al. (2009a). Microemulsions as a surrogate carrier for dermal drug delivery. Drug Dev Ind Pharm 35:525–47.
- Azeem A, Rizwan M, Ahmad FJ, et al. (2009b). Nanoemulsion components screening and selection: a technical note. AAPS PharmSciTech 10:69–76.
- Balaguer-Fernandez C, Femenia-Font A, Muedra V, et al. (2010). Combined strategies for enhancing the transdermal absorption of midazolam through human skin. J Pharm Pharmacol 62:1096–102.
- Ban T. (2001). Pharmacotherapy of depression: a historical analysis. J Neural Transm (Vienna) 108:707–16.
- Barot BS, Parejiya PB, Patel HK, et al. (2012). Microemulsion gel of terbinane for the treatment of onychomycosis: optimization of based formulation using D-optimal design. AAPS PharmSciTech 13:184–92.
- Barton RR. 2013. Response surface methodology. In: Gass SI, Fu MC, eds. Encyclopedia of operations research and management science. Boston (MA): Springer, 1307–13.
- Basalious E, Shawky N, Badr-Eldin SM. (2010). SNEDDS containing bioenhancers for improvement of dissolution and oral absorption of lacidipine I: development and optimization. Int J Pharm 391:203–11.
- Biruss B, Dietl R, Valenta C. (2007). The influence of selected steroid hormones on the physicochemical behaviour of DPPC liposomes. Chem Phys Lipids 148:84–90.
- Chen H, Chang X, Weng T, et al. (2004). A study of microemulsion systems for transdermal delivery of triptolide. J Control Release 98:427–36.
- Choi K, Hong T, Lee J. (2014). On comparison of SAS codes with GLM and MIXED for the crossover studies with QT interval data. Transl Clin Pharmacol 22:78–82.
- Constantinides PP. (1995). Lipid microemulsions for improving drug dissolution and oral absorption: physical and biopharmaceutical aspects. Pharm Res 12:1561–72.
- Date AA, Nagarsenker MS. (2008). Design and evaluation of microemulsions for improved parenteral delivery of propofol. AAPS PharmSciTech 9:138–45.
- Dehghani F, Farhadian N, Golmohammadzadeh S, et al. (2017). Preparation, characterization and in-vivo evaluation of microemulsions containing tamoxifen citrate anti-cancer drug. Eur J Pharm Sci 96:479–89.
- Dempster EL, Wong CC, Lester KJ, et al. (2014). Genome-wide methylomic analysis of monozygotic twins discordant for adolescent depression. Biol Psychiatry 76:977–83.
- Du T, Rao S, Wu L, et al. (2015). An association study of the m6A genes with major depressive disorder in Chinese Han population. J Affect Disord 183:279–86.
- Du W, Zhou Y, Gong Y, Zhao C. (2013). Investigation of physicochemical properties and in-vitro in-vivo evaluation of agomelatine polymorphs. Asian J Pharm Sci 8:181–90.
- Elbary AA, Aboelwafa AA, Al Sharabi IM. (2011). Once daily, high-dose mesalazine controlled-release tablet for colonic delivery: optimization of formulation variables using Box–Behnken design. AAPS PharmSciTech 12:1454–64.
- Elshafeey AH, Kamel AO, Fathallah MM. (2009). Utility of nanosized microemulsion for transdermal delivery of tolterodine tartrate: ex-vivo permeation and in-vivo pharmacokinetic studies. Pharm Res 26:2446–53.
- Essa EA, Bonner MC, Barry BW. (2004). Electrically assisted skin delivery of liposomal estradiol; phospholipid as damage retardant. J Control Release 95:535–46.
- Georgeta C, Viceniu V, Ioana O, et al. (2015). Development and evaluation of new microemulsion based hydrogel formulations for topical delivery of fluconazole. AAPS PharmSciTech 16:889–904.
- Hua L, Weisan P, Jiayu L, Ying Z. (2004). Preparation, evaluation, and NMR characterization of vinpocetine microemulsion for transdermal delivery. Drug Dev Ind Pharm 30:657–66.
- Huang YB, Tsai YH, Yang WC, et al. (2004). Once-daily propranolol extended-release tablet dosage form: formulation design and in vitro/in vivo investigation. Eur J Pharm Biopharm 58:607–14.
- Kennedy SH, Emsley R. (2006). Placebo-controlled trial of agomelatine in the treatment of major depressive disorder. Eur Neuropsychopharmacol 16:93–100.
- Khurana S, Jain NK, Bedi PM. (2013). Nanoemulsion based gel for transdermal delivery of meloxicam: physico-chemical, mechanistic investigation. Life Sci 92:383–92.
- Lawrence MJ, Rees GD. (2012). Microemulsion based media as novel drug delivery systems. Adv Drug Deliv Rev 64:175–93.
- Lee PJ, Langer R. (2003). Novel microemulsion enhancer formulation for simultaneous transdermal delivery of hydrophilic and hydrophobic drugs. Pharm Res 20:264–9.
- Lehmann L, Keipert S, Gloor M. (2001). Effects of microemulsions on the stratum corneum and hydrocortisone penetration. Eur J Pharm Biopharm 52:129–36.
- Liu W, Hu M, Xue C, et al. (2008). Investigation of the carbopol gel of solid lipid nanoparticles for the transdermal ontophoretic delivery of triamcinolone acetonide acetate. Int J Pharm 264:135–41.
- Liu Y, Chen L, Ji Y. (2013). Quantification and structural elucidation of potential impurities in agomelatine active pharmaceutical ingredient. J Pharm Biomed Anal 81–82:193–201.
- Loo H, Hale A, D’haenen H. (2002). Determination of the dose of agomelatine, a melatoninergic agonist and selective 5-HT2C antagonist, in the treatment of major depressive disorder: a placebo-controlled dose range study. Int Clin Psychopharmacol 17:239–47.
- Magnusson BM, Koskinen LD. (2000). In vitro percutaneous penetration of topically applied capsaicin in relation to in vivo sensation responses. Int J Pharm 195:55–62.
- Mcneill SC, Potts RO, Francoeur ML. (1992). Local enhanced topical delivery (LETD) of drugs: does it truly exist? Pharm Res 9:1422–7.
- Millan MJ, Gobert A, Lejeune F, et al. (2003). The novel melatonin agonist agomelatine (S20098) is an antagonistat 5-hydroxytryptamine 2C receptors, blockade of which enhances the activity of frontocortical dopaminergic and adrenergic pathways. J Pharmacol Exp Ther 306:954–64.
- Montgomery SA. (2006). Major depressive disorders: clinical efficacy and tolerability of agomelatine, a new melatonergic agonist. Eur Neuropsychopharmacol 16:S633–S8.
- Morsi NM, Abdelbary GA, Ahmed MA. (2014). Silver sulfadiazine based cubosome hydrogels for topical treatment of burns: development and in vitro/in vivo characterization. Eur J Pharm Biopharm 86:178–89.
- Nair A, Vyas H, Shah J, Kumar A. (2011). Effect of permeation enhancers on the iontophoretic transport of metoprolol tartrate and the drug retention in skin. Drug Deliv 18:19–25.
- Nicoli S, Santi P, Couvreur P, et al. (2001). Design of triptorelin loaded nanospheres for transdermal iontophoretic administration. Int J Pharm 214:31–5.
- Paolino D, Ventura CA, Nistico S, et al. (2002). Lecithin microemulsions for the topical administration of ketoprofen: percutaneous adsorption through human skin and in vivo human skin tolerability. Int J Pharm 244:21–31.
- Peltola S, Saarinen-Savolainen P, Kiesvaara J, et al. (2003). Microemulsions for topical delivery of estradiol. Int J Pharm 254:99–107.
- Preskorn SH. (1997). Clinically relevant pharmacology of selective serotonin reuptake inhibitors. Clin Pharmacokinet 32:1–21.
- Raza K, Singh B, Singal P, et al. (2013b). Systematically optimized biocompatible isptretinoin-loaded solid lipid nanoparticles (SLNs) for topical treatment of acne. Colloids Surf B 105:67–74.
- Reagan-Shaw S, Nihal M, Ahmad N. (2008). Dose translation from animal to human studies revisited. FASEB J 22:659–61.
- Rouillon F. (2006). Efficacy and tolerance profile of agomelatine and practical use in depressed patients. Int Clin Psychopharmacol 21:S31–S5.
- Shah RR, Magdum CS, Wadkar KA, Naikwade NS. (2009). Fluconazole topical microemulsion: preparation and evaluation. Res J Pharm Tech 2:253–357.
- Spernath A, Aserin A, Ziserman L, et al. (2007). Phosphatidyl choline embedded microemulsions: physical properties and improved Caco-2 cell permeability. J Control Release 119:279–90.
- Tsai YH, Lee KF, Huang YB, et al. (2010). In vitro permeation and in vivo whitening effect of topical hesperetin microemulsion delivery system. Int J Pharm 388:257–62.
- Ustundag Okur N, Caglar ES, Arpa MD, Karasulu HY. (2017). Preparation and evaluation of novel microemulsion-based hydrogels for dermal delivery of benzocaine. Pharm Dev Technol 22:500–10.
- Vaghani SS, Gurjar M, Singh S, et al. (2010). Effect of iontophoresis and permeation enhancers on the permeation of an acyclovir gel. Curr Drug Deliv 7:329–33.
- Wagner H, Kostka KH, Lehr CM, Schaefer UF. (2000). Drug distribution in human skin using two different in vitro test systems: comparison with in vivo data. Pharm Res 17:1475–81.
- Wang RE, Huang YB, Wu PC, et al. (2007). The effect of iontophoresis and electroporation on transdermal delivery of indomethacin evaluated in vitro and in vivo. J Food Drug Anal 15:126–32.
- Wang X, Xue M, Gu J, et al. (2012). Transdermal microemulsion drug delivery system for impairing male reproductive toxicity and enhancing efficicacy of Tripterygium Wilfordii Hook f. Fitoterapia 83:690–8.
- White B, Banerjee S, O’brien S, et al. (2007). Zeta-potential measurements of surfactant-wrapped individual single-walled carbon nanotubes. J Phys Chem C 111:13684–90.
- Wu H, Ramachandran C, Bielinska AU, et al. (2001). Topical transfection using plasmid DNA in a water-in-oil nanoemulsion. Int J Pharm 221:23–34.
- Xi J, Chang Q, Chan CK, et al. (2009). Formulation development and bioavailability evaluation of a self-nanoemulsified drug delivery system of oleanolic acid. AAPS PharmSciTech 10:172–82.
- Xie WJ, Zhang YP, Xu J, et al. (2017). The effect and mechanism of transdermal penetration enhancement of Fu’s cupping therapy: new physical penetration technology for transdermal administration with traditional Chinese medicine (TCM) characteristics. Molecules 22:525.
- Xing MM, Hui X, Zhong W, et al. (2009). In vitro human topical bioactive drug transdermal absorption: estradiol. Cutan Ocul Toxicol 28:171–5.
- Ye F, Miao M, Lu K, et al. (2017). Structure and physicochemical properties for modified starch-based nanoparticle from different maize varieties. Food Hydrocoll 67:37–44.
- Yuan Y, Li SM, Mo FK, Zhong DF. (2006). Investigation of microemulsion system for transdermal delivery of meloxicam. Int J Pharm 321:23–117.
- Zupancic M, Guilleminault C. (2006). Agomelatine: a preliminary review of a new antidepressant. CNS Drugs 20:981–92.