
 ?Mathematical formulae have been encoded as MathML and are displayed in this HTML version using MathJax in order to improve their display. Uncheck the box to turn MathJax off. This feature requires Javascript. Click on a formula to zoom.
Abstract
The development of imaging-guided smart drug delivery systems for combinational photodynamic/chemotherapy of the tumor has become highly demanded in oncology. Herein, redox-responsive theranostic polymeric nanoparticles (NPs) were fabricated innovatively using low molecular weight heparin (LWMH) as the backbone. Chlorin e6 (Ce6) and alpha-tocopherol succinate (TOS) were conjugated to LMWH via cystamine as the redox-sensitive linker, forming amphiphilic Ce6-LMWH-TOS (CHT) polymer, which could self-assemble into NPs in water and encapsulate paclitaxel (PTX) inside the inner core (PTX/CHT NPs). The enhanced near-infrared (NIR) fluorescence intensity and reactive oxygen species (ROS) generation of Ce6 were observed in a reductive environment, suggesting the cystamine-switched “ON/OFF” of Ce6. Also, the in vitro release of PTX exhibited a redox-triggered profile. MCF-7 cells showed a dramatically higher uptake of Ce6 delivered by CHT NPs compared with free Ce6. The improved therapeutic effect of PTX/CHT NPs compared with mono-photodynamic or mono-chemotherapy was observed in vitro via MTT and apoptosis assays. Also, the PTX/CHT NPs exhibited a significantly better in anti-tumor efficiency upon NIR irradiation according to the results of in vivo combination therapy conducted on 4T1-tumor-bearing mice. The in vivo NIR fluorescence capacity of CHT NPs was also evaluated in tumor-bearing nude mice, implying that the CHT NPs could enhance the accumulation and retention of Ce6 in tumor foci compared with free Ce6. Interestingly, the anti-metastasis activity of CHT NPs was observed against MCF-7 cells by a wound healing assay, which was comparable to LMWH, suggesting LMWH was promising for construction of nanocarriers for cancer management.
1. Introduction
As the most common treatment of cancer, traditional chemotherapy has been considered to exhibit numerous drawbacks, such as unsatisfying therapeutic efficiency and severe side effects (Chen et al., Citation2015), which might be largely attributed to the nonspecificity of drugs. To alleviate these problems, the fabrication of novel nanoplatforms has been widely explored in oncology in view of their favorable features, e.g. the possibility to increase the solubility of drugs in a water-based environment, the protection effect of the delivered cargoes in circulation, the enhanced accumulation at tumor sites via passive or/and active targeting and the controllable release profile at targeted sites. Besides, the combination of other treatment strategies with chemotherapy provides an alternative strategy for an enhanced synergetic anti-cancer therapeutic effect. For instance, photodynamic (Peng et al., Citation2009; He et al., Citation2015; Fan et al., Citation2016; He et al., Citation2016; Zhang et al., Citation2016b; Lee et al., Citation2017), photothermal (Zheng et al., Citation2013; Zhao et al., Citation2015; Tu et al., Citation2016; Li et al., Citation2017; Yang et al., Citation2017c), and gene therapies (Xiao et al., Citation2016; Zhou et al., Citation2016; Zhao et al., Citation2017) have been successfully combined with chemotherapy by developing advanced nanovehicles.
Photodynamic therapy (PDT) has been considered an effective treatment modality against malignant and nonmalignant cancers, wherein photosensitizers, specific light sources, and oxygen are required (Spring et al., Citation2015; Calixto et al., Citation2016). Following the administration of photosensitizers, the tumor foci is irradiated by light with a specific wavelength and the reactive oxygen species (ROS) generated by photosensitizers in situ will induce the apoptosis and/or necrosis of tumor cells (Avci et al., Citation2014). In addition, since photosensitizers could also emit fluorescence signals upon light excitation, they can be utilized as a contrast agent for tumor NIR imaging (Hou et al., Citation2016b). As of today, the application of PDT has still been largely limited by the low solubility and poor selectivity of photosensitizers (Calixto et al., Citation2016; Huang et al., Citation2017), which might be alleviated by nanotechnology.
As a second-generation photosensitizer extensively applied in PDT, chlorin e6 (Ce6) was chosen as the investigated photosensitizer in this study considering its low cytotoxicity, deep penetration into tissues and high ROS yield (Juzeniene, Citation2009). Among various advanced nanovehicles for Ce6 delivery, polymeric NP represented one of the most explored categories; and a wide range of materials, e.g. polylactide (PLA) (Kumari et al., Citation2017), poly(ε-caprolactone) (PCL) (Peng et al., Citation2008), poly(lactic-co-glycolic acid) (PLGA) (Park et al., Citation2017), Pluronic (Park & Na, Citation2013; Park et al., Citation2014), polyphosphoester (Ding et al., Citation2015), hyaluronic acid (Li et al., Citation2016), dextran (Liu et al., Citation2014), and chondroitin sulfate (Park et al., Citation2016) have been employed. Ce6 could be introduced to these polymeric nanosystems either by being chemically conjugated to the polymers or physically encapsulated into NPs. According to the work of Lee et al. (Citation2011), Ce6-conjugated NPs were more capable to prolong the in vivo circulation of Ce6 and to enhance its tumor accumulation compared with the Ce6-encapsulated ones, which might be attributed to the higher stability and reduced premature Ce6 release of a Ce6-conjugated system. Also, it should be noted that for Ce6-containing polymeric NPs, the Ce6 molecules aggregated in the core would exhibit dramatically reduced PDT and the NIR imaging efficiency via a self-quenching effect, which has been considered to be advantageous to reduced side effects in circulation. That is to say, if Ce6 failed to be timely released in tumor foci, the PDT efficiency will be largely limited. Therefore, an ideal nanoplatforms for PDT should be self-quenched in circulation, while being dequenched in targeted sites (Liu et al., Citation2014). Regarding this, some smart nanoplatforms based on Ce6 conjugated polymers have been fabricated for smart PDT, which could keep stable and quench the Ce6 in circulation while dequenching the Ce6 in targeted sites in response to e.g. pH (Lee & Na, Citation2014), redox potential (Liu et al., Citation2014; Hou et al., Citation2016a), enzyme (Li et al., Citation2016), light (Park et al., Citation2016), and ROS (Kim et al., Citation2013). The basis of the development of redox-sensitive nanosystems is the significant variations of redox potential between intra- and extra-cellular environment; specifically, the concentration of reductive glutathione (GSH) is 1–10 mM in tumor cells, while 2–20 μM in extracellular space (Torchilin, Citation2014; Dong et al., Citation2016).
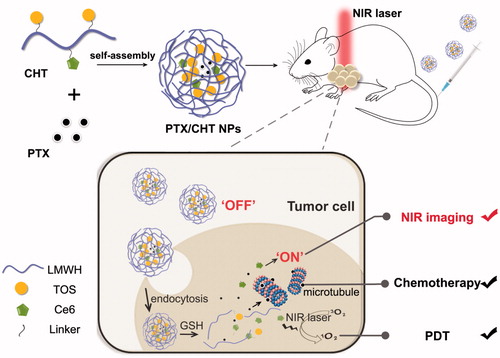
Taken all together, the aim of this work is to fabricate a redox-responsive theranostic nanoplatform, which could realize an effective NIR imaging-guided combinational photodynamic/chemotherapy in a redox-triggered manner. In this study, low molecular weight heparin (LMWH) was innovatively utilized as the main component of the smart polymeric nanoplatform considering its non-toxicity, anti-metastasis, and anti-angiogenesis properties (Mei et al., Citation2016, Citation2017; Yang et al., Citation2017b ). As depicted in , Ce6 was conjugated to LMWH backbone via cystamine, which could endow the nanosystem a redox-responsive property due to the presence of disulfide bond. Although the LWMH-Ce6 conjugate could self-assemble into NPs with a diameter of ∼200 nm according to our preliminary work, the drug loading content of paclitaxel (PTX) in the resultant NP is too low to guarantee an effective chemotherapy (data not shown); therefore, alpha-tocopherol succinate (TOS) was also introduced to the system, which has been proved as a good depot for PTX in our previous work (Yang et al., Citation2017a). The resultant Ce6-LMWH-TOS (CHT) conjugate could self-assemble into NPs with PTX encapsulated into the inner core and the accumulated Ce6 in an ‘OFF’ state. After intravenous injection of the PTX-loaded CHT NPs (PTX/CHT NPs) to tumor-bearing mice, it was expected that the NPs would accumulate in tumor foci due to the enhanced permeability and retention (EPR) effect, which were subsequently internalized by tumor cells and destroyed by the abundant GSH in cells as thanks to the cleavage of disulfide bonds; as a result, the released PTX could exert an enhanced cell-killing effect and the released Ce6 could be switched to ‘ON’ state for NIR imaging and more efficiently generate ROS upon irradiation of tumor site (shown in ).
Figure 1. Schematic illustration of the preparation of PTX/CHT NPs and their application in tumor NIR fluorescence imaging and synergistic photodynamic/chemotherapy.
In the present study, the physicochemical properties, e.g. the size and its distribution, zeta potential, morphology, and stability, were detailed. Also, the anti-metastasis capacity of CHT NPs was preliminarily evaluated via a well-established wound healing assay, implying that the CHT NPs could well preserve the anti-metastasis activity of LMWH. Further, the redox-sensitivity of the nanosystem was confirmed by the morphology change of NPs after incubation in a reductive environment, the redox-triggered release of PTX as well as the recovery of Ce6 activity (both ROS generation and NIR imaging abilities) in response to the reductive condition. The cellular uptake behavior and intracellular distribution of CHT NPs were also investigated, implying that the cellular uptake of Ce6 could be enhanced when it was delivered by CHT NPs compared with free Ce6. The combinational anti-cancer effect of the nanosystem was demonstrated in vitro against MCF-7 cells by MTT and apoptosis assays, which was further confirmed in vivo in 4T1-tumor-bearing BALB/c mice. Besides, the in vivo tumor imaging ability of the nanoplatform was evaluated in tumor-bearing mice. As suggested by the results of this work, the redox-responsive PTX/CHT NPs successfully integrated the chemotherapy effect of PTX, PDT and NIR imaging capacities of Ce6, displaying great potential for smart NIR imaging-guided tumor combinational therapy.
2. Materials and methods
2.1. Materials
Enoxaparin sodium (MW = 4350 Da) was supplied by Hong ruikang Reagent Co., Ltd. (Wuhan, China). dl-α-tocopherol succinate (TOS), N-(3-dimethylaminopropyl)-N’-carbodiimide hydrochloride (EDCI), and N-hydroxysuccinimide (NHS) were purchased from Aladdin Industrial Co., Ltd. (Shanghai, China). Chlorine e6 (Ce6) was obtained from J&K Scientific Ltd. (China). Dialysis bag (MWCO = 3500 Da), thiazolyl blue tetrazolium bromide (MTT), 4,6-diamino-2-phenylindole (DAPI) and paraformaldehyde were bought from Solarbio Science & Technology Co., Ltd. (Beijing, China). Annexin V-FITC/PI double staining assay kit was obtained from Dojindo Molecular Technologies, Inc. (Japan). Fetal bovine serum was purchased from Tianhang Biological Technology Stock Co., Ltd. (Hangzhou, China). Dulbecco’s modified Eagle’s medium with high glucose level (DMEM) and RPMI-1640 medium was bought from Thermo Fisher Scientific Co. Ltd (China). All chemical reagents were of analytical or higher grade and directly applied without further purification.
2.2. Cell lines and culture conditions
Both human breast cancer cells (MCF-7) and mouse metastatic breast cancer cells (4T1) were maintained in standard cell culture condition (37 °C, 5% CO2, in humidified incubator). MCF-7 cells were cultured in DMEM medium supplemented with 10% FBS and 1% penicillin/streptomycin, and 4T1 cells were incubated in RPMI-1640 medium supplemented with 10% FBS and 1% penicillin/streptomycin.
2.3. Synthesis of Ce6-LWMH-TOS (CHT)
First, TOS was conjugated to LMWH chains with cystamine as the redox-sensitive linker, which has been reported in our previous work (Yang et al., Citation2017a). Ce6 was then conjugated to the unreacted amine groups of cystamine on LMWH chains via EDC/NHS chemistry. Briefly, different amount of Ce6 (1, 2, or 3 mg, 1 equiv.), EDCI (5 equiv.), and NHS (5 equiv.) were respectively dissolved in dimethylformamide (DMF), which were allowed to stir for 15 min to activate the carboxyl groups. The resultant mixtures containing 1, 2, or 3 mg of Ce6 were subsequently introduced to formamide solution containing 10 mg of LWMH-cys-TOS under agitation, respectively. After stirring for 48 h at room temperature, the reaction solution samples were dialyzed against a mixture of DMSO/H2O (6:1) for 3 days and then distilled water for another 3 days (MWCO = 3500 Da). The final product of CHT was obtained after lyophilization of the resultant solution.
2.4. Structure characterization of CHT
The chemical structure of CHT was verified by 1H NMR spectroscopy (400 MHz, AVANCE III, Bruker, Germany). 1H-NMR spectra were recorded on Ce6 d6-DMSO solution, CHT d6-DMSO/D2O (6:1, v/v) solution, and CHT D2O dispersion. The UV-visible absorption spectra of free Ce6 and CHT in DMSO/H2O (6:1) were recorded using a UV–visible spectrophotometer (UV-2102, Shanghai Instrument Ltd, China). To calculate the introduction ratio of Ce6 to LMWH backbone, the absorbance of the CHT DMSO/H2O solution at 401 nm was measured by a UV–visible spectrophotometer (UV-2102, Shanghai Instrument Ltd, China).
2.5. Preparation of self-assembled nanoparticles based on CHT (CHT NPs)
2.5.1. Preparation of blank CHT NPs
Drug-free CHT NPs were prepared by a simple sonication method. Briefly, 3 mg of CHT polymer was dispersed in 3 mL of phosphate buffered saline (PBS, pH 7.4, 10 mM) under stirring, which was then sonicated at 40 W for 4 min (2 s on, 4 s off) using a YM-150Y probe-type sonifier (Yuming Instrument CO., Ltd., Shanghai, China). After filtration of the resultant solution through a 0.8 μm membrane, blank CHT NP solution was obtained.
2.5.2. Preparation of PTX-loaded CHT NPs (PTX/CHT NPs)
A modified dialysis method was utilized to prepare PTX/CHT NPs (Yang et al., Citation2017a). Briefly, PBS (pH 7.4, 10 mM) containing CHT polymer was stirred for 1 h, followed the addition of PTX methanol solution. After another 0.5 h of stirring, the mixture was sonicated with a probe-type sonifier at 40 W for 4 min (2 s on, 4 s off), which was subsequently dialyzed against water for 24 h to thoroughly remove the methanol (MWCO = 3500 Da). Afterwards, the dialyzed solution was centrifugation at 4000 rpm for 10 min and filtered through a 0.8 μm membrane to remove any precipitated PTX or polymer. The resultant PTX/CHT NP solution was stored at 4 °C in dark before use.
The concentration of PTX in PTX/CHT NPs was analyzed by high-performance liquid chromatography (HPLC, 1200 series, Agilent Technologies, Santa Clara, CA) as described in our previous study (Yang et al., Citation2017a). The drug loading content (DL) and entrapment efficiency (EE) of PTX were calculated according to the following equations.
2.6. Characterization of CHT NPs
Dynamic light scattering (DLS) measurements on both drug-free CHT NP and PTX/CHT NP dispersions were performed at 25 °C using a Zetasizer Nano-ZS Instrument (Malvern Instruments Ltd., UK). The morphology of NPs was observed by using a transmission electron microscope (TEM) after staining with phosphotungstic acid (2%, w/v).
To preliminarily evaluate the stability of PTX/CHT NPs, the size and size distribution of different formulations were measured before and after 24 and 48 h of incubation under gentle shake (100 rpm) at 37 °C.
2.7. Redox-responsive behaviors of CHT NPs
2.7.1. TEM observation
To visually observe the reduction-triggered destabilization of CHT NPs, TEM was employed to capture the morphology changes of CHT NPs after incubation with 20 mM dithiothreitol (DTT) under shake (100 rpm) at 37 °C.
2.7.2. Recovery of NIR fluorescence in the reductive environment
CHT PBS dispersion (5 μg/mL of equivalent Ce6) was shaken at 100 rpm at 37 °C in the presence of 20 mM DTT. After 2 and 4 h of DTT treatment, the fluorescence emission spectra of CHT dispersion were recorded by a fluorescence spectrophotometer (F-7000, Hitachi, Japan); the spectra of CHT PBS dispersion before DTT treatment and Ce6 PBS solution (5 μg/mL) were also measured for comparison to evaluate the NIR fluorescence recovery of Ce6.
2.7.3. Measurement of singlet oxygen generation
9,10-Dimethylanthracene (DMA) was utilized as a fast chemical trap of singlet oxygen, which was mixed with Ce6 solution (5 μg/mL of equivalent Ce6), CHT NPs (5 μg/mL of equivalent Ce6), and CHT NPs (5 μg/mL of equivalent Ce6) treated with DTT (20 mM) to reach a final DMA concentration of 20 μM. The obtained solution was irradiated using a 660 nm laser source (MW-GX-660, Changchun Laser Optoelectronics Technology Co., Ltd., China) for 10 min. After 1 h, the fluorescence emission spectra of DMA (emission wavelength: 380–550 nm) was monitored using a fluorescence spectrophotometer (F-7000, Hitachi, Japan) at the excitation wavelength of 360 nm.
2.7.4. Redox-triggered release of PTX
The release profiles of PTX from PTX/CHT NPs in the presence of DTT or not were investigated using a dialysis method. Briefly, 1 mL of PTX/CHT NP dispersion was sealed in dialysis bag (MWCO = 3500 Da), which was then immersed in PBS (pH 7.4, 10 mM) with 0.2% Tween 80 containing DTT (20 mM or 20 μM) or not and gently shaken at 100 rpm at 37 °C (Chuan et al., Citation2014; Yang et al., Citation2014; Ai et al., Citation2015). At designed time intervals, 0.5 mL of the release medium was taken out from each sample and an equal amount of fresh medium was added. The amount of released PTX in release medium was analyzed by HPLC (1200 series, Agilent Technologies, Santa Clara, CA) as reported in our previous work (Yang et al., Citation2017a).
2.8. Cellular uptake and intracellular distribution of CHT NPs
2.8.1. Confocal laser scanning microscopy (CLSM) observation
CLSM was used to detect the cellular uptake and intracellular distribution of CHT NPs in MCF-7 cells. Cells were seeded in confocal dishes at a density of 1.5 × 10⁵ cells dish and cultured for 12 h for cell attachment. The medium was then replaced with fresh medium containing Ce6 solution or CHT NPs (5 μg/mL of Ce6 equivalents), separately. After 1, 2, or 4 h of incubation, the Ce6-containing medium was removed and the cells were rinsed thrice with PBS (pH = 7.4, 10 mM). Afterward, the cells were fixed with 4% paraformaldehyde for 15 min, followed by the staining of nuclei with DAPI according to the manufacturer’s instruction. Finally, the cells were observed using CLSM (LSM780, Carl Zeiss AG, Germany).
2.8.2. Flow cytometry (FCM) analysis
FCM was employed to quantify the internalization of Ce6. MCF-7 Cells were seeded in 24-well plate at a density of 8 × 10⁴ cells per well and cultured for 12 h until cell attachment. Then the medium was replaced with fresh medium containing Ce6 solution or CHT NPs (5 μg/mL of Ce6 equivalents), separately. After 1, 2, or 4 h of incubation, cells were rinsed with PBS (pH = 7.4, 10 mM) thrice, trypsinized and resuspended with 0.15 mL of PBS (pH = 7.4, 10 mM) for FCM (FACSCalibur, BD Biosciences, San Jose, CA) measurement. The fluorescence signal of Ce6 was collected using FL3-H channel.
2.9. In vitro cytotoxicity study
The dark toxicity and phototoxicity of drug-free CHT NPs against MCF-7 cells were studied by MTT assay. In brief, MCF-7 cells were seeded in 96-well plate at a density of 5×10³ cells/well and incubated overnight. Afterward, the culture medium was replaced with fresh medium, fresh medium containing free Ce6 (0.5, 1, 2.5, and 5 μg/mL) or fresh medium containing blank CHT NPs (equivalent Ce6: 0.5, 1, 2.5, and 5 μg/mL), respectively. After 24 h of co-incubation, the cells were washed thrice with PBS (pH 7.4, 10 mM) and 150 μL of fresh medium was added to each well. For the plates with NIR irradiation, each well was irradiated with a 660 nm laser source (MW-GX-660, Changchun Laser Optoelectronics Technology Co., Ltd., China) at a power density of 50 mW/cm2 for 1 min; after NIR irradiation, the cells were further incubated for 24 h. The plates for dark treatment were also incubated for another 24 h in dark. After incubation, a standard MTT assay was carried out. Finally, the optical density (OD) values at 490 nm of each well were measured using a microplate reader (ELx800, Bio Tek Instruments, Inc., Highland Park, IL) and the cell viability was calculated according to the following formula.
To study the combination therapy, MCF-7 cells were incubated with Taxol and PTX/CHT NPs with serial concentrations of PTX (ranging from 0.001 to 10 μg/mL) for 24 h. Subsequently, the cells were washed thrice with PBS (pH 7.4, 10 mM) and 150 μL of fresh medium was added to each well. The cells in PTX/CHT NP plus NIR group were irradiated by a laser of 660 nm at a power density of 50 mW/cm2 for 1 min. After another 24 h of incubation, the MTT assay was carried out and the cell viability was calculated.
2.10. Apoptosis assay
To further evaluate the apoptosis-inducing capacity of different formulations with or without NIR irradiation in vitro, apoptosis assay was conducted using an Annexin V-FITC/PI double staining assay kit. MCF-7 cells were seeded in 24-well plate at a density of 1 × 10⁵ cells per well, followed by 12 h of incubation until cell attachment. The cells were then incubated with fresh medium, Ce6 solution (1.34 μg/mL), CHT NPs (1.34 μg/mL of Ce6 equivalents) or PTX/CHT NPs (1.34 μg/mL of Ce6 equivalents, 10 μg/mL of PTX). After 12 h of incubation, the cells were washed twice by 1 × PBS and the medium was replaced by fresh medium, followed by NIR irradiation (50 mW/cm2, 2 min) or not. The cells were further incubated in dark for 4 h before trypsinization, collection and staining according to the manufacturer’s instruction. For quantitative assessment, the stained MCF-7 cells were analyzed by FCM (FACSCalibur, BD Biosciences, San Jose, CA) and data analysis was performed using FlowJo 7.6.1 (Tree Star, Ashland, OR). All experiments were performed in triplicate.
2.11. Wound healing assay
The migration ability of MCF-7 cells was assessed by a well-established wound healing assay (Mei et al., Citation2016; Fan et al., Citation2017). MCF-7 cells were seeded at a density of 2 × 10⁵ cells per well in a 12-well plate and incubated until 90% confluency. Then, a straight line was scratched with a 200 μL sterile pipette tip and the cells were rinsed with PBS (pH 7.4, 10 mM) to remove detached cells. Cells were further incubated with DMEM culture medium (controlled group), LMWH (0.25 mg/mL) or CHT (0.25 mg/mL). At 0 h and 24 h, the width of the open wound was captured with an optical microscope (Olympus, Japan); the relative wound width of cells treated with different formulations at 24 h was compared to that at 0 h (n = 3).
2.12. In vivo and ex vivo NIR imaging of CHT NPs
Female BALB/c nude mice (4–6 weeks) were purchased from Beijing Huafukang Biological Technology Co Ltd. (Beijing, China) and kept under standard condition. All animal experiments were performed under protocols approved by Shandong University Laboratory Animal Center. Tumor-bearing mice were developed by subcutaneously injecting of 2 × 10⁶ MCF-7 cells suspended in 100 μL of PBS (pH 7.4, 10 mM) into the oxter of mice. When the volume of tumors reached ∼100 mm3, the mice were intravenously administrated free Ce6 or CHT NP solution at 4 mg/kg of the Ce6 dose. At pre-determined time intervals, the mice were anesthetized in a Xenogen XGI-8 Gas Anesthesia apparatus (Caliper Life Science, Hopkinton, MA) and scanned using the Xenogen IVIS Lumina System (Caliper Life Science, USA). After 24 h, the mice were sacrificed and major organs (i.e. heart, liver, spleen, lung, and kidney), as well as tumors, were harvested for ex vivo imaging. All data were analyzed using Living Image 4.1 software (Caliper Life Science, Hopkinton, MA).
2.13. In vivo combination therapy and safety evaluation
Female BALB/c mice (4–6 weeks) were subcutaneously inoculate 1 × 10⁶ 4T1 cells suspended in 100 μL of PBS (pH 7.4, 10 mM). When the tumor volume reached ∼100 mm3, the 4T1-bearing mice were randomly divided into five groups (n = 5), receiving different treatment: (1) normal saline (NS), (2) free Ce6 (2.4 mg/kg) plus NIR irradiation, (3) Taxol (16.6 mg/kg of PTX equivalents), (4) PTX/CHT NPs (2.4 mg/kg of Ce6 equivalents, 16.6 mg/kg of PTX equivalents), and (5) PTX/CHT (2.4 mg/kg of Ce6 equivalents, 16.6 mg/kg of PTX equivalents) plus NIR irradiation. For the NIR-treated groups, a 660 nm laser (200 mW/cm2, 15 min) was employed 1 h and 24 h after injection. The maximum length (a) and minimal width (b) of tumors were measured using a caliper and the tumor volume was calculated according to the following formula.
For preliminary safety evaluation, the mice were weighed every 2 days with an electronic balance. On the 14th-day post-treatment, mice were sacrificed and the major organs (i.e. heart, liver, spleen, lung, and kidney), as well as the tumors, were excised and fixed with 4% (w/v) paraformaldehyde for histopathological examination after H&E staining.
2.14. Statistical analysis
The results were shown as the mean ± standard deviation (S.D.). The data evaluation for statistical significance was carried out using one-way ANOVA analysis. It was considered significant when p < .05 and highly significant when p < .01.
3. Results and discussion
3.1. Synthesis and structure characterization of CHT
LMWH-cys-TOS was synthesized according to our previously-reported procedures before the further conjugation of Ce6 via EDC/NHS chemistry (Yang et al., Citation2017a); the synthesis procedure of Ce6 conjugation was depicted in . By altering the feed ratio of cystamine modified LMWH to TOS, as well as LMWH-cys-TOS to Ce6, a library of CHT polymers were synthesized with the Ce6 content ranging from 1.88% to 22.60% (wt %) (). At the same feed ratio of LMWH-cys-TOS to Ce6, the Ce6 contents in CHT 4,5,6 were much higher than those in CHT 1, 2, 3 (3.03 vs. 1.88, 7.42 versus 3.89 and 22.6 versus 7.89). This could be easily ascribed to the fact that more amine groups were available for Ce6 conjugation when less TOS consume the amine groups of LWMH-cys.
Figure 2. (A) Synthesis route of CHT. (B) 1H-NMR spectra of Ce6 in d6-DMSO (a), CHT dissolved in d6-DMSO/D2O (b) and CHT dispersed in D2O (c). (C) UV-visible absorption spectra of Ce6 solution and CHT NPs. (D) TEM images of CHT NPs based on CHT polymers with different degrees of TOS and Ce6 contents (CHT 1–6, detailed in ).
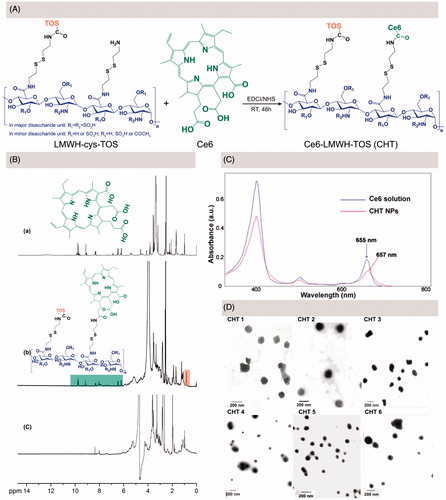
Table 1. Characterization of CHT polymers and CHT-based NPs with variable degrees of TOS and Ce6 contents.
The chemical structure of CHT was confirmed by 1H NMR using a d6-DMSO/D2O mixed solvent. As shown in , the peak at 0.8 ppm corresponded to the methyl hydrogen in TOS molecule, which has been demonstrated in our previous work (Yang et al., Citation2017a); and the appearance of Ce6 characteristic peaks suggested the successful conjugation of Ce6 onto LWMH-cys-TOS, which was in accordance with previous reports (Li & Na, Citation2011; Liu et al., Citation2014). Further, the 1H NMR spectrum of CHT dispersed in D2O was recorded (); the disappearance of Ce6 and TOS peaks could be interpreted as being due to the core-shell structure of CHT NPs spontaneously formed in D2O, wherein Ce6 and TOS were anchored inside the core in view of their strong hydrophobicity. The successful conjugation of Ce6 onto LMWH backbone could be further confirmed by the bathochromic shift of UV-Vis absorbance (from 655 nm for free Ce6 to 657 nm for CHT NPs, shown in ), which may be caused by the change of Ce6 environment (Hou et al., Citation2016a).
3.2. Preparation and characterization of CHT NPs and PTX/CHT NPs
Drug-free CHT NPs were prepared by a simple sonication method, the particle size, PDI, and zeta potential of which were shown in . When the content of Ce6 increased from 1.88% (CHT 1) to 3.89% (CHT 2), the particle size decreased from 136.93 to 106.67 nm; A similar trend could also be observed when comparing the size of CHT 4 and CHT 5. This was likely due to the formation of the more compact hydrophobic inner core when introducing more hydrophobic Ce6 groups. The TEM images of these CHT NPs were shown in , indicating the ability of all the CHT polymers to self-assemble into nanospheres in aqueous solution; and the sizes estimated by TEM were smaller than those measured by DLS because of the different sample preparation methods. CHT 2 seemed more promising for the nanoplatform construction considering the relatively small size, appropriate zeta potential and uniform spherical morphology of CHT 2 NPs.
To further evaluate the drug-loading ability of different CHT polymers, PTX-loaded CHT NPs were prepared via a well-established ultrasound-dialysis procedure at a different feed ratio of PTX to polymer () (Zhang et al., Citation2016a; Yang et al., Citation2017a). The DL and EE values of different formulations were calculated and considered as important parameters to screen the optimum formulation. For each kind of CHT polymer, the DL values saw a rise in the increase of the PTX/polymer ratio. For CHT 2, 4, 5, and 6, the EE values increased when PTX/polymer ratio increased; however, for CHT 1 and 3, the increase of PTX/polymer from 6:20 to 9:20 ratio failed to further increase the EE value. Moreover, it could be found that CHT 3 performed better than CHT 5 in loading PTX in view of the higher DL values; and the same trend was also observed when comparing the DL values of CHT 2-based formulations with those of CHT 4-based formulation. The reasonability of this comparison was based on the similar Ce6 content of CHT 3 and 5 (7.89 and 7.42%), CHT 2 and 4 (3.89 and 3.03%); that is to say, the main difference between these CHT polymers lay in the different DS (degree of substitution) values of TOS (3.48 for CHT 2 and 3, 1.42 for CHT 4 and 5, which were reported in our previous work (Yang et al., Citation2017a)). Therefore, it could be concluded that a higher TOS content was more favorable for a better loading capacity of PTX; also, these results further confirm the necessity of TOS incorporation to realize the efficient PTX loading. Further, the size and PDI changes of formulation 3, 6, 9, 12, 15, and 18 over 48 h were recorded to preliminarily evaluate the stability of PTX-loaded formulations based on different polymers (). Except for the obvious increase of the particle size of Formulation 3, there were no obvious changes in size and PDI for all other formulations during 48 h of incubation. Finally, Formulation 6 was chosen as the optimized one and CHT 2 was used for the preparation of both PTX-free and PTX-loaded CHT NPs in the following experiments. The mean diameter of the optimized PTX/CHT NPs was 211.63 ± 3.16 nm (PDI = 0.211 ± 0.07) and a representative size distribution graph was shown in ). The TEM image of the optimized PTX/CHT NPs was shown in ), suggesting the spherical shape and uniform size distribution of the NPs. Besides, the zeta potential was −19.9 ± 0.50 mV, implying the desirable stability of the optimized formulation.
Figure 3. (A) size (a) and PDI (b) changes of PTX/CHT NPs after the different time of incubation in PBS (pH 7.4, 10 mM). (B) Size distribution (a), photograph (b) and TEM image of PTX/CHT NPs (Formulation 6). Data were represented as mean ± SD (n = 3).
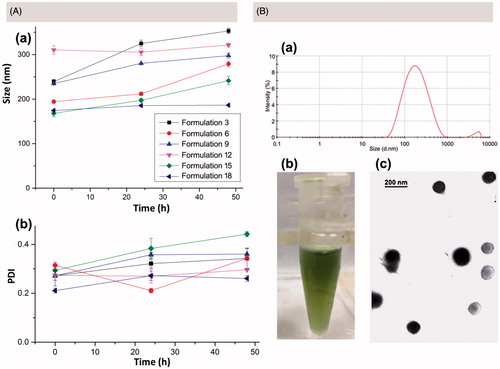
Table 2. Evaluation of the PTX loading capacity of different CHT polymers with DL (%) and EE (%) as indexes.
3.3. Redox-responsive behaviors of CHT NPs
To demonstrate the redox-sensitivity of CHT NPs, a series of experiments were performed. First, the morphology change of NPs was observed using TEM after 24 h of DTT treatment (20 mM). As shown in , CHT NPs showed irregular shape compared with non-treated ones; pieces of fragments and accumulation could be found easily, which were resulted from the disassembly of CHT NPs.
Figure 4. In vitro redox-responsive behaviors of CHT NPs. (A) TEM image of CHT NPs before (left) and after (right) 24 h of DTT incubation (20 mM) (scale bar: 200 emission spectra of DMA in different Ce6-containing formulations at an excitation wavelength of 360 nm. (D) In vitro release profiles of PTX from CHT NPs in the nm). (B) Fluorescence emission spectra of Ce6 in PBS (pH 7.4, 10 mM) with or without DTT incubation (excitation wavelength: 405 nm). (C) The fluorescence absence and presence of DTT (20 μM or 20 mM). Data were represented as mean ± SD (n = 3).
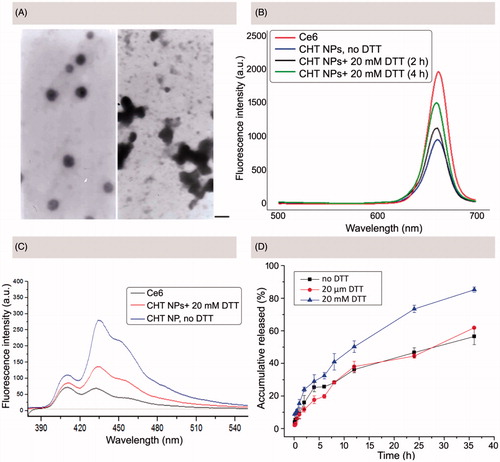
As depicted in , the NIR fluorescence and ROS generation of Ce6 would be largely reduced via a self-quenching effect of the aggregated Ce6 (Hou et al., Citation2016a). It was assumed that the fabricated CHT NPs could keep intact in circulation, wherein the conjugated Ce6 was quenched, while quickly disassembling and triggering the de-quenching of Ce6 in targeted cells (shown in ). To test the assumption, both the recovery of Ce6 NIR fluorescence intensity and ROS generation ability were evaluated.
To evaluate the redox-responsive ‘OFF/ON’ switch of CHP NPs, the Ce6 fluorescence intensity changes of CHT NPs were recorded in the presence or absence of DTT using a fluorescence spectrophotometer. As shown in , CHT NPs without DTT treatment displayed a low Ce6 fluorescence intensity compared with free Ce6. After 2 h of DTT incubation (20 mM), the intensity of Ce6 fluorescence was partly recovered, which was further increased after 4 h of DTT incubation. Although the intensity was not fully recovered during experiment period compared with free Ce6 possibly due to the incomplete cleavage of disulfide bonds, the dramatically increased Ce6 fluorescence intensity could well demonstrate the recovered Ce6 NIR fluorescence intensity in response to a reductive environment.
As described in previous work, a series of photo-reactions were involved in the process of singlet oxygen generation as summarized below (Macdonald & Dougherty, Citation2001; Debele et al., Citation2015; Obaid et al., Citation2016). First, the photosensitizer in its ground singlet state would reach the excited singlet state after the absorption of light; then, the photosensitizer would move from the excited singlet state to an excited triplet state after intersystem crossing; finally, the photosensitizer in its excited triplet state could react with biomolecules or molecular oxygen, thus generating ROS of Type I or II. If a FRET (fluorescence resonance energy transfer) acceptor existed, it would react with the photosensitizer in a singlet state, thus stopping the photosensitizer from entering the next triplet state and blocking the pathway of ROS generation (Li et al., Citation2013). In this study, it was assumed that the FRET between Ce6 molecules would inhibit the ROS generation of CHT NPs. As a fluorescent probe, DMA was employed to monitor the ROS generation of CHT NPs, which can be converted to a non-fluorescent product after selectively reacting with ROS (Rapozzi et al., Citation2014). As shown in , free Ce6 exhibited the great ability to generate ROS in view of the lowest DMA fluorescence intensity. DMA existed in a DTT-free medium containing CHT NPs, on the contrary, exhibited a much weaker ability to generate ROS, which might be attributed to the self-quenching effect of the accumulated Ce6 molecules. Interestingly, if the CHT NPs existed in a DTT-rich medium, the DMA fluorescence intensity was significantly lower than that in a DTT-free medium and almost comparable to that of free Ce6, suggesting that more ROS could be generated in a reductive environment, which might be attributed to the DTT-triggered dequenching effect of Ce6.
Furthermore, the release profiles of PTX from PTX/CHT NPs in the different medium were also studied using a dialysis method. As depicted in , no obvious difference of PTX release between non-DTT-treated PTX/CHT NPs and PTX/CHT NPs treated with 20 μM DTT was observed, implying that the PTX/CHT NPs could hardly be destroyed in medium containing low concentration of DTT (20 μM), so that they were expected to keep intact in circulation. In these two groups, less than 40% of PTX could be released during the first 12 h of incubation and only ∼60% of PTX could be released after 36 h. In comparison, for PTX/CHT NPs incubated with 20 mM DTT, 50.24% of PTX could be released after 12 h and 85.20% of PTX was released during 36 h of incubation. This accelerated release of PTX from PTX/CHT NPs in a reductive environment suggested that the PTX/CHT NPs might be suitable for intra-cellular delivery of drugs.
3.4. Cellular uptake and intracellular distribution of CHT NPs
To visually observe the internalization and distribution of both CHT NPs and free Ce6, CLSM was employed to capture the fluorescence of Ce6 after 1, 2, and 4 h of incubation. According to the CLSM images (), as the incubation time increased, the cellular uptake of both CHT NPs and free Ce6 gradually increased, indicating they were internalized by MCF-7 cells in a time-dependent manner. For MCF-7 cells treated with CHT NPs, the Ce6 signal could be initially observed on the surface of cells after 1 h of incubation; after 4 h of incubation, the Ce6 was found to be widely spread in the cytoplasm. Also, a small fraction of Ce6 appeared in the cell nucleus, implying the conjugated Ce6 was cleaved from NPs in response to the high GSH concentration and then passed through the nuclear pores. Besides the increased cellular uptake of CHT NPs, the strong Ce6 fluorescence after 4 h of incubation might also be attributed to the cleavage of Ce6, triggering the dequenching effect of the aggregated Ce6. Compared with CHT NP-treated cells, cells exposed to Ce6 solution only exhibited slight red fluorescence even after 4 h of incubation, suggesting a much lower intracellular uptake of free Ce6 than CHT NPs. The insufficient uptake of free Ce6 has also been reported in previous work (Cho & Choi, Citation2012; Li et al., Citation2016; Hou et al., Citation2016a), which might be explained by both the high hydrophobicity of Ce6 and the nonspecific binding between the photosensitizer and serum components (Cunderlíková et al., Citation1999; Cho & Choi, Citation2012; Li et al., Citation2016).
Figure 5. (A) CLSM images of MCF-7 cells after incubation of Ce6 solution or CHT NPs for 1, 2, and 4 h (scale bar: 40 μm). (B) FCM histograms (a) and mean fluorescence intensity (b) for Ce6 on MCF-7 cells after 1, 2, and 4 h incubation of Ce6 solution or CHT NPs. Data were represented as mean ± SD (n = 3). *p < .01.
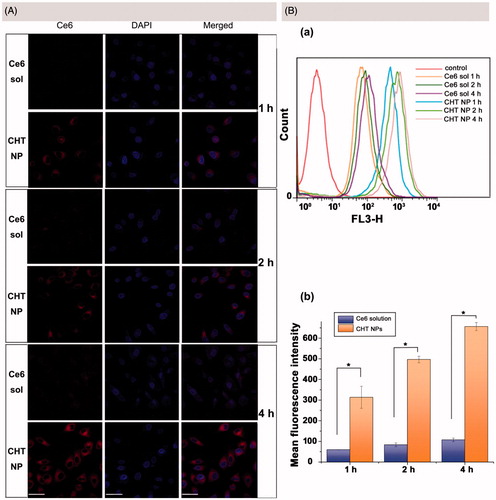
FCM was employed to further quantitatively describe the intracellular Ce6 content. In accordance with the CLSM observation results, the time-dependent internalization of both Ce6 solution and CHT NPs was also found. In addition, the mean fluorescence intensities of CHT NP-treated cells were 4.25, 4.96, and 5.12 times higher than those of Ce6-treated cells after 1, 2, and 4 h of incubation, respectively. To sum up, the CHT NPs provided an efficient strategy to enhance the uptake of Ce6 compared to Ce6 solution, which could quickly recover the fluorescence of Ce6 in the cytoplasm of MCF-7 cells.
3.5. Cellular toxicity
MTT assays were performed to investigate the dark toxicity and light toxicity of PTX-free CHT NPs and Ce6 solution against MCF-7 cells. According to , MCF-7 cells showed the cell viability always above 85% when incubated with CHT NPs (0.5–5 μg/mL of Ce6 equivalents), suggesting the good biocompatibility of CHT NPs towards MCF-7 cells without laser irradiation. For cells irradiated with NIR laser, the survival rate of cells treated with CHT NPs exhibited a dose-dependent decrease (). Moreover, the viabilities of cells treated with Ce6 CHT plus NIR irradiation were always lower than those treated with free Ce6 plus NIR irradiation; for example, when Ce6 concentration was 5 μg/mL, the viabilities of the cell exposed to CHT NPs and to Ce6 solution were 11.62% and 78.62%, respectively. This significant difference in cell viability (p = 7.1× e−7 < .01) might be explained by the much lower cellular uptake of free Ce6 compared with CHT NPs, which has been discussed in section 3.4.
Figure 6. MTT assays of CHT NPs and PTX/CHT NPs with/without NIR irradiation. (A) Dark toxicity and phototoxicity of CHT NPs and Ce6 solution against MCF-7 cells. (B) Cytotoxicity of PTX/CHT NPs (with/without NIR irradiation) and Taxol towards MCF-7 cells. *p < .01. Data were represented as mean ± SD (n = 6).
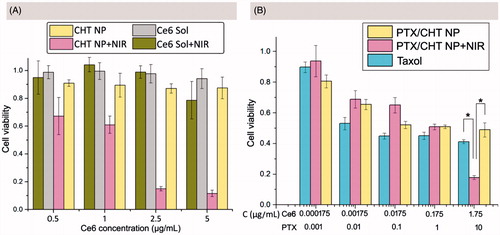
Encouraged by the effective PDT efficiency of CHT NPs, the cell-killing effect of PTX/CHT NPs was further evaluated via MTT assay, hoping for a combinational PDT/chemotherapy therapeutic effect. As shown in , when cells were exposed to PTX/CHT NPs at a relatively low concentration (0.000175–0.175 μg/mL of Ce6 equivalents), there was no obvious difference in survival rates between NIR-irradiated and non-NIR-irradiated cells, suggesting that the concentration of Ce6 was not high enough to exert cell-killing effect (); when Ce6 concentration increased to 1.75 μg/mL, a significant difference in cell viability was observed between these two groups (p = 1.9 × e−8 <.01), implying that an efficient combinational PDT/chemotherapy could be obtained at a relatively high Ce6 concentration. In addition, the mono-chemotherapy effect of PTX/CHT NP was also evaluated by comparing its cell-killing effect with that of Taxol. Although PTX/CHT NP exhibited a slight lower toxicity than Taxol, it could still exert an efficient cell-killing effect in a dose-dependent manner (). The high cytotoxicity of Taxol might come from its quick passive diffusion into cells, followed by the direct effect of PTX on microtubules without a release process; also, Cremophor EL/ethanol existed in Taxol formulation could exert significant toxicity to cells, which has been demonstrated in previous work (Huo et al., Citation2016; Yang et al., Citation2017a). Remarkably, at a PTX concentration of 10 μg/mL, cells treated with PTX/CHT NPs plus NIR irradiation exhibited a significantly lower viability compared with Taxol-treated cells (p = 2.3 × e−11 < .01) (), suggesting the successful in vitro combination of PDT and chemotherapy.
3.6. Apoptosis assay
Since the MTT assay could only provide the information of cell viability, to further characterize the extent of cell death and apoptosis induced by different formulations, a quantitative apoptosis assay was needed (Yao et al., Citation2013). In this study, the Annexin V/PI double staining method was adopted and normal cells (Q4), early apoptotic cells (Q3), late apoptotic cells (Q2), and necrotic cells (Q1) were distinguished based on the staining outcomes (). As shown in , NIR irradiation alone (b), Ce6 solution (c), and CHT NP (e) induced negligible cell apoptosis or death.
Figure 7. Apoptosis assay of MCF-7 cells using Annexin V/PI double staining method. (A) Apoptotic populations of MCF-7 cells after exposing to different formulations: (a) culture medium, (b) culture medium plus NIR irradiation, (c) Ce6 solution, (d) Ce6 solution plus NIR irradiation, (e) CHT NP, (d) CHT NP plus NIR irradiation, (e) PTX/CHT NP, (f) PTX/CHT NP plus NIR irradiation. (B) Cell counts (%) of necrotic cells (Q1), late apoptotic cells (Q2), early apoptotic cells (Q3), normal cells (Q4), and total apoptotic cells (Q2 + Q3) after different treatment. Data were represented as mean ± SD (n = 3). * indicates p < .01.
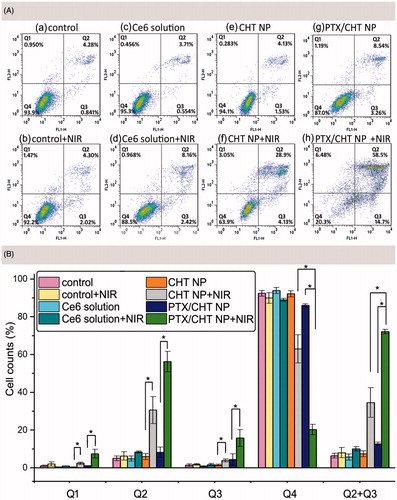
summarized the rates of cells in different stages after exposing to different formulations. Treatment of free Ce6 with NIR irradiation could only induce the apoptosis of cells to a small degree (10.11%); however, when the cells were treated with CHT NPs plus NIR irradiation, the apoptosis rate increased to 34.52%, which might be the result of the efficient cellular uptake as demonstrated before (). For the PTX/CHT NP-treated group (no NIR irradiation), 12.75% of apoptosis cells were detected, which may be attributed to the released PTX. Upon NIR irradiation of cells treated with PTX/CHT NPs, the fraction of apoptosis cells boosted to 72.13% (early apoptosis rate: 15.87%, late apoptosis rate: 56.27%) while the rate of normal cells decreased to 20.30%, confirming the enhanced combination treatment effect of PTX/CHT NPs compared with mono-photodynamic (CHT NP + NIR group) or mono-chemotherapy (PTX/CHT NP) alone. Also, NIR irradiation of CHT NPs, as well as PTX/CHT NPs, could significantly increase the rate of cells in both early and late apoptosis stage ().
3.7. Wound healing assay
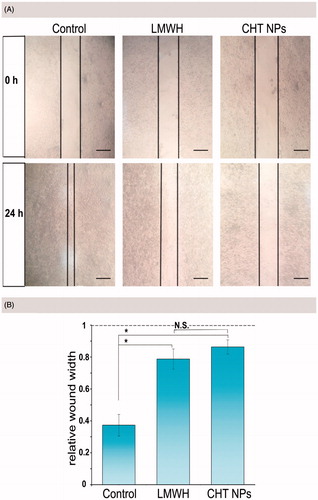
Inspired by the anti-metastasis activity of LMWH against different experimental models (Yang et al., Citation2015), a wound healing assay was performed to evaluate the motility ability of MCF-7 cells treated with or without LMWH-containing formulations. In this study, the width of wound scratched by pipette tip was captured and measured at 0 and 24 h (). In the controlled group, cells gradually moved to the middle after 24 h of incubation and the relative width of the open wound was only 0.37 ± 0.07 (). On the contrary, after incubation with LWMH-containing formulations, both CHT NPs and free LMWH, the relative widths were 0.86 ± 0.06 and 0.79 ± 0.04 (), respectively, suggesting a reduced healing ability. The inhibitory effect against cell motility could be attributed to the presence of LMWH, which has been reported in previous work (Mei et al., Citation2016; Debele et al., Citation2017; Mei et al., Citation2017). Additionally, the wound width of CHT NPs and LMWH-treated groups showed no significance, indicating that the CHT NPs could well preserve this inhibitory effect of LMWH, which made this LWMH-based nanoplatform promising in exhibiting anti-metastasis activity.
Figure 8. (A) Representative images of MCF-7 cell migration in wound healing assay after 24 h of incubation with different formulations. The margins of cells were outlined in black. Scale bar: 50 μm. (B) The relative width of the open wound after incubation with different formulations for 24 h compared with that of 0 h (n = 3). Data were expressed as mean ± SD (*indicates p < .01; N.S. indicates no significance).
3.8. In vivo and ex vivo NIR imaging of CHT NPs
To evaluate the in vivo tumor imaging capacity of CHT NPs, the real-time NIR fluorescence imaging was performed on xenografted MCF-7-bearing nude BALB/c mice.
As shown in , for mouse treated with Ce6 solution, a strong fluorescence signal was observed in liver 1 h post injection, suggesting the accumulation of Ce6; the signal intensity of Ce6 in tumor foci was much lower than that in the liver due to the lack of tumor targeting ability. Subsequently, the signal in the whole body decreased rapidly 4 h after injection and the fluorescence in tumor area could not be detected 8 h post-injection, suggesting the lack of tumor-specific accumulation and quick elimination of Ce6.
Figure 9. In vivo and ex vivo fluorescence imaging and biodistribution of CHT NPs and Ce6 solution. (A) In vivo fluorescence images of MCF-7 tumor-bearing nude mice 1, 4, 8, and 24 h after intravenous injection of CHT NPs or Ce6 solution. The red circles indicate the tumor foci. (B) Ex vivo fluorescence images of heart (H), liver (L), spleen (S), lung (Lu), kidney (K), and tumor (T) 24 h after intravenous injection of CHT NPs or Ce6 solution.
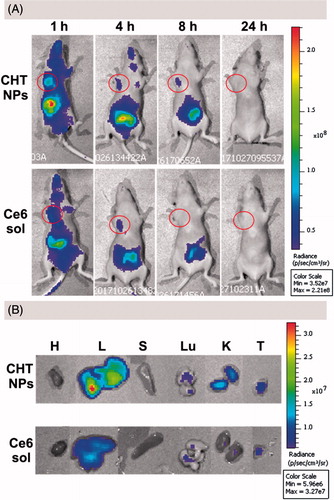
In the case of CHT-treated mice, the mouse exhibited a stronger Ce6 signal 1 h after administration compared with the Ce6 solution-treated one; and the Ce6 fluorescence was still detectable 8 h after injection, suggesting the enhanced accumulation of Ce6 in tumor sites compared with free Ce6. An ex vivo imaging was also carried out 24 h after injection to visually observe the Ce6 distribution in different organs and quantitatively describe the Ce6 intensity via the analysis of ROI (region of interest). The tumor of CHT NP-treated mouse exhibited superior fluorescence efficiency (3.669 × e7) to that of Ce6 solution-treated one (1.863 × e7) (). Taken together, CHT NP could promote the accumulation of Ce6 in tumor area and prolong the retention time compared with a Ce6 solution, implying its potential for NIR imaging.
3.9. In vivo combination therapy and safety evaluation
To demonstrate the therapeutic potential of PTX/CHT NPs, the tumor-bearing mice were randomly divided into five groups, receiving different treatments: (1) NS, (2) Ce6 solution plus NIR irradiation, (3) Taxol, (4) PTX/CHT NPs, and (5) PTX/CHT NPs plus NIR irradiation. All mice received an intravenous injection of different formulations on Day 0 and Day 8; at 1 and 24 h post-injection, mice of Groups 2 and 5 were irradiated at the tumor site with a NIR laser (200 mW/cm2) for 15 min. The volume of tumors was monitored every 2 days for 14 days to evaluate the therapeutic efficacy of each formulation ().
Figure 10. In vivo anti-cancer efficiency and safety evaluation. (A) Time-dependent 4T1 tumor growth curves after different treatments. (B) Body weight change of the mice in different treatment groups within 14 days. (C) The relative tumor volumes of mice in different groups on the 14th day of treatment. (D) Images of the excised tumors from mice in different treatment groups on the 14th day of treatment. (E) Representative H&E stained images of tumor tissues from mice treated with different formulations after 14 days of treatment. Scale bar: 100 μm. (F) Representative H&E stained images of heart, liver, spleen, lung, and kidney excised from mice treated with PTX/CHT NPs plus NIR irradiation. Scale bar: 100 μm. In A, B, and C, data were expressed as mean ± SD (n = 5). *p < .01.
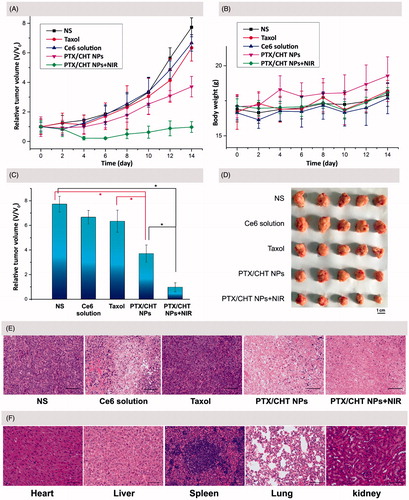
As shown in , compared with the NS-treated group, mono-photodynamic therapy (Ce6 plus NIR irradiation) could inhibit the tumor growth to a small extent in view of the relative tumor volume on the 14th day after treatment (6.67 versus 7.73, p = .024 < .05). This limited PDT efficiency could be explained by the quick elimination and short tumor retention time of free Ce6, as indicated in the former in vivo NIR imaging study. As to PTX treatment, a restricted inhibition effect was also observed when comparing the relative tumor volume (6.34 versus 7.73, p = .029 < .05), which might be attributed to the low dose and low frequency of administration. Interestingly, PTX/CHT NP-treatment showed an obvious suppression effect on tumor growth compared with Taxol treatment (p = .002 < .01) (), which could be attributed to the enhanced accumulation of NPs in tumor foci as well as the redox-sensitivity of PTX/CHT NPs. Remarkably, the relative tumor volume of mice in PTX/CHT NPs plus NIR irradiation group was significantly different from that in the controlled NS-treated group after 14 days of treatment (0.98 versus 7.73, p = 3.44 × e−8 < .01), suggesting the efficient inhibition of tumor growth. Noteworthy, there is also a significant difference between the relative tumor volume of mice treated with PTX/CHT NPs (mono-chemotherapy) and those treated with PTX/CHT NPs plus NIR irradiation (combination therapy) (p = 5.42 × e−5 < .01), suggesting the satisfied synergistic anti-tumor efficiency of photodynamic/chemotherapy. The excised tumors after 14 days also confirmed the best anti-tumor effect of the combinational therapy (PTX/CHT NPs plus irradiation) (). To further demonstrate the inhibition effect of each treatment, H&E staining assays of tumor slices were performed. As shown in , almost all cancer cells were completely destroyed in the combination therapy group (PTX/CHT NPs plus irradiation) and the cells exposed to PTX/CHT NPs without NIR irradiation were also damaged to a large extent; on the contrary, tumor cells in the other groups could largely retain their normal morphology. To sum up, the PTX/CHT NPs plus irradiation treatment exhibited great potential in suppressing tumor growth, which might be explained by the superiority of CHT NPs (e.g. redox-sensitivity and the EPR effect) and the efficiency of photodynamic/chemotherapy.
To preliminarily evaluate the in vivo toxicity of the formulations, the body weights of mice were recorded every 2 days during the entire experiment period (14 days), suggesting no significant change of body weight in all mice (). In addition, the histopathological assays of liver, spleen, kidney, lung, and heart of mice treated with PTX/CHT NPs plus irradiation were performed by H&E staining. As shown in , compared with the results from normal mice (Supplementary Figure S1), none of these organs exhibited obvious abnormalities, lesions or degenerations, implying the safety of the combinational therapy for in vivo application.
Overall, the effective combination of photodynamic and chemotherapy could be realized by the administration of PTX/CHT NPs and a subsequent NIR irradiation. This treatment has been proved to hold great promise for effective cancer management with little side effects.
4. Conclusion
In the present work, LMWH was innovatively utilized as the backbone of a smart theranostic polymeric nanoplatform for NIR imaging-guided combinational photodynamic/chemotherapy of the tumor. Cystamine was employed as the redox-responsive component of the system, the cleavage of which could trigger the rapid release of PTX and recovery of Ce6 in term of NIR fluorescence and ROS generation. According to our results, the reported PTX/CHT NPs could respond to a redox environment (20 mM DTT) and rapidly release PTX as well as Ce6. Besides, CHT NPs also provided an efficient strategy to promote the cellular uptake of Ce6 by MCF-7 cells as suggested by the CLSM and FCM results, which might contribute to the enhanced PDT efficiency of CHT NPs compared with free Ce6. The superior anti-cancer effects of PTX/CHT NPs irradiated with NIR laser to mono-chemotherapy or mono-PDT were observed both in vitro and in vivo. Also, the NIR tumor imaging capacity of CHT NPs was confirmed by the in vivo imaging study.
In conclusion, the PTX/CHT NP reported in the present study exhibited the following advantages, which made it promising for tumor therapy. First, various favorable properties, including redox-sensitivity, chemotherapy efficiency, PDT efficiency, NIR imaging capacity, were successfully integrated into the fabricated PTX/CHT NPs. Second, since the synthesis of CHT polymers was based on a simple EDC/NHS chemistry and the formation of NPs was based on the self-assembling process of amphiphilic CHT polymer in aqueous solution, any redundant chemistry or material engineering was avoided. Besides, as demonstrated by our results, the CHT NPs could well preserve the anti-metastasis activity of LMWH; this inherent advantageous property of nanocarrier itself made the system particularly suitable for cancer management.
IDRD_Zhai_et_al_Supplemental_Content.docx
Download MS Word (1.1 MB)Disclosure statement
The authors report no declarations of interest.
Additional information
Funding
Related Research Data
References
- Ai X, Sun J, Zhong L, et al. (2015). Star‐shape redox-responsive PEG-sheddable copolymer of disulfide-linked polyethylene glycol-lysine-di-tocopherol succinate for tumor-triggering intracellular doxorubicin rapid release: head-to-head comparison. Macromol Biosci 14:1415–28.
- Avci P, Erdem SS, Hamblin MR. (2014). Photodynamic therapy: one step ahead with self-assembled nanoparticles. J Biomed Nanotechnol 10:1937–52.
- Calixto GM, Bernegossi J, De Freitas LM, et al. (2016). Nanotechnology-based drug delivery systems for photodynamic therapy of cancer: a review. Molecules 21:342–59.
- Chen Q, Wang X, Wang C, et al. (2015). Drug-induced self-assembly of modified albumins as nano-theranostics for tumor-targeted combination therapy. ACS Nano 9:5223–33.
- Cho Y, Choi Y. (2012). Graphene oxide–photosensitizer conjugate as a redox-responsive theranostic agent. Chem Commun 48:9912–4.
- Chuan X, Song Q, Lin J, et al. (2014). Novel free-paclitaxel-loaded redox-responsive nanoparticles based on a disulfide-linked poly(ethylene glycol)-drug conjugate for intracellular drug delivery: synthesis, characterization, and antitumor activity in vitro and in vivo. Mol Pharm 11:3656–70.
- Cunderlíková B, Gangeskar L, Moan J. (1999). Acid-base properties of chlorin e6: relation to cellular uptake. J Photochem Photobiol B Biol 53:81–90.
- Debele TA, Mekuria SL, Tsai HC. (2017). Synthesis and characterization of redox-sensitive heparin-beta-sitosterol micelles: their application as carriers for the pharmaceutical agent, doxorubicin, and investigation of their antimetastatic activities in vitro. Mater Sci Eng C Mater Biol Appl 75:1326–38.
- Debele TA, Peng S, Tsai HC. (2015). Drug carrier for photodynamic cancer therapy. Int J Mol Sci 16:22094–136.
- Ding F, Li HJ, Wang JX, et al. (2015). Chlorin e6-encapsulated polyphosphoester based nanocarriers with viscous flow core for effective treatment of pancreatic cancer. ACS Appl Mater Interfaces 7:18856–65.
- Dong L, Fang Y, Fei X, Ning G. (2016). The smart drug delivery system and its clinical potential. Theranostics 6:1306–23.
- Fan F, Lu W, Feng L, et al. (2016). Stimuli-responsive layer-by-layer tellurium-containing polymer films for the combination of chemotherapy and photodynamic therapy. ACS Appl Mater Interfaces 8:17004–10.
- Fan Y, Wang Q, Lin G, et al. (2017). Combination of using prodrug-modified cationic liposome nanocomplexes and a potentiating strategy via targeted co-delivery of gemcitabine and docetaxel for CD44-overexpressed triple negative breast cancer therapy. Acta Biomater 62:257–72.
- He C, Duan X, Guo N, et al. (2016). Core-shell nanoscale coordination polymers combine chemotherapy and photodynamic therapy to potentiate checkpoint blockade cancer immunotherapy. Nat Commun 7:12499–510.
- He C, Liu D, Lin W. (2015). Self-assembled core-shell nanoparticles for combined chemotherapy and photodynamic therapy of resistant head and neck cancers. ACS Nano 9:991–1003.
- Hou W, Xia F, Alves CS, et al. (2016a). MMP2-targeting and redox-responsive PEGylated chlorin e6 nanoparticles for cancer near-infrared imaging and photodynamic therapy. ACS Appl Mater Interfaces 8:1447–57.
- Hou W, Zhao X, Qian X, et al. (2016b). pH-Sensitive self-assembling nanoparticles for tumor near-infrared fluorescence imaging and chemo-photodynamic combination therapy. Nanoscale 8:104–16.
- Huang Z, Huang L, Huang Y, et al. (2017). Phthalocyanine-based coordination polymer nanoparticles for enhanced photodynamic therapy. Nanoscale 9:15883–94.
- Huo M, Yao L, Lei W, et al. (2016). Redox-sensitive micelles based on O,N-hydroxyethyl chitosan–octylamine conjugates for triggered intracellular delivery of paclitaxel. Mol Pharm 13:1750–62.
- Juzeniene A. (2009). Chlorin e6-based photosensitizers for photodynamic therapy and photodiagnosis. Photodiagnosis Photodyn Ther 6:94–6.
- Kim H, Kim Y, Kim IH, et al. (2013). ROS-responsive activatable photosensitizing agent for imaging and photodynamic therapy of activated macrophages. Theranostics 4:1–11.
- Kumari P, Jain S, Ghosh B, et al. (2017). Polylactide-based block co-polymeric micelles loaded with chlorin e6 for photodynamic therapy: in vitro evaluation in monolayer and 3D spheroid models. Mol Pharm 14:3789–800.
- Lee CS, Na K. (2014). Photochemically triggered cytosolic drug delivery using pH-responsive hyaluronic acid nanoparticles for light-induced cancer therapy. Biomacromolecules 15:4228–38.
- Lee J, Lee YM, Kim J, Kim WJ. (2017). Doxorubicin/Ce6-loaded nanoparticle coated with polymer via singlet oxygen-sensitive linker for photodynamically assisted chemotherapy. Nanotheranostics 1:196–207.
- Lee SJ, Koo H, Jeong H, et al. (2011). Comparative study of photosensitizer loaded and conjugated glycol chitosan nanoparticles for cancer therapy. J Control Release 152:21–9.
- Li F, Na K. (2011). Self-assembled chlorin e6 conjugated chondroitin sulfate nanodrug for photodynamic therapy. Biomacromolecules 12:1724–30.
- Li L, Nurunnabi Nafiujjaman, et al. (2013). GSH-mediated photoactivity of pheophorbide a-conjugated heparin/gold nanoparticle for photodynamic therapy. J Control Release 171:241–50.
- Li W, Zheng C, Pan Z, et al. (2016). Smart hyaluronidase-actived theranostic micelles for dual-modal imaging guided photodynamic therapy. Biomaterials 101:10–9.
- Li Y, Jiang C, Zhang D, et al. (2017). Targeted polydopamine nanoparticles enable photoacoustic imaging guided chemo-photothermal synergistic therapy of tumor. Acta Biomaterialia 47:124–34.
- Liu P, Yue C, Sheng Z, et al. (2014). Photosensitizer-conjugated redox-responsive dextran theranostic nanoparticles for near-infrared cancer imaging and photodynamic therapy. Polym Chem 5:874–81.
- Macdonald IJ, Dougherty TJ. (2001). Basic principles of photodynamic therapy. J Porphyrins Phthalocyan 5:105–29.
- Mei L, Liu Y, Xia C, et al. (2017). Polymer-drug nanoparticles combine doxorubicin carrier and heparin bioactivity functionalities for primary and metastatic cancer treatment. Mol Pharm 14:513–22.
- Mei L, Liu Y, Zhang H, et al. (2016). Antitumor and antimetastasis activities of heparin-based micelle served as both carrier and drug. ACS Appl Mater Interfaces 8:9577–89.
- Obaid G, Broekgaarden M, Bulin AL, et al. (2016). Photonanomedicine: a convergence of photodynamic therapy and nanotechnology. Nanoscale 8:12471–503.
- Park H, Na K. (2013). Conjugation of the photosensitizer Chlorin e6 to pluronic F127 for enhanced cellular internalization for photodynamic therapy. Biomaterials 34:6992–7000.
- Park H, Park W, Na K. (2014). Doxorubicin loaded singlet-oxygen producible polymeric micelle based on chlorine e6 conjugated pluronic F127 for overcoming drug resistance in cancer. Biomaterials 35:7963–9.
- Park KE, Noh YW, Kim A, Lim YT. (2017). Hyaluronic acid-coated nanoparticles for targeted photodynamic therapy of cancer guided by near-infrared and MR imaging. Carbohydr Polym 157:476–83.
- Park W, Bae BC, Na K. (2016). A highly tumor-specific light-triggerable drug carrier responds to hypoxic tumor conditions for effective tumor treatment. Biomaterials 77:227–34.
- Peng CL, Lai PS, Lin FH, et al. (2009). Dual chemotherapy and photodynamic therapy in an HT-29 human colon cancer xenograft model using SN-38-loaded chlorin-core star block copolymer micelles. Biomaterials 30:3614–25.
- Peng CL, Shieh MJ, Tsai MH, et al. (2008). Self-assembled star-shaped chlorin-core poly(epsilon-caprolactone)-poly(ethylene glycol) diblock copolymer micelles for dual chemo-photodynamic therapies. Biomaterials 29:3599–608.
- Rapozzi V, Zorzet S, Zacchigna M, et al. (2014). Anticancer activity of cationic porphyrins in melanoma tumour-bearing mice and mechanistic in vitro studies. Mol Cancer 13:75–91.
- Spring BQ, Rizvi I, Xu N, Hasan T. (2015). The role of photodynamic therapy in overcoming cancer drug resistance. Photochem Photobiol Sci 14:1476–91.
- Torchilin VP. (2014). Multifunctional, stimuli-sensitive nanoparticulate systems for drug delivery. Nat Rev Drug Discov 13:813–27.
- Tu X, Wang L, Cao Y, et al. (2016). Efficient cancer ablation by combined photothermal and enhanced chemo-therapy based on carbon nanoparticles/doxorubicin@SiO2 nanocomposites. Carbon 97:35–44.
- Xiao B, Ma L, Merlin D. (2016). Nanoparticle-mediated co-delivery of chemotherapeutic agent and siRNA for combination cancer therapy. Expert Opin Drug Deliv 14:65–73.
- Yang J, Huang Y, Gao C, et al. (2014). Fabrication and evaluation of the novel reduction-sensitive starch nanoparticles for controlled drug release. Colloids Surf B Biointerfaces 115:368–76.
- Yang X, Cai X, Yu A, et al. (2017a). Redox-sensitive self-assembled nanoparticles based on alpha-tocopherol succinate-modified heparin for intracellular delivery of paclitaxel. J Colloid Interface Sci 496:311–26.
- Yang X, Du H, Liu J, Zhai G. (2015). Advanced nanocarriers based on heparin and its derivatives for cancer management. Biomacromolecules 16:423–36.
- Yang X, Shi X, D'arcy R, et al. (2017b). Amphiphilic polysaccharides as building blocks for self-assembled nanosystems: molecular design and application in cancer and inflammatory diseases. J Control Release 272:114–44.
- Yang Y, Lin Y, Di D, et al. (2017c). Gold nanoparticle-gated mesoporous silica as redox-triggered drug delivery for chemo-photothermal synergistic therapy. J Colloid Interface Sci 508:323–31.
- Yao J, Zhang L, Zhou J, et al. (2013). Efficient simultaneous tumor targeting delivery of all-trans retinoid acid and Paclitaxel based on hyaluronic acid-based multifunctional nanocarrier. Mol Pharm 10:1080–91.
- Zhang H, Xu J, Xing L, et al. (2016a). Self-assembled micelles based on Chondroitin sulfate/Poly (D, L-lactideco-glycolide) block copolymers for doxorubicin delivery. J Colloid Interface Sci 492:101–11.
- Zhang R, Xing R, Jiao T, et al. (2016b). Carrier-free, chemophotodynamic dual nanodrugs via self-assembly for synergistic antitumor therapy. ACS Appl Mater Interfaces 8:13262–9.
- Zhao N, Zeng Z, Zu Y. (2017). Self-assembled aptamer-nanomedicine for targeted chemotherapy and gene therapy. Small 14. DOI: 10.1002/smll.201702103
- Zhao P, Zheng M, Luo Z, et al. (2015). NIR-driven smart theranostic nanomedicine for on-demand drug release and synergistic antitumour therapy. Sci Rep 5:14258–71.
- Zheng M, Yue C, Ma Y, et al. (2013). Single-step assembly of DOX/ICG loaded lipid–polymer nanoparticles for highly effective chemo-photothermal combination therapy. ACS Nano 7:2056–67.
- Zhou X, Chen L, Nie W, et al. (2016). Dual-responsive mesoporous silica nanoparticles mediated co-delivery of doxorubicin and Bcl-2 siRNA for targeted treatment of breast cancer. J Phys Chem C 120:22375–87.