
 ?Mathematical formulae have been encoded as MathML and are displayed in this HTML version using MathJax in order to improve their display. Uncheck the box to turn MathJax off. This feature requires Javascript. Click on a formula to zoom.
Abstract
Poly(sialic acid) (PSA) is a natural hydrophilic biodegradable and non-immunogenic biopolymer, receptors for its monomer are expressed on peripheral blood neutrophils (PBNs), which plays important roles in the progression and invasion of tumors. A poly(sialic acid)–octadecylamine conjugate (PSA–ODA) was synthesized and then anchor it on the surface of liposomal pixantrone (Pix-PSL), to achieve an improved anticancer effect. The liposomes were prepared using a remote loading method via a pH gradient, and then assessed for particle size, zeta potential encapsulation efficiency, in vitro release, and in vitro cytotoxicity. Simultaneously, in vitro and in vivo cellular uptake studies confirmed that PSA-decorated liposomes provided an enhanced accumulation of liposomes in PBNs. An in vivo study presented that the anti-tumor activity of Pix-PSL was superior to that of other Pix formulations, probably due to the efficient targeting of PBNs by Pix-PSL, after which PBN containing Pix-PSL (Pix-PSL/PBNs) in the blood circulation are recruited by the tumor microenvironment. These findings suggest that PSA-decorated liposomal Pix may provide a neutrophil-mediated drug delivery system (DDS) for the eradication of tumors, which represents a promising approach for the tumor targeting of chemotherapeutic treatments.
1. Introduction
The relatively poor results of nonspecific chemotherapy for solid tumors promoted studies to identify new treatment strategies (Wang et al., Citation2011). One of the promoting approaches is to target the stromal cells within the tumor microenvironment (Udagawa & Wood, Citation2010). The tumor microenvironment is characterized by persistent inflammation and is often referred as a ‘wound that does not heal’ (Dvorak, Citation1986). It is well-known that human neutrophils account for 50–70% of all circulating leukocytes (Woods et al., Citation1999; Mayadas et al., Citation2014), which are the most abundant leukocyte and comprise the first line of innate immunity (Woods et al., Citation1999; Kaufmann, Citation2008; Powell & Huttenlocher, Citation2016). Notably, they are typically the first leukocytes recruited to sites of infection and injury (Kaufmann, Citation2008). It has been reported that neutrophils will be recruited to tumor sites via signals produced by cells of the tumor microenvironment, including chemokine (Viola et al., Citation2012; Raccosta et al., Citation2013), cytokines (Fossati et al., Citation1999; Moore et al., Citation1999; Benevides et al., Citation2015; Coffelt et al., Citation2015), and hydrogen peroxide (Feng et al., Citation2006). These cells are recognized as tumor-associated neutrophils (TANs), which can remodel the extracellular matrix (ECM) in the tumor microenvironment (Dumitru et al., Citation2013), or act directly on tumor cells to enhance tumor proliferation and invasion (Coussens et al., Citation2000; Wislez et al., Citation2003). Moreover, they can promote angiogenesis (Queen et al., Citation2005) and mediate the interactions with other cell types (Fridlender et al., Citation2009; Rotondo et al., Citation2009; Eruslanov et al., Citation2014). It has been confirmed that inhibition of neutrophil infiltration decreased tumor angiogenesis and dissemination, and this effect can be rescued by neutrophil-mediated production of MMP9, which belongs to neutrophil collagenase (Bekes et al., Citation2011). So, it is clear that methods engineering neutrophils to an anti-tumor bio-carrier are an interesting avenue for future research.
Engblom et al. (Citation2017) reported that bone marrow-derived myeloid cells, especially SiglecFhigh neutrophils, could accumulate within tumors and foster tumor outgrowth, which provided a possibility to utilize neutrophils as a bio-carrier for tumor-targeting treatment. In separate researches, it has been reported that neutrophils carrying liposomal paclitaxel (PTX-CL) can suppress the recurrence of glioma efficiently (Xue et al., Citation2017). It is demonstrated that inflammatory factors released from tumor site guide the movement of the neutrophils containing PTX-CL into glioma cancer. Although the study showed the efficient migration and therapeutic efficacy of neutrophils carrying PTX-CL in vitro and in vivo, the systems required the extra step of neutrophils transfusion, which may cause irreversible damage to neutrophils. Therefore, a feasible approach is drug targeted to neutrophils in vivo and delivered to tumor.
It is well-known that enhancing the cellular uptake by decorating a targeting ligand on the surface of nano-carrier is a classical method. PSA is a natural hydrophilic polysaccharide that has been reported to be biodegradable and non-immunogenic (Fernandes & Gregoriadis, Citation1997; Gregoriadis et al., Citation2000; Fernandes & Gregoriadis, Citation2001). PSA is a linear homo-polymer comprising of α-2,8 linked sialic acid (SA) monomers, which is expressed on the surfaces of mammalian neural cells (Johnson et al., Citation2005; Rutishauser, Citation2008). Moreover, the SA-binding receptor (l-selectin or CD62L), which is a member of the SA binding family of lectins, is expressed on PBNs (Arbonés et al., Citation1994; Coussens & Werb, Citation2002).
Liposomes are closed spherical nanoparticles composed of phospholipid bilayers (Li et al., Citation2015; Sauvage et al., Citation2016). Liposomes have been extensively studied for this purpose because of their ease of preparation, ability to encapsulate both hydrophilic and hydrophobic drugs, and their good biodegradability and biocompatibility (Allen & Cullis, Citation2004, Citation2013; Samad et al., Citation2007). For instance, liposomal doxorubicin (Doxil® and Myocet®) was approved for the treatment of Kaposi sarcoma and late stage ovarian cancer (Cho et al., Citation2008; Taurin et al., Citation2012; Kibria et al., Citation2016).
In this study, we developed a neutrophil-mediated drug delivery system (DDS) for antitumor treatment. A poly(sialic acid)–octadecylamine conjugate (PSA–ODA) was synthesized and used to decorate the surface of liposomes to enhance the neutrophil-targeting. Pixantrone (Pix), a model small-molecule drug for antitumor treatment (Cavalletti et al., Citation2007; Pettengell et al., Citation2012; Péan et al., Citation2013), was encapsulated into PSA-modified liposomes (Pix-PSL), unmodified liposomes (Pix-CL) or PEG-modified liposomes (Pix-PL). Subsequently, cellular uptake experiments both in vitro and in vivo demonstrated that PBNs from tumor-bearing mice exhibited considerably higher cellular uptake efficiency for Pix-PSL than for Pix-CL and Pix-PL. Furthermore, PBN containing liposomes models were constructed and related studies were conducted: in vitro about its anti-proliferative activity on A549 cells, while in vivo on its tumor targetability and inhibition of A549 tumor-bearing mice. The results showed that PSA-modified liposomes can target neutrophils efficiently and neutrophil-mediated DDS is a promising approach for tumor-targeting treatment.
2. Experimental
2.1. Materials
Pixantrone maleate (Pix, purity >99.8% by high-performance liquid chromatography) was purchased from Shanghai Huilun Life Science & Technology Co. Ltd. (Shanghai, China). Poly(sialic acid) (PSA) isolated from E. coli was provided by Carbosynth China, Ltd. (Shanghai, China). The supplier reported that the PSA had an average molecular weight (Mw) of 30 kDa, which corresponds to about 100 SA units. Octadecylamine was obtained from China National Medicines Corporation Ltd. (Shenyang, China). p-Nitrophenyl chloroformate (pNC) was supplied by Heowns Biochemical Technology Co., Ltd. (Tianjin, China). N-(methoxy polyethylene glycol-2000)-1,2-distearoyl-sn-glycero-3-phosphoethanolamine (mPEG2000-DSPE) was purchased from Genzyme Corporation (Cambridge, MA). Hydrogenated soy phosphatidylcholine (HSPC) was obtained from Lipoid GmbH (Ludwigshafen, Germany). Cholesterol (CH) was obtained from Shanghai Advanced Vehicle Technology Pharmaceutical, Ltd. (Shanghai, China). 1,1′-dioctadecyl-3,3,3′,3′-tetramethylindotricarbocyanine iodide (DiR) was obtained from Molecular Probes Inc. (Eugene, OR). Sephadex®G-50 was purchased from Pharmacia Biotech Inc. (Piscataway, NJ). All other chemicals used in this study were of analytical grade.
2.2. Cells and animal models
2.2.1. Cancer cell lines
The non-small cell lung cancer A549 cell line and murine sarcoma S180 cell line were obtained from the Cell Bank of the Chinese Academy of Sciences (Shanghai, China).
2.2.2. Isolation murine neutrophils from peripheral blood
PBNs were isolated from murine peripheral blood by using a modified density-gradient centrifugation method (English & Andersen, Citation1974; Van Vlasselaer, Citation1998). Briefly, peripheral blood samples of S180 tumor-bearing mice were collected in evacuated tubes with heparin sodium at a final concentration of 5 IU·mL–1. Then, 1 mL of erythrocyte sedimentation solution (HES-TBD550-80, TBD science) was added to 2 mL of blood samples and the erythrocytes were allowed to sediment for 1 h. After sedimentation, a known volume (2–3 mL) of plasma containing leukocytes was obtained.
The unicellular suspension was added into a murine peripheral blood neutrophils (PBNs) separation mixture medium (LZS1100, TBD science) consisting of 80% and 100% (2/1 v/v) separation medium 1, followed by centrifugation at 800×g for 20 min. The PBNs were recovered between the interface of the 80% and 100% fractions and then washed by ice-cold PBS thrice.
The yield was quantified using a neubauer improved cell counting chamber (MeilunBio, Dalian, China). The viability of the obtained PBNs was calculated by trypan blue exclusion, and the purity was determined using immunofluorescence staining with fluorescein isothiocyanate (FITC)-conjugated Ly-6G/Ly-6C (Gr-1) antibody (250 ng·mL–1) (BioLegend, San Diego, CA). The morphology of PBNs stained with Diff-Quik (TBD20180083, TBD science) was observed by an optical microscope (NIB-100, NOVEL).
2.2.3. Animal models
Male Kunming mice weighing 20 ± 2 g (6–8 weeks) and BALB/c nu/nu mice weighing 20 ± 2 g (8–10 weeks) were purchased from the Experimental Animal Center of Shenyang Pharmaceutical University (Shenyang, China). All the animal experiments were performed in accordance with the guidelines evaluated and approved by the University Ethics Committee.
A xenograft mice model of S180 tumor in vivo was established by our research group (She et al., Citation2014; Yang et al., Citation2014; Sun et al., Citation2016; Zhang et al., Citation2016; Zhou et al., Citation2017). Briefly, 0.2 mL of S180 cells (1 × 10⁷ cells/mL) were subcutaneously injected into the right axillary flank of male Kunming mice on day 0. Roughly, 10–12 days after incubation of S180 cells (once tumors reached ∼800 mm3 without ulceration), the murine PBNs were isolated from S180 tumor-bearing mice.
A xenograft nude mice model of A549 tumor in vivo was established by Khan et al. (Citation2007) and Akita et al. (Citation2015). Briefly, 0.1 mL of A549 cells (1 × 10⁷ cells/mL) were subcutaneously implanted into the right back of male BALB/c nu/nu mice on day 0. Roughly, 2 weeks after incubation of A549 cells (once tumors reached ∼100 mm3 without ulceration), the A549 tumor-bearing mice model was success.
2.3. Synthesis and characterization of polysaccharide-derivative
PSA–ODA was synthesized using pNC as a catalyst between PSA and ODA (Figure S1A). Briefly, ODA (135 mg, 0.5 mM), pNC (151 mg, 0.75 mM), and pyridine (60 μL, 0.75 mM) were dissolved in 5 mL dichloromethane (DCM) and stirred under nitrogen. After standing at room temperature for 3 h, 30 mL of dry ether was added. The resulting precipitate (p-ODA) was collected, washed with ether, and then redissolved in 10 mL formamide (FA). Then, PSA (150 mg, 0.5 mM) and triethylamine (65 μL, 0.5 mM) were added to the mixture and dissolved completely. After stirring at room temperature for 24 h under nitrogen, the reaction was terminated. Subsequently, the filtered mixture was dialyzed against distilled water using a cellulose ester membrane with an Mw cutoff of 1000 Da (Spectrum®, Rancho Dominguez, CA). Finally, the retentate was lyophilized to yield PSA–ODA, which was analyzed by FT-IR (Bruker IFS 55, Billerica, MA) and 1H NMR (Bruker 600-MHz, Billerica, MA).
2.4. Preparation of liposomes
2.4.1. Liposomal pixantrone
Empty liposomes were prepared via the modified ethanol injection method described previously (Yang et al., Citation2012; Luo et al., Citation2013). Briefly, the lipid components were dissolved completely in ethanol at 65 °C and then the residual solvent was removed under stirring. Simultaneously, citrate buffer (pH 4.0, 300 mM) was added under magnetic stirring for 20 min. After hydration, the dispersion was sonicated using a probe sonicator (JY92-2D Vibra-cell, Ningbo Scientz Biotechnology Co., Ltd., Ningbo, China) to obtain empty liposomes. In order to remove large particles, the empty liposomes were passed through polycarbonate filters (0.8, 0.45, and 0.22 µm) at 25 °C in succession.
Afterward, Pix was loaded into liposomes using a pH gradient method (Cullis et al., Citation1997; She et al., Citation2014). Briefly, sodium phosphate solution (500 mM) was added to the prepared empty liposomes to establish a transmembrane pH gradient (△pH = 3). Subsequently, Pix solution (drug-to-lipid ratio 1/10, w/w) was mixed with the empty liposomes, and then the mixture was incubated at 60 °C for 10 min to obtain Pix-loaded liposomes.
2.4.2. Fluorescence probe-labeled liposomes
In accordance to the preparation process of empty liposomes, fluorescence probe-labeled liposomes were dispersed in 5% glucose solution instead of citrate buffer. Notably, it is ideal that DiR is a near-infrared fluorescence imaging dye for in vitro and in vivo imaging due to significantly reduced autofluorescence from animal tissue at higher wavelength (Frangioni, Citation2003). Therefore, DiR-labeled liposomes (DiR-CL, DiR-PL, DiR-PSL represent DiR-labeled conventional liposomes, DiR-labeled PEG-modified liposomes, DiR-labeled PSA-modified liposomes, respectively) could be detected to fluorescence imaging in vitro and in vivo other than the liposomal Pix.
2.5. Characterization of liposomes
2.5.1. Determination of particle size and charge
The mean droplet diameter and particle size distribution of liposomes were measured using static light scattering (NICOMPTM 380, Particle Sizing System, Goleta, CA). Liposomes were diluted with PBS (pH 7.4, 10 mM) to prevent multiple scattering effects. The electrical surface potential (ζ-potential) of the liposomes was measured using the sample instrument (NICOMPTM 380, Particle Sizing System, Goleta, CA). Samples were diluted to an appropriate volume with PBS (pH 7.4, 10 mM) solution and then transferred into a capillary test tube for measurement.
2.5.2. Determination of encapsulation efficiency
UV–visible light and fluorescence spectrophotometry were used to assess the encapsulation efficiency (EE) and loading capacity of Pix-loaded liposomes and fluorescence probe-loaded liposomes, respectively. Free Pix or DiR was separated from liposomes using by a Sephadex G-50 column (10 × 25 mm). The Pix or fluorescence probe was released from the liposomes using 90% (v/v) isopropyl alcohol containing 0.75 M HCl. The Pix concentration was then determined using a UV-spectrophotometer at 641 nm (Model 1801, Beijing Rayleigh Analytical Instrument Co., Ltd., Beijing, China), and the fluorescence probes were assessed by a fluorescence spectrophotometer (650-60; Hitachi Ltd., Tokyo, Japan) with the excitation/emission wavelengths centered at 750 nm/790 nm for DiR probes.
Encapsulation efficiency was calculated from the following equations: EE = (the amount of Pix or fluorescence probe encapsulated in the liposomes/initial amount of Pix or fluorescence probe added to the liposomes) × 100%.
2.5.3. Morphological analysis
The morphology of Pix-loaded liposomes was performed using transmission electron microscopy (TEM, JM-1200EX, JEOL Ltd., Tokyo, Japan). Pix-loaded liposomes were placed on film-coated copper grid and then negatively stained with 2% (w/v) phosphotungstic acid for 1 min. The samples were then allowed to air-dry overnight at room temperature before measurement.
2.6. Preparation and characterization of PBN containing liposome models
The cellular uptake capacities and cell viabilities were measured using liposomal Pix. Simultaneously, the intracellular location and intercellular transport behaviors of DiR-CL, DiR-PL, and DiR-PSL were determined by flow cytometry (FCM) and confocal laser scanning microscopy (CLSM) toward PBNs and A549 cells.
2.6.1. Preparation and quantification of PBN containing liposome models
The PBN containing liposome models were obtained by incubating PBNs with DiR-CL, DiR-PL, or DiR-PSL, respectively. Briefly, the cells (1 × 10⁶ cells·mL−1) were seeded in a sterile tube. After culturing with 1 mL of FBS free RMPI 1640 medium for 30 min, cells were incubated with liposomes at a final DiR concentration of 50 µg·mL−1 at 37 °C for 30 min, respectively. After washing with ice-cold PBS thrice, the PBN containing liposome cell models (e.g. DiR-CL/PBNs, DiR-PL/PBNs, and DiR-PSL/PBNs) were obtained and used immediately for the subsequent study.
The amount of DiR in PBN containing liposome models was measured using two different approaches: fluorescence spectrophotometer and FCM.
For the fluorescence spectrophotometer method, the PBN containing liposome models were disrupted by a cell lysis buffer (FD009, FDbio, Hangzhou, China) to release DiR from the cells. The cell lysate (150 µL) was collected and mixed with 150 µL of ethanol, then vortexed for 5 min and centrifuged at 10,000×g for 5 min. The 200 µL of supernatant was evaluated by a microplate reader. The concentration of DiR was determined using a fluorescence spectrophotometer by setting ex/em 750/790 nm.
To maintain the cell viability, the amount of DiR in the PBN containing liposome models was evaluated by FCM. All the PBN containing liposome models in each tube were centrifuged for 3 min at 5000 rpm. After removing the supernatant, the cells were resuspended in 0.3 mL of PBS and fixed with 4% paraformaldehyde solution for 30 min. Data for 50,000 gated events were collected, and analyses were performed using a flow cytometer (Beckman, Porterville, CA).
2.6.2. Evaluation of physiological functions of PBN containing Pix models
The in vitro cytotoxicity of Pix-loaded liposomes against PBNs was evaluated by CCK-8 assay (Chang et al., Citation2011). Briefly, the PBNs cells were seeded into 96-well plates (5000 cells/well) in 100 μL of RPMI 1640 medium (Corning, NY) with 10% fetal bovine serum (FBS, Hangzhou Sijiqing Bioengineering Material Co. Ltd., Hangzhou, China), supplemented with 100 U/mL penicillin and 100 U/mL streptomycin, and incubated with samples at various concentrations for 0.5 h. Then, 10 μL of CCK-8 solution (Dojindo Laboratory, Kumamoto, Japan) was added into each well and incubated for another 4 h. Then, the absorbency of the solution was measured by a microplate reader at 450 nm. All measurements were performed in triplicate. Cell viability (%) was calculated from the absorbency using the following equation:
(1)
(1)
where ODsample, ODcontrol, and ODblank represent the absorbance of the sample wells, control wells, and blank wells, respectively.
2.6.3. Release of Pix from PBN containing Pix models
The in vitro release behaviors of Pix from PBN containing Pix models were determined using the HPLC method. Briefly, 106 cells of PBN containing Pix-loaded unmodified liposomes (Pix-CL/PBNs), PBN containing Pix-loaded PEG-modified liposomes (Pix-PL/PBNs), PBN containing Pix-loaded PSA-modified liposomes (Pix-PSL/PBNs), or PBN containing Pix solution (Pix-S/PBNs) in PBS (pH 7.4, 10 mM) were placed into tubes, respectively. And then, the samples were incubated with FBS free medium for different periods (0, 1, 2, 4, 8, 12, and 24 h). At defined time intervals, the samples were centrifuged at 5000 rpm for 3 min.
The supernatant medium was collected and the concentration of Pix was measured using an Agilent 1260-series HPLC system equipped with an Agilent 1260 ISO pump (Agilent Co., Santa Clara, CA), a 1260 diode array detector (DAD) detector (Agilent Co., Santa Clara, CA), and a Diamonsil C18 column (250 mm × 4.6 mm, 5 μm, Dikma Technologies Inc., Beijing, China). The mobile phase consisted of acetonitrile and a solution containing 4.0 g/L of sodium 1-heptanesulfonate and 9.0 mL/L of glacial acetic acid (34:66, v/v), and the detection wavelength was set at 590 nm with a flow rate of 1.0 mL/min at 25 °C (She et al., Citation2014). The standard curve had an R-value of 0.9997.
2.6.4. Intracellular location of liposomes in PBNs
The PBNs were seeded in six-well plates at 5.0 × 10⁵ cells in 2.0 mL of culture medium per well and cultured for 2 h. Then, the DiR-CL, DiR-PL, or DiR-PSL at a final DiR concentration of 0.2 μg/mL in 2.0 mL of culture medium was added. The cells were further incubated for 0.5 h containing FITC-Gr-1 antibody (250 ng·mL–1). Afterwards, all the medium was removed, and the cells were washed with ice-cold PBS three times and analyzed by FCM and CLSM (Nikon C2 Confocal, Tokyo, Japan), respectively.
2.6.5. Intercellular transport of liposomes from PBNs to A549 cells
A549 cells were cultured in DMEM and 10% FBS (Zhejiang Tianhang Biotechnology Co., Ltd., Zhejiang, China) according to the supplier’s instructions. The cells were seeded in six-well culture plates at 2.0 × 10⁵ per well and incubated for 24 h. After being incubated for another 2 h with DiR-CL/PBNs, DiR-PL/PBNs, or DiR-PSL/PBNs containing 0.2 μg/mL DiR in serum-free medium, cells were washed twice with ice-cold PBS and fixed with 4% paraformaldehyde solution for 30 min, and subsequently counterstained with DAPI for cellular nuclei and FITC-Gr-1 antibody (250 ng·mL–1) for PBNs. The cells were washed with ice-cold PBS three times and analyzed by FCM and CLSM, respectively.
2.7. Anti-proliferation of Pix formulations and PBN containing Pix models against A549 cells
The in vitro cytotoxicity of Pix formulations and PBN containing Pix models (Pix-S/PBNs, Pix-CL/PBNs, Pix-PL/PBNs, or Pix-PSL/PBNs) against A549 cells was evaluated by MTT assay (Gerlier & Thomasset, Citation1986). Briefly, the PBN containing Pix models were prepared by the process mentioned in section 2.6.1 except the final incubating concentration of Pix was 50 µg·mL–1. The A549 cells were seeded into 96-well plates (5000 cells/well) in 180 μL of DMEM medium (Corning, NY) with 10% FBS, supplemented with 100 U/mL penicillin and 100 U/mL streptomycin, and incubated with samples at various concentrations for 48 h. Then, 20 μL of MTT solution (5 mg/mL) was added and incubated for another 4 h. Afterward, 100 μL of dissolving solution (10% SDS/5% isobutanol/0.012 M HCl, w/v/v) was added into the plate and the reaction stopped. The absorbency of the solution was measured in a microplate reader at 570 nm. All measurements were performed in triplicate. Cell viability (%) was calculated from the absorbency using the same equation in section 2.6.2.
2.8. Cellular uptake of liposomes by PBNs and fluorescence imaging in vivo
Roughly, 3 weeks after A549 tumor model xenograft (once tumors reached ∼400 mm3 without ulceration), the cellular uptake and fluorescence imaging in vivo experiments began. A549-tumor bearing mice (n = 3) were administered intravenously with DiR-CL (0.65 mg·kg–1), DiR-PL (0.65 mg·kg–1), and DiR-PSL (0.65 mg·kg–1) via the tail vein. At predetermined post-injection time points (1, 4, 8, and 24 hours), blood was collected from the retro-orbital sinus. Then, the PBNs were isolated from blood by the process mentioned in section 2.2.2. Furthermore, the amount of liposomal DiR in PBNs was measured using the method mentioned in section 2.6.1.
Simultaneously, fluorescence imaging was performed using an in vivo FX Pro imaging system and analyzed using a Carestream Molecular Imaging software (Kodak, Rochester, NY). The excitation wavelength was set at 720 nm, and the emission wavelength was at 790 nm. Furthermore, the liposomes or PBN containing liposomes accumulated in tumors were evaluated by a quantitative region-of-interest (ROI) analysis on the DiR signal variation in vivo and ex vivo.
2.9. In vivo antitumor efficacy and toxicity
Antitumor activities of the Pix formulations were investigated by a xenograft nude mice model of A549 tumor. Briefly, A549 tumor-bearing mice randomly were divided into five groups, six mice of each. Pix solution (Pix-S), Pix-CL, Pix-PL, or Pix-PSL were injected via tail vein at the dose of 10 mg Pix/kg on days 14, 17, 20, 23, and 26. The control group mice were injected a 5% glucose solution (5% Glu). Throughout the trial, the mice were weighed every three days, and the tumor size was determined with an electronic vernier caliper. The tumor volume was calculated by using the formula 0.5 × (a×b2), where ‘a’ and ‘b’ represent the largest and the smallest diameter, respectively.
Though the tumor volume and body weight are always regarded as classical parameters in anti-tumor experiments, they are mutually independent indexes when evaluating the anti-tumor effect and toxicity in vivo. Therefore, we proposed the tumor-inhibition (TI) index as a comprehensive parameter for evaluating both anti-tumor effect and toxicity. TI was calculated using the following equation:
(2)
(2)
The mice were sacrificed on day 32 when the average tumor size of control group was over 1000 mm3 or ulceration appeared. The tumors were harvested and fixed in paraformaldehyde in PBS (4% v/v), embedded in paraffin, and cut into ∼5 μm slices for immunohistochemistry (IHC) staining. The tumor slices were placed in 10 mM citrate buffer (pH 6.0) for 10 min for antigen retrieval. Endogenous peroxidase in sections was inactivated in 0.3% H2O2 for 15 min to inhibit endogenous peroxidase activity (Mishalian et al., Citation2013). The sections were then blocked in normal goat serum, followed by incubation in monoclonal antibody specific for rabbit anti-mouse Gr-1 antibody (Biolegend, San Diego, CA). Sections were incubated with anti-rabbit HRP (Biolegend, San Diego, CA) for 30 min following three washes with PBS. Reaction product was visualized using streptavidin-peroxidase kit (Zhongshan Goldenbridge Biotechnology Co., Ltd., Zhongshan, China). Immunoreaction products were visualized in a 3,3′-diaminobenzidine/H2O2 solution (Shimura et al., Citation2000). Stained cells were imaged by an optical microscope. IHC quantification was performed on four randomly selected high power fields per tumor section. Sections were quantified by using the Image-Pro Plus 6.0 software (Media Cybernetics, Silver Spring, MD). The number of positive stained cells for the phenotypic marker in each area was counted. The density of TANs was expressed as cell number per mm2 (Ma et al., Citation2010).
2.10. Statistical analysis
All data were shown as the mean ± standard deviation (S.D.). Statistical comparisons were performed by a two-tailed unpaired Student’s t-test or analysis of ANOVAs with SPSS 16 software (SPSS, Chicago, IL). p Values lower than .05 were considered to be significant.
3. Results and discussion
3.1. Characterization of polysaccharide-derivative
The procedure used to synthesize the PSA–ODA is shown schematically in Figure S1A. ODA was conjugated to PSA via a carbamate linkage between the primary amine group in ODA and the terminal hydroxyl group in PSA, activating the latter with pNC.
The structure of the resulting PSA–ODA was characterized by 1H NMR (Figure S1B). The NMR peaks for the PSA–ODA were consistent with previous reports: 1.90 ppm (s, CH3–CO–, PSA), 1.25–1.35 ppm (m, –CH2–, ODA) and 0.88 ppm (t, –CH3, ODA). Further, the conjugation of ODA to PSA was verified using FT-IR spectroscopy (Figure S1C). The spectra of PSA–ODA showed: a peak at 1738 cm–1, attributed to CO stretching of the carbamate linkage (–OCO–NH–); peaks at 2852 and 2919 cm–1, attributed to C–H stretching of ODA; and, a peak at 1638 cm–1, attributed to CO stretching of the carboxylic groups of PSA. The 1H NMR and FT-IR spectra therefore confirm that PSA–ODA was successfully synthesized using the method employed in this study.
3.2. The characterization of liposomes
Drummond et al. reported that many properties of liposomes would effect on in vivo behavior of liposomal drugs, such as the particle size and zeta potential (Drummond et al., Citation1999). Therefore, summarizes the particle size, zeta potential, EE of liposomes. The Pix-loaded liposomes morphology was further examined using transmission electron microscopy. As shown in , the liposomes existed as homogeneous spheres with a typical lipid bilayer and the mean diameter of liposomes was less than 200 nm. The liposomes were slightly aggregated due to the evaporation of moisture during the preparation process of the sample. There were no significant differences in morphology between the six groups of liposomes.
Figure 1. TEM images of (A) Pix-CL, (B) Pix-PL, and (C) Pix-PSL. The scale bars represent 200 nm.
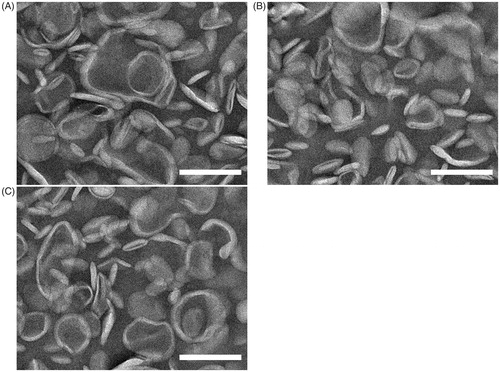
Table 1. Composition and characterization of liposomes (n = 3).
3.3. Isolation of peripheral blood neutrophils
Murine neutrophils were isolated from peripheral blood and purified by density-gradient centrifugation with a yield of about 8 × 10⁵ cells per mice. The cell viability was determined to be over 90%, and the typical morphological images of PBNs were stained with Diff-Quik and observed in Figure S2A. The purity was quantified to be higher than 95% (Figure S2B).
3.4. PBN containing liposomes cell models
3.4.1. Loading and quantification of liposomes into PBNs
PBN containing liposomes cell models was obtained by incubating the purified PBNs with liposomes, and then collecting cells by centrifugation. As shown in Figure S3, there was no significant difference between DiR-labeled liposomes and Pix-loaded liposomes with respect to PBN uptake efficiency (p > .05), which may be attributed to the fact that Pix and DiR were encapsulated in liposomes and that the surface properties of liposomes were not different. In a detail, the Pix loading content per million PBNs was determined to be 65.6 ± 4.6, 11.4 ± 3.2, 21.8 ± 2.4, and 36.5 ± 4.4 μg for Pix-S, Pix-CL, Pix-PL, and Pix-PSL, respectively. The relatively high drug loading of Pix-PSL could be mainly attributed to ligand-receptor-mediated uptake of Pix-PSL by PBNs which express high levels of l-selectin.
3.4.2. Cell viability of the PBN containing liposomes cell models
The in vitro cell viability of the PBN containing Pix models was evaluated using CCK8. The inhibitory ratios for the different Pix formulations in PBNs were all dose-dependent. As described in Figure S4, Pix-S had the lowest cell viability, whereas in comparison, Pix-CL, Pix-PL, and Pix-PSL showed the significantly higher cell viability at the final concentration of Pix ranging from 100 to 300 μg/mL, indicating that the Pix-loaded liposomes had negligible cytotoxicity toward PBNs at 100 μg/mL of Pix with a 30-minute incubation, which may be attributed to the slow drug release from the liposomes (Keizer et al., Citation1990) and laying a foundation for PBNs to be loaded with liposomal Pix. There was a significant difference in cell viability between the Pix-PSL and Pix-PL up to 100 (p < .05) and 300 (p < .01) μg·mL–1 of Pix. There may be two reasons for the phenomenon: (i) SA residues on the Pix-PSL can act as ligands that bind specifically to l-selectin expressed on PBNs, which leads to a rapid cellular uptake and a significant anti-proliferative activity and (ii) the steric hindrance of the PEG layer and a greater stability of Pix-PL, which leads to poor cellular internalization and low cytotoxicity (Duggan & Keating, Citation2011).
3.4.3. Release of Pix from PBN containing Pix models
The Pix release from PBN containing Pix models was evaluated under physiological conditions. As shown in Figure S5, PBN containing Pix-loaded liposomes was relatively stable and showed a sustained-release, which may be due to the negligible cytotoxicity of liposomal Pix toward PBNs. In contrast, PBN containing free Pix exhibited a burst of Pix release within an hour, which could be attributed to the much higher cytotoxicity of free Pix compared to that of liposomal Pix. These results indicate that PBN containing liposomal Pix can provide a sustained-release of Pix during the recruitment process, while a rapid Pix release was found to occur from PBN containing free Pix.
3.4.4. Intracellular transport of liposomes from PBNs
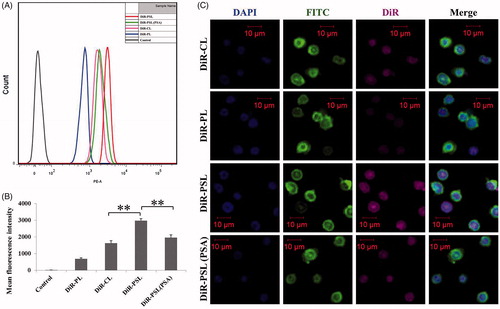
To investigate the cellular uptake of liposomes by PBNs, the intracellular localization of liposomes in the PBNs was determined by FCM and CLSM. shows that the amount of cellular uptake of DiR in the DiR-PL group by PBNs was lower than that of the other groups, indicating the poor cellular internalization of DiR-PL (Duggan & Keating, Citation2011). Of note, the PSA–ODA modification improved the cellular uptake of liposomes. DiR-PSL group was efficiently internalized by PBNs and presented a significantly higher cellular uptake compared to DiR-CL group (p < .01). Moreover, the cellular uptake of DiR-PSL by PBNs was significantly inhibited by PSA solution (p < .01). This result suggests that with free PSA can serve as a competitive inhibitor, with the uptake of DiR-PSL being reduced due to the decreased availability of the l-selectin (SA receptor) on the cell surface. These data also indicate that DiR-PSL is specifically targeted at l-selectin. All of these findings taken together directly support the conclusion that the PSA–ODA decoration improves the specific uptake of liposomes by PBNs, as a result of the expression of the l-selectin receptor on the surface of PBNs (Coussens & Werb, Citation2002) and a direct interaction with the modified PSA on the surface of the DiR-PSL. FCM and CLSM analysis proved that the uptake of DiR-PSL by PBNs was significantly greater than the uptake of DiR-CL and DiR-PL.
Figure 2. In vitro cellular uptake of DiR-labeled liposomes by PBNs after 30 min. (A) FCM analysis of the PBNs treated with DiR-CL, DiR-PL, DiR-PSL, and DiR-PSL (PSA). (B) Quantitative analysis of the FCM data (**p < .01). (C) Confocal images of the PBNs incubated with DiR-CL, DiR-PL, DiR-PSL, and DiR-PSL (PSA). The scale bars represent 10 μm. Data are shown as mean ± S.D. (n = 3).
3.4.5. Intercellular transport of liposomes from PBNs to A549 cells
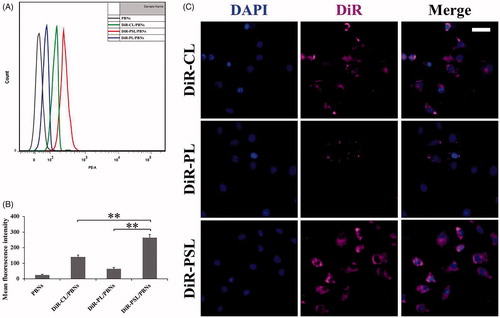
We further evaluated the intercellular trafficking of liposomes from PBNs to A549 cells. The PBN containing liposome models was obtained as mentioned in section 2.6.4, which were labeled with DiR (purple). In order to assess the uptake of DiR-PSL by A549 cells, the PBN containing liposome models were incubated with A549 cells. The PBN containing DiR-labeled liposome models were stained purple, while DAPI staining (blue) was used to identify the nucleus. As described in , the level of cellular uptake of the DiR-PL group by the A549 cells was the lowest of all the groups. Notably, the cellular uptake of DiR-PSL was the highest, and was significantly greater than the uptake of DiR-CL (p < .01). This result could be attributed to the fact that the amount of liposomes in the PBNs was in the order DiR-PSL > DiR-CL > DiR-PL.
Figure 3. Cellular uptake of DiR-CL/PBNs, DiR-PL/PBNs, and DiR-PSL/PBNs by A549 cells in vitro after two hours. (A) FCM analysis of the A549 cells treated with DiR-CL/PBNs, DiR-PL/PBNs, and DiR-PSL/PBNs. (B) Quantitative analysis of the FCM (**p < .01). (C) Confocal images of the A549 incubated with DiR-CL/PBNs, DiR-PL/PBNs, and DiR-PSL/PBNs. The scale bar represents 20 μm. Data are shown as mean ± S.D. (n = 3).
Furthermore, CLSM images were used to confirm the FCM data. As shown in , the mean DiR fluorescence intensity in the A549 cells for DiR-PSL was higher than that from either DiR-CL or DiR-PL, which was consistent with the FCM data.
These data verify that PSA-modified liposomes could be more efficiently delivered from PBNs to A549 cells compared to unmodified liposomes or PEG-modified liposomes.
3.5. Cytotoxicity of Pix formulations and PBN containing Pix models against A549 cells
The in vitro cytotoxicity of the Pix formulations, and PBN containing Pix models, was evaluated in A549 cells. As shown in Figure S6A, the anti-proliferative effect of all the Pix formulations against A549 cells was dose-dependent. The IC50 values of the Pix formulations are presented in Figure S6B. In A549 cells, Pix-S had the lowest IC50, whereas Pix-PL had the highest IC50 compared with other Pix formulations, indicating that the cytotoxicity of Pix-S toward A549 cells is relatively low. It may be due to the slow drug release from the liposomes and steric hindrance by the PEG layer, which results in poor cellular internalization (Duggan & Keating, Citation2011). Pix-PSL tended to have a better anti-proliferative effect on A549 cells compared to Pix-CL (p < .05) demonstrating that the modification of PSA–ODA on the Pix-loaded liposomes increases the cytotoxicity of Pix compared with non-modified liposomes leading to a more effective uptake by tumor cells which is in agreement with the in vitro release data for Pix-PSL.
The anti-proliferative effect of the PBN containing Pix models toward A549 cells was also investigated. As shown in Figure S6C, Pix-PSL/PBNs showed a significantly higher cytotoxicity toward A549 cells compared to Pix-PL/PBNs, at the amount of PBNs ranging from 106 to 107 cells (p < .05), indicating that Pix-PSL/PBNs exhibited an anti-proliferative activity against A549 cells. Notably, Pix-S/PBNs tended to have negligible cytotoxicity toward A549 cells at all the studied concentrations, which suggests that the Pix-S could effectively inhibit PBNs. These findings indicate that Pix-PSL/PBNs can provide an effective anti-tumor effect.
3.6. In vivo cellular uptake of liposomes by PBNs
We further explored the cellular uptake of liposomes by PBNs in vivo. As shown in Figure S7A, there were evident differences in the fluorescence versus time profiles for the different DiR-labeled liposomes. Furthermore, as shown in Figure S7B, the total amount of liposomes taken up by PBNs ranged from 0 to 24 hours post-injection. The relatively higher uptake efficiencies for DiR-CL and DiR-PL compared to the control occurred in that DiR-CL and DiR-PL are regarded as foreign bodies and are efficiently removed by the PBNs (Nathan, Citation2006; Vij et al., Citation2016; Xue et al., Citation2017). More importantly, DiR-PSL presented an extremely high degree of uptake by PBNs. The area under the mean fluorescence intensity of DiR in PBNs versus time curve for DiR-PSL was 169% and 218% higher than that of DiR-CL and DiR-PL, respectively. These data demonstrate that PSA-modified liposomes are more efficiently taken up by PBNs in vivo compared to unmodified liposomes or PEG-modified liposomes.
3.7. Bio-distribution in A549 tumor-bearing mice
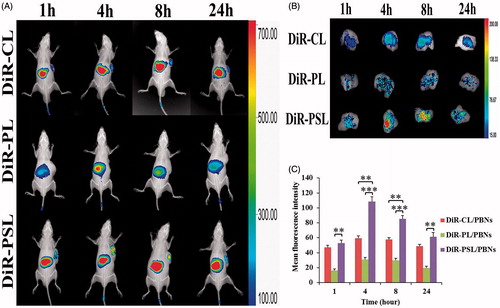
According to the uptake of liposomes by PBNs, described in section 3.6, we further anticipated that PBNs could be regarded as bio-carriers for the tumor targeted delivery of liposomes along the chemotactic gradient produced from the tumor site (Dvorak, Citation1986; Xue et al., Citation2017). Therefore, the tumor targetability of DiR-PSL/PBNs, DiR-CL/PBNs, and DiR-PL/PBNs was assessed in an A549 tumor-bearing mice model in vivo. As shown in , a relatively high DiR accumulation was examined in the liver compared to other organs, which is mainly owing to the intrinsic migratory capacity of PBNs to this reservoir (Summers et al., Citation2010). More importantly, DiR-PSL/PBNs showed a significantly stronger capability of A549 tumor targeting than DiR-CL/PBNs or DiR-PL/PBNs in this mouse model. The tumors were harvested and then examined by ex vivo fluorescence imaging. As shown in , the highest DiR signal was observed in the tumor region of the A549 tumor-bearing mice collected at 4 h post-injection from the DiR-PSL/PBNs group. Furthermore, the mean DiR fluorescence intensity at the tumor sites for DiR-PSL/PBNs was determined to be higher than that for DiR-CL/PBNs and DiR-PL/PBNs, which were 112%, 183%, 148%, and 126% relative to the DiR-CL/PBNs group, and 325%, 351%, 286%, and 314% relative to the DiR-PL/PBNs group, respectively. This effect may be because DiR-PSL is taken up by PBNs more easily than DiR-PLs so that the amount of liposomes in the DiR-CL/PBNs was much greater than that in the DiR-CL/PBNs and DiR-PL/PBNs. These data suggest that the tumor-associated inflammatory response (Waage et al., Citation1989; Floyd et al., Citation2011) results in an enhanced A549 tumor-targeting effect of PBNs (Xue et al., Citation2017), which explains the increased tumor accumulation of DiR-PSL.
Figure 4. In vivo fluorescence imaging of the A549 tumor-bearing mice at different time points following injection of (A) PBN containing DiR-labeled liposome models. Following this, (B) the tumors from the PBN containing DiR-labeled liposomes group were harvested and imaged by ex vivo fluorescence. (C) The PBN containing the DiR-labeled liposomes accumulated in tumors was measured by a ROI analysis of the DiR signal variation. Data are shown as mean ± S.D. (n = 3) (**p<.01, ***p<.001).
3.8. Antitumor activity and toxicity evaluation
Currently, most pre-clinical experiments are conducted using xenografts of human tumors in immune-deficient mice, which have a good correlation with human tumors. Therefore, in this study, A549 cells were chosen for transplantation into BALB/c nu/nu mice to evaluate the in vivo anti-tumor efficacy of the Pix formulations.
As shown in , all the treatment groups showed a inhibited tumor growth compared with the 5% Glu group. More importantly, Pix-PSL group was more significantly inhibited after five injections than Pix-CL and Pix-PL groups (p < .01). Reports have discovered that some in vivo uptake of liposomes could occur if the target cells are rapidly accessible, because of the dynamic flow environment (Allen & Cullis, Citation2013; Xue et al., Citation2017). Similarly, the excellent anti-tumor activity of Pix-PSL can be partly explained by the fact that neutrophil-mediated DDS leads to inhibition of the tumor. A likely explanation for this anti-tumor effect is shown as follows: the PSA ligand on the surface of liposomes directly binds to the l-selectin on the surface of PBNs after which the circulating DiR-PSL/PBNs are recruited by the tumor site which enhances the tumor cellular internalization of Pix leading to a high degree of cell cytotoxicity. The hypothesis can be supported by the data showing that there is increasing uptake of Pix-PSL/PBNs by A549 cells both in cellular uptake studies and in the in vivo bio-distribution study. As a result, a sufficient amount of cytotoxic Pix is delivered to the tumor site, resulting in passive targeting of the tumor.
Figure 5. (A) Tumor growth curve of A549 tumor-bearing mice injected with the different Pix formulations. (B) Body weight change in A549 tumor-bearing mice administered with the different Pix formulations. (C) Tumor-inhibition index change in A549 tumor-bearing mice administered with the different Pix formulations. (D) Immunohistochemistry staining of different experimental groups within tumor stroma. The scale bar represents 50 μm. Data are shown as mean ± S.D. (n = 5–6). The black arrows represent the injection of Pix formulations. N.S. represents not significant (p > .05) (**p < .01, ***p < .001).
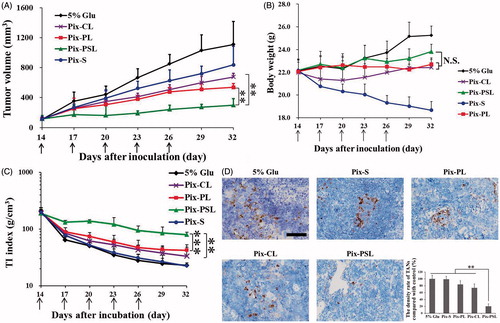
To investigate whether the difference in the antitumor efficacy owing to the amount of TANs in tumor tissues, we further assessed the expression of well-characterized markers for TANs within the tumor microenvironment. shows the depletion of TANs in slices of tumor masses by IHC staining. TANs identified by Gr-1 were defined as cells with oval to round nuclei that exhibited loci heavily staining (Brill et al., Citation2012). A large amount of TANs was observed in tumor after treatment with 5% Glu as control, while the depletion of TANs was not significantly obvious after treatment with Pix-S, Pix-CL, and Pix-PL, respectively (p>.05). Notably, significantly fewer Gr-1+ cells were observed in the Pix-PSL treated group (p < .01), which indicated that the TANs had an utmost depletion among all of the tested formulations. This might be explained that Pix-PSL was indeed capable of delivering Pix into TANs and achieving optimal destroying effect on TANs in comparison to other Pix formulations.
The final purpose of cancer therapy is to improve the quality of life (QOL) of the patient by decreasing the systemic toxicity of chemotherapy (Byrne et al., Citation2008). Therefore, the body weight of the tumor-bearing mice was used as a classical parameter to characterize the QOL. As shown in , a sharp decline of body weight was observed from day 14, indicating the high toxicity of Pix-S. Compared with the Pix-S group, the body weight of the liposomal Pix groups increased gradually, reflecting the slighter systemic toxicity of liposomal Pix. However, a mere comparison of body weight was not sensitive enough to distinguish the toxicity difference among different liposomal Pix groups (p>.05).
Therefore, the TI index as a comprehensive parameter was defined to characterize the QOL, including anti-tumor effect and toxicity. As described in , the TI index of mice treated with Pix-PSL was significantly larger than that of mice treated with Pix-CL (p < .05) and Pix-PL (p < .01), suggesting that Pix-PSL had both the lower toxicity and better anti-tumor effect among the liposomal Pix groups. In contrast, Pix-S group had the smallest TI index among the different formulations tested here, which was almost the same as that of the control group. These data indicate that the high toxicity of Pix-S results in lowest QOL, though Pix-S had a slight suppression of A549 tumor (24.6 ± 22.5%). Overall, it is believed that TI index will offer a new parameter to improve the accuracy of the antitumor evaluation and the clinical translation of the basic research.
4. Conclusions
Neutrophil-mediated liposomal Pix targeting in the tumor microenvironment is a promising approach for anti-tumor treatments. In this study, a PSA–ODA conjugate was synthesized and used to decorate the surface of liposomal Pix. The results of the present work validate the targetability of Pix-PSL to PBNs, and then that Pix-PSL/PBNs could be recruited to tumor sites guided by inflammatory factors, delivering the chemotherapeutics to the A549 tumor in a spontaneous and on-demand manner. The TI index as a comprehensive parameter was used to characterize the QOL, taking account of anti-tumor effect and toxicity, simultaneously. Notably, Pix-PSL had the largest TI index, indicating a higher anti-tumor effect and a lower systemic toxicity. In summary, our studies develop a neutrophil-mediated DDS for anti-tumor treatment, which may have potential to be translated into the clinical utilization of PBNs isolated from humans in the future.
Supplemental Material
Download MS Word (1 MB)Disclosure statement
No potential conflict of interest was reported by the authors.
Additional information
Funding
Related Research Data
References
- Akita S, Hattori N, Masuda T, et al. (2015). MT95‐4, a fully humanized antibody raised against aminopeptidase N, reduces tumor progression in a mouse model. Cancer Sci 106:921–8.
- Allen TM, Cullis PR. (2004). Drug delivery systems: entering the mainstream. Science 303:1818–22.
- Allen TM, Cullis PR. (2013). Liposomal drug delivery systems: from concept to clinical applications. Adv Drug Deliv Rev 65:36–48.
- Arbonés ML, Ord DC, Ley K, et al. (1994). Lymphocyte homing and leukocyte rolling and migration are impaired in l-selectin-deficient mice. Immunity 1:247–60.
- Bekes EM, Schweighofer B, Kupriyanova TA, et al. (2011). Tumor-recruited neutrophils and neutrophil TIMP-free MMP-9 regulate coordinately the levels of tumor angiogenesis and efficiency of malignant cell intravasation. Am J Pathol 179:1455–70.
- Benevides L, Da FD, Donate PB, et al. (2015). IL17 promotes mammary tumor progression by changing the behavior of tumor cells and eliciting tumorigenic neutrophils recruitment. Cancer Res 75:3788–99.
- Brill A, Fuchs TA, Savchenko AS, et al. (2012). Neutrophil extracellular traps promote deep vein thrombosis in mice. J Thromb Haemost 10:136–44.
- Byrne JD, Betancourt T, Brannon-Peppas L. (2008). Active targeting schemes for nanoparticle systems in cancer therapeutics. Adv Drug Deliv Rev 60:1615–26.
- Cavalletti E, Crippa L, Mainardi P, et al. (2007). Pixantrone (BBR 2778) has reduced cardiotoxic potential in mice pretreated with doxorubicin: comparative studies against doxorubicin and mitoxantrone. Invest New Drugs 25:187–95.
- Chang Y, Yang S-T, Liu J-H, et al. (2011). In vitro toxicity evaluation of graphene oxide on A549 cells. Toxicol Lett 200:201–10.
- Cho K, Wang X, Nie S, Shin DM. (2008). Therapeutic nanoparticles for drug delivery in cancer. Clin Cancer Res 14:1310–6.
- Coffelt SB, Kersten K, Doornebal CW, et al. (2015). IL17-producing γδ T cells and neutrophils conspire to promote breast cancer metastasis. Nature 522:345.
- Coussens LM, Tinkle CL, Hanahan D, Werb Z. (2000). MMP-9 supplied by bone marrow-derived cells contributes to skin carcinogenesis. Cell 103:481.
- Coussens LM, Werb Z. (2002). Inflammation and cancer. Nature 420:860.
- Cullis PR, Hope MJ, Bally MB, et al. (1997). Influence of pH gradients on the transbilayer transport of drugs, lipids, peptides and metal ions into large unilamellar vesicles. Biochim Biophys Acta (BBA)-Rev Biomembr 1331:187–211.
- Drummond DC, Meyer O, Hong K, et al. (1999). Optimizing liposomes for delivery of chemotherapeutic agents to solid tumors. Pharmacol Rev 51:691–744.
- Duggan ST, Keating GM. (2011). Pegylated liposomal doxorubicin: a review of its use in metastatic breast cancer, ovarian cancer, multiple myeloma and AIDS-related Kaposi's sarcoma. Drugs 71:2531–58.
- Dumitru CA, Lang S, Brandau S. (2013). Modulation of neutrophil granulocytes in the tumor microenvironment: mechanisms and consequences for tumor progression. Semin Cancer Biol 23:141–8.
- Dvorak HF. (1986). Tumors: wounds that do not heal. Similarities between tumor stroma generation and wound healing. N Engl J Med 315:1650.
- Engblom C, Pfirschke C, Zilionis R, et al. (2017). Osteoblasts remotely supply lung tumors with cancer-promoting SiglecFhigh neutrophils. Science 358:eaal5081.
- English D, Andersen BR. (1974). Single-step separation of red blood cells, granulocytes and mononuclear leukocytes on discontinuous density gradients of Ficoll-Hypaque. J Immunol Methods 5:249–52.
- Eruslanov EB, Bhojnagarwala PS, Quatromoni JG, et al. (2014). Tumor-associated neutrophils stimulate T cell responses in early-stage human lung cancer. J Clin Invest 124:5466.
- Feng Y, Santoriello C, Mione M, et al. (2006). Live imaging of innate immune cell sensing of transformed cells in zebrafish larvae: parallels between tumor initiation and wound inflammation. PLoS Biol 34:347–73.
- Fernandes AI, Gregoriadis G. (1997). Polysialylated asparaginase: preparation, activity and pharmacokinetics. Biochim Biophys Acta (BBA)-Protein Struct Mol Enzymol 1341:26–34.
- Fernandes AI, Gregoriadis G. (2001). The effect of polysialylation on the immunogenicity and antigenicity of asparaginase: implication in its pharmacokinetics. Int J Pharm 217:215–24.
- Floyd RA, Chandru HK, He T, Towner R. (2011). Anti-cancer activity of nitrones and observations on mechanism of action. ACAMC 11:373–9.
- Fossati G, Ricevuti G, Edwards SW, et al. (1999). Neutrophil infiltration into human gliomas. Acta Neuropathol 98:349.
- Frangioni JV. (2003). In vivo near-infrared fluorescence imaging. Curr Opin Chem Biol 7:626–34.
- Fridlender ZG, Sun J, Kim S, et al. (2009). Polarization of tumor-associated neutrophil phenotype by TGF-beta: “N1” versus “N2” TAN. Cancer Cell 16:183.
- Gerlier D, Thomasset N. (1986). Use of MTT colorimetric assay to measure cell activation. J Immunol Methods 94:57–63.
- Gregoriadis G, Fernandes A, Mital M, Mccormack B. (2000). Polysialic acids: potential in improving the stability and pharmacokinetics of proteins and other therapeutics. CMLS Cell Mol Life Sci 57:1964–9.
- Johnson CP, Fujimoto I, Rutishauser U, Leckband DE. (2005). Direct evidence that neural cell adhesion molecule (NCAM) polysialylation increases intermembrane repulsion and abrogates adhesion. J Biol Chem 280:137–45.
- Kaufmann SH. (2008). Immunology's foundation: the 100-year anniversary of the Nobel Prize to Paul Ehrlich and Elie Metchnikoff. Nat Immunol 9:705–12.
- Keizer H, Pinedo HM, Schuurhuis GJ, Joenje H. (1990). Doxorubicin (adriamycin): a critical review of free radical-dependent mechanisms of cytotoxicity. Pharmacol Ther 47:219–31.
- Khan N, Hadi N, Afaq F, et al. (2007). Pomegranate fruit extract inhibits prosurvival pathways in human A549 lung carcinoma cells and tumor growth in athymic nude mice. Carcinogenesis 28:163–73.
- Kibria G, Hatakeyama H, Sato Y, Harashima H. (2016). Anti-tumor effect via passive anti-angiogenesis of PEGylated liposomes encapsulating doxorubicin in drug resistant tumors. Int J Pharm 509:178–87.
- Li J, Wang XL, Zhang T, et al. (2015). A review on phospholipids and their main applications in drug delivery systems. Asian J Pharm Sci 10:81–98.
- Luo X, Li J, Guo L, et al. (2013). Preparation of berberine hydrochloride long-circulating liposomes by ionophore A23187-mediated ZnSO4 gradient method. Asian J Pharm Sci 8:261–6.
- Ma J, Liu L, Che G, et al. (2010). The M1 form of tumor-associated macrophages in non-small cell lung cancer is positively associated with survival time. BMC Cancer 10:112.
- Mayadas TN, Cullere X, Lowell CA. (2014). The multifaceted functions of neutrophils. Annu Rev Pathol 9:181–218.
- Mishalian I, Bayuh R, Levy L, et al. (2013). Tumor-associated neutrophils (TAN) develop pro-tumorigenic properties during tumor progression. Cancer Immunol Immunother 62:1745–56.
- Moore RJ, Owens DM, Stamp G, et al. (1999). Mice deficient in tumor necrosis factor-|[alpha]| are resistant to skin carcinogenesis. Nat Med 5:828.
- Nathan C. (2006). Neutrophils and immunity: challenges and opportunities. Nat Rev Immunol 6:173.
- Péan E, Flores B, Hudson I, et al. (2013). The European Medicines Agency review of pixantrone for the treatment of adult patients with multiply relapsed or refractory aggressive non-Hodgkin's B-cell lymphomas: summary of the scientific assessment of the committee for medicinal products for human use. Oncologist 18:625–33.
- Pettengell R, Coiffier B, Narayanan G, et al. (2012). Pixantrone dimaleate versus other chemotherapeutic agents as a single-agent salvage treatment in patients with relapsed or refractory aggressive non-Hodgkin lymphoma: a phase 3, multicentre, open-label, randomised trial. Lancet Oncol 13:696–706.
- Powell DR, Huttenlocher A. (2016). Neutrophils in the tumor microenvironment. Trends Immunol 37:41–52.
- Queen MM, Ryan RE, Holzer RG, et al. (2005). Breast cancer cells stimulate neutrophils to produce oncostatin M: potential implications for tumor progression. Cancer Res 65:8896.
- Raccosta L, Fontana R, Maggioni D, et al. (2013). The oxysterol-CXCR2 axis plays a key role in the recruitment of tumor-promoting neutrophils. J Exp Med 210:1711.
- Rotondo R, Barisione G, Mastracci L, et al. (2009). IL-8 induces exocytosis of arginase 1 by neutrophil polymorphonuclears in nonsmall cell lung cancer. Int J Cancer 125:887–93.
- Rutishauser U. (2008). Polysialic acid in the plasticity of the developing and adult vertebrate nervous system. Nat Rev Neurosci 9:26–35.
- Samad A, Sultana Y, Aqil M. (2007). Liposomal drug delivery systems: an update review. Curr Drug Deliv 4:297–305.
- Sauvage F, Franzè S, Bruneau A, et al. (2016). Formulation and in vitro efficacy of liposomes containing the Hsp90 inhibitor 6BrCaQ in prostate cancer cells. Int J Pharm 499:101–9.
- She Z, Zhang T, Wang X, et al. (2014). The anticancer efficacy of pixantrone-loaded liposomes decorated with sialic acid–octadecylamine conjugate. Biomaterials 35:5216–25.
- Shimura S, Yang G, Ebara S, et al. (2000). Reduced infiltration of tumor-associated macrophages in human prostate cancer: association with cancer progression. Cancer Res 60:5857–61.
- Summers C, Rankin SM, Condliffe AM, et al. (2010). Neutrophil kinetics in health and disease. Trends Immunol 31:318–24.
- Sun J, Song Y, Lu M, et al. (2016). Evaluation of the antitumor effect of dexamethasone palmitate and doxorubicin co-loaded liposomes modified with a sialic acid–octadecylamine conjugate. Eur J Pharm Sci 93:177–83.
- Taurin S, Nehoff H, Greish K. (2012). Anticancer nanomedicine and tumor vascular permeability; where is the missing link? J Control Release 164:265–75.
- Udagawa T, Wood M. (2010). Tumor–stromal cell interactions and opportunities for therapeutic intervention. Curr Opin Pharmacol 10:369–74.
- Van Vlasselaer P. 1998. Methods for enriching specific cell-types by density gradient centrifugation. US.
- Vij N, Min T, Bodas M, et al. (2016). Neutrophil targeted nano-drug delivery system for chronic obstructive lung diseases. Nanomed: Nanotechnol Biol Med 12:2415–27.
- Viola A, Sarukhan A, Bronte V, Molon B. (2012). The pros and cons of chemokines in tumor immunology. Trends Immunol 33:496–504.
- Waage A, Halstensen A, Shalaby R, et al. (1989). Local production of tumor necrosis factor alpha, interleukin 1, and interleukin 6 in meningococcal meningitis. Relation to the inflammatory response. J Exp Med 170:1859–67.
- Wang H, Zhao Y, Wu Y, et al. (2011). Enhanced anti-tumor efficacy by co-delivery of doxorubicin and paclitaxel with amphiphilic methoxy PEG-PLGA copolymer nanoparticles. Biomaterials 32:8281–90.
- Wislez M, Rabbe N, Marchal J, et al. (2003). Hepatocyte growth factor production by neutrophils infiltrating bronchioloalveolar subtype pulmonary adenocarcinoma: role in tumor progression and death. Cancer Res 63:1405.
- Woods JA, Davis JM, Smith JA, Nieman DC. (1999). Exercise and cellular innate immune function. Med Sci Sports Exerc 31:57–66.
- Xue J, Zhao Z, Zhang L, et al. (2017). Neutrophil-mediated anticancer drug delivery for suppression of postoperative malignant glioma recurrence. Nat Nanotechnol 12:692–700.
- Yang Y, Ma Y, Wang S. (2012). A novel method to load topotecan into liposomes driven by a transmembrane NH 4 EDTA gradient. Eur J Pharm Biopharm 80:332–9.
- Yang Q, Zhang T, Wang C, et al. (2014). Coencapsulation of epirubicin and metformin in PEGylated liposomes inhibits the recurrence of murine sarcoma S180 existing CD133+ cancer stem-like cells. Eur J Pharm Biopharm 88:737–45.
- Zhang T, Zhou S, Hu L, et al. (2016). Polysialic acid-modifying liposomes for efficient delivery of epirubicin, in-vitro characterization and in-vivo evaluation. Int J Pharm 515:449–59.
- Zhou S, Zhang T, Peng B, et al. (2017). Targeted delivery of epirubicin to tumor-associated macrophages by sialic acid-cholesterol conjugate modified liposomes with improved antitumor activity. Int J Pharm 523:203–16.