Abstract
The early diagnosis of oral squamous cell carcinoma (OSCC) is crucial to prevent deformity and malfunction post-surgery, as well as to allow clinicians to make a rapid decision about treatment. The aim of this study was to search a serum diagnostic model at a molecular level for OSCC. After collection and processing of serum from 28 OSCC patients and 32 healthy volunteers in the Department of Stomatology at the university hospital, samples were detected using Surface Enhanced Laser Desorption Ionization Time of Flight Mass Spectrometry (SELDI-TOF-MS) technology with CM10 protein chip and bioinformatics. Seven protein mass peaks were screened out to build a serum diagnosis model with a significant P value, respectively, and the sensitivity, specificity, and total accuracy were 93.75%, 92.86%, and 93.33%. The use of serum protein fingerprint provides a promising approach for early diagnostics, which could benefit determining preventative and therapeutic stages of patients with OSCC.
Early detection of oral squamous cell carcinoma (OSCC) is critical to avoid deformity and malfunction of swallowing, speech, head and neck activity, which may result from the radical treatment for a later diagnosis. Moreover, OSCC is a disease usually marching to recurrence and metastasis and its 5-year survival rate is only 50%, while the unique local resection for early stage of OSCC will survive 90% of these patients Citation1–3.
Physiologically and pathologically, it is proteome that controls and participates directly in the life procedures rather than the genome Citation[4]. In proteomics, the technology of micro-array and bio-informatics carved out a new way to effectively seek tumor markers. Surface enhanced laser desorption/ionization-time of flight-mass spectrometry (SELDI-TOF-MS) is such a new path to provide high-throughput protein profiling Citation[5]. In this study, the differential proteomic patterns in serum between OSCC patients and healthy individuals, respectively, were detected by SELDI-TOF-MS technology. The stereoscopic protein patterns of OSCC patients as well as detailed investigations were obtained and studied to build the OSCC diagnosis models.
METHODS
Serum Sample Preparation
All the samples were obtained from patients in the Second Affiliated Hospital, School of Medicine, Zhejiang University, after informed consent. The sera of the patients were obtained before any therapeutic measures were implemented. The diagnoses were confirmed by postsurgical pathology. The main OSCC cancer group consisted of 28 cases. The median age of the patients was 58.6 years (range 35~88 years). There were 19 males and 9 females. All the samples were collected in the early morning before breakfast, and then the sera were separated at once and stored at −80 °C until use.
Analysis of Protein Chip Array
After thawing and 2 min of centrifugation (10 000 r/min), 5 µl serum sample was added into 10 µl 0.5% U9 (9 mol/L urea, 0.2% CHAPS (3[(3-cholamidopropyl) dimethylammonio]-1-propan esulfonate), 0.1% DTT (DL-dithiothreitol)) in a 96-well plate and incubated for 30 min at 4 °C with 600 r/min vigorous shaking. The Protein Chip array cassette was put into a 96-well bioprocessor and 200 µl NaAc (50 mmol/L, pH 4.0) was put into each well and incubated for 5 min at 4 °C with 600 r/min vigorous shaking. The liquid was removed. The procedure was repeated once. Then 185 µl NaAc was added into each well in the 96-well plate (600 r/min, 2 min) and 100 µl samples disposed above of different patients were added separately into different wells of the ProteinChip array cassetteCitation[6] (600 r/min, 1 h). After the content from each well was removed, each well was washed with 200 µl NaAc (pH = 4.0, 600 r/min, 5 min). The procedure was repeated two more times. Each spot was washed with 200 µl HPLC water, which was removed immediately. The procedure was repeated once. After air drying, 1 µl SPA (sinapic acid) was applied to each spot. After air drying for 5 min, another 1 µl SPA was applied. Ciphergen SELDI Protein Biology System II plus (PBS II plus) and ProteinChip Software (Version 3.2, Ciphergen Biosystems) were used to read the chips and analyze the data. The following settings were used: laser intensity 165, 65 laser shots per sample, detector sensitivity 7, automatically detected peaks from 2,000 to 30,000 m/z. Mass accuracy was calibrated to less than 0.1% using the All-in-1 peptide molecular mass standard (Ciphergen Biosystems). The peaks were normalized and noises were filtrated (first signal to noise ratio > 2.5). Peak clusters were completed using second-pass peak selection (signal to noise ratio > 2, within 0.3% mass window) and estimated peaks were added. The biomarker wizard of Protein Chip Software 3.2 was used to compare the data of different group, discrepant mass peaks were found by Mann-Whitney U test.
Discriminant Analysis
SELDI-TOF-MS technology and CM10 Protein Chip (weak cation exchange) were used to detect the serum proteomic patterns of OSCC cancer. The samples of different stage group models were developed and validated by support vector machines and discriminant analysis Citation[6]. The data analysis was implemented by the Zhejiang University–Cancer Institute-Protein Chip Data Analysis System (ZUCI-PDAS), which was designed by Jiekai Yu on the MATLAB Web Server 1.2.4 (The MathWorks, Natick, MA). All these bioinformatics studies were integrated in the ZUCI-PDAS available at www.zlzx.net.
Discriminant analysis and support vector machines models introduced random perturbations in multiple runs to test the consistency of the top 10 ranked peaks, measured by the P value of m/z peaks of computed ranks from multiple runs. Then stage models were built using the selected peaks. The models established based on these selected biomarkers should be further validated independently. In such studies, validation datasets preferably should be from sources different from that of the original training dataset. This is one way to ensure that the performance of the selected biomarkers is not influenced by systematic biases between different groups.
Further, the leave-one-out cross-validation approach was applied to estimate the accuracy of the classifier to determine the misclassification rate. For each step of the cross-validation, one sample was left out. The possibility of obtaining a small cross-validated misclassification rate by chance was obtained by repeating the entire cross-validation procedure using n random permutations of the class labels for the clinical criteria being evaluated.
RESULTS
A total of 110 qualified and discrepant mass peaks were detected in the serum comparison of OSCC patients with healthy individuals. Through leave-one-out cross-validation, discriminant analysis screening out 7 protein mass peaks (mass to charge ratios m/z: 4181.1701, 3163.9987, 4651.8335, 5951.7588, 3979.0673, 5985.1874, and 4288.583) to build a serum diagnosis model, which could develop and evaluate the serum peptide patterns for distinguishing OSCC patients from healthy individuals, in which 5951.7588, 3979.0673, and 5985.1874 protein mass peaks were expressed significantly high in the serum of OSCC patients, while the other 4181.1701 (), 3163.9987, 4651.8335, and 4288.583 protein mass peaks were expressed significantly high in the serum of healthy individuals. The corresponding and simultaneous changes of these 7 protein mass peaks remarkably demonstrated a definite serum diagnosis model. The accuracy of the blind prediction was 93.33% (56/60). The sensitivity and specificity were 93.75% (30/32) and 92.86% (26/28), respectively ( and ).
Figure 1. Protein mass peak 4181 expressed significantly high in the serum of healthy individuals, while serum of OSCC patients presented a remarkably low protein mass peak at 4181 (P=0.0000000060).
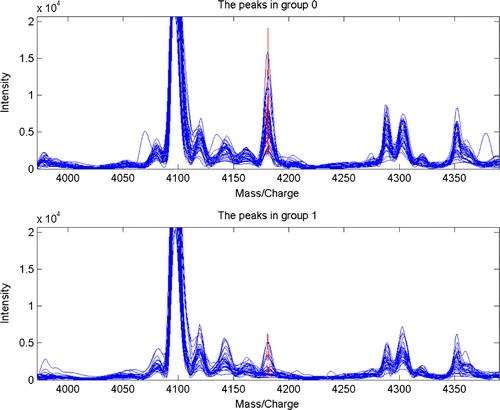
Table 1. Cross-validation results of serum model of OSCC patients and healthy individuals (cases)
Table 2. Seven selected discrepant serum protein mass peaks (m/z) comparison of OSCC patients with healthy individuals (x±SD)
DISCUSSION
Based upon the results as above, to achieve a further and comprehensive research into the consistency and reliability of the serum proteomic diagnosis model of OSCC, another 4 assistant serum batches were detected on the ground of innocent results of the central batch as presented, among the normal healthy volunteers, the leukoplaque patients, the OSCC tumor patients, and the OSCC metastasis patients (). Five integers of serum proteomic diagnosis models of OSCC were listed in the table as follows.
Table 3. Five batches of sera and their proteomic diagnosis models of OSCC
From the results of the second, fourth, and fifth batches, it was indicated that the serum protein mass/charge wave peak 4181 expressed highly in the normal volunteers group, while it expressed low in groups of patients with leukoplaque, OSCC tumor, and metastasis. The serum protein mass/charge wave peak 4651 also expressed high in the normal volunteers group, while it expressed low in groups of patients with leukoplaque and OSCC tumors. It was inferred that human serum protein mass/charge wave peaks of 4181 and 4651 definitely had a trend of low expression during the epithelium cell development from normal oral mucous membrane to leukoplaque lesion, and to malignant tumor. We suggest that the low expression of 4181 and 4651 serum proteins had a relationship on the decrease of the body's anti-mutation ability, which was either the result or the cause of tumor evolution. We further assumed that 4181 and 4651 serum proteins mass/charge peaks presentations correlated with the decline of the suppressor genes. Meanwhile, the serum protein mass/charge wave peak 5952 expressed high in groups of patients with OSCC tumor and metastasis, which inferred that human serum protein mass/charge wave peak of 5952 definitely had a trend of high expression after the epithelium cell grew into a malignant tumor as well as metastasis occurred, and from which we also further assumed that the serum protein mass/charge peak presentation at 5952 correlated with the deterioration of the oncogenes.
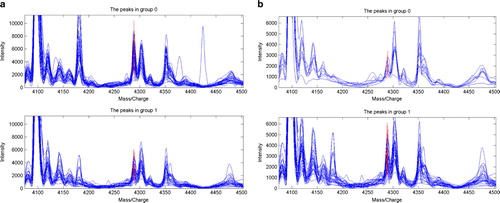
We do not think there is any conflict between the different presentations of serum protein mass/charge wave peak 4289 in the first and fifth batches (, ), which expressed highly in the normal volunteers group and low in the group of patients with OSCC tumor in the fifth batch, while it expressed highly in a group of patients with OSCC tumor and low in a group of metastasis patients with OSCC tumor in the first batch, which inferred that serum protein peak 4289 had a definite trend of low expression during the lesion advancement of oral mucous membrane epithelia from normal to leukoplaque and to malignancy, as well as metastasis of OSCC.
Figure 2. Serum protein mass/charge wave peak 4289 was expressed highly in the normal volunteers group and low in the group of patients with OSCC tumor in batch 5, while it expressed highly in the group of patients with OSCC tumor and low in the group of metastasis patients with OSCC tumor in batch 1. (a) Serum batch 5, tumor 1 vs normal 0, m/z 4289. (b) Serum batch 1, tumor 1 vs metastasis 0, m/z 4289.
CONCLUSION
The combination of Protein Chip array with time-of-flight mass spectrometry offers the advantages of speed, simplicity, sensitivity, and suitability for a comparative study. It was a proteomics technology of high sensitivity and high throughput Citation[7], Citation[8]. Because of the multifactorial nature of cancer, it is inevitable that a combination of several markers will be necessary. Tons of data could be obtained in one experiment, so sophisticated bioinformatics methods such as discriminant analysis, support vector machines (SVM), etc., were needed to collect and analyze as well as pattern recognize these complex data.
The fact that the OSCC diagnosis models of serum at a molecular and cellular level from these data were found to be of significant sense is highly encouraging. A progressive study of such prognostic markers that were based on tumor phenotype and biologic behavior would allow clinicians not only to diagnose a disease involving OSCC but also to select the most efficacious treatment modalities.
Acknowledgements
This work was supported by the Research and Development Program of Science & Technology in Zhejiang of China (2007C30030, 2008C33026).
Related Research Data
References
- Becker M.T., Shores C.G., Yu K.K., Yarbrough W.G. Molecular assay to detect metastatic head and neck squamous cell carcinoma. Arch Otolaryngol. Head Neck Surg. 2004; 130: 21–27
- Ferlito A., Shaha A.R., Rinaldo A. The incidence of lymph node micrometastases in patients with pathologically staged N0 in cancer of oral cavity and oropharynx. Oral Oncol. 2002; 38: 3–5
- Nemeth Z., Velich N., Bogdan S., et al. The prognostic role of clinical, morphological and molecular markers in oral squamous cell tumors. Neoplasma 2005; 52(2)95–102
- Resing K.A., Ahn N.G. Proteomics strategies for protein identification. FEBS Lett. 2005; 579(4)885–889
- Merchant M., Weinberger S.R. Recent advancements in surface-enhanced laser desorption/ionization-time of flight-mass spectrometry. Electrophoresis 2000; 21(6)1164–1177
- Xu, Wen-hong, Chen, Yi-ding, Hu, Yue, Yu, Jie-kai, , et al. 2006. Preoperatively molecular staging with CM10 ProteinChip and SELDI-TOF-MS for colorectal cancer patients. J Zhejiang Univ. Science B, 7(3)235–240.
- Issaq H.J., Veenstra T.D., Conrads T.P., Felschow D. The SELDI-TOF MS approach to proteomics: protein profiling and biomarker identification. Biochem. Biophys. Res. Commun. 2002; 292(3)587–592
- Weinberger S.R., Morris T.S., Pawlak M. Recent trends in protein biochip technology. Pharmacogenomics 2000; 1(4)395–416