
 ?Mathematical formulae have been encoded as MathML and are displayed in this HTML version using MathJax in order to improve their display. Uncheck the box to turn MathJax off. This feature requires Javascript. Click on a formula to zoom.
ABSTRACT
This paper addresses the impact of political regimes on carbon emissions (CO2) from a historical perspective, covering the period of 1970–2015. Our sample consists of 153 countries that we follow for 20 years before the transition (1970–1990) and 26 years after it (1990–2015). During transition, post-Communist states experienced a decline in CO2, when controlling for economic variables. Transition had a positive impact on the environment only in cases when it was associated with democratization. When transition has led to consolidation of autocratic regimes, CO2 has increased.
Introduction
The studies on political regimes and their implications for environmental challenges and policies are generally inconclusive and point in different directions (e.g., Fredriksson and Neumayer Citation2013; Fredriksson and Wollscheid Citation2007; Wagner and Schneider Citation2006).Footnote1 Some studies have argued that democracies are generally more efficient in ratification of international environmental agreements, in decentralization policies that allow for more efficient governance of commons, and in their accountability to the public, among other issues (Libman and Obydenkova Citation2014; Neumayer Citation2002; Obydenkova and Salahodjaev Citation2016, Citation2017; Ostrom Citation1990, Citation2012; Sanwal and Zheng Citation2018; Wagner and Schneider Citation2006). In the words of Eric Neumayer (Citation2002): “Strong evidence is found that democracies sign and ratify more multilateral environmental agreements, participate in more environmental intergovernmental organizations, comply better with reporting requirements under the Convention on International Trade in Endangered Species of Fauna and Flora, put a greater percentage of their land area under protections status, are more likely to have a National Council on Sustainable Development in their country and have more environmentally relevant information available than non-democracies.”
However, there is still limited evidence on how political regime transition affects environmental changes in general and carbon emissions in particular. The modernization theory of democracy posits that democratization is strongly associated with urbanization and economic growth, among other factors (Przeworski et al. Citation2000; Przeworski and Limongi Citation1993; Rodrik and Wacziarg Citation2005). Arguably, urbanization, economic growth and population are the three most important factors accountable for the increase in CO2 (Jiang et al. Citation2016; Khondaker et al. Citation2015; Roth et al. Citation2019). This paper addresses, from a historical perspective, how political regimes and transition affected carbon emissions in post-Communist states, covering the long period of 1970–2015.Footnote2 Our sample consists of 153 countries that we follow for 46 years—20 years before the start of the transition, from 1970, and 26 years after it, until 2015. The project uncovers the historical dimension of CO2 emissions during the period of communism and the bipolar world of 1970–1980 and depicts a trend of steady increase in carbon emissions across Communist states throughout the 1970s and 1980s.
The analysis presented in this paper aspires to provide a bigger picture of the implications of communism and post-Communist political regime transition for one of the main environmental challenges. The paper aims to provide the necessary wider context on the nexus of (post-)Communist states and the implications of their political regimes for the environment both chronologically and geographically. This analysis paves the way to a better understanding of follow-up discussions in this special issue on the triangle of democratization, environmental challenges, and the role of international organizations (democracies-composed and those led by autocracies) in post-Communist states.
Our findings indicate that the post-Communist democratization process decreases carbon emissions, after controlling for changes in income that capture economic decline along with other controls. An increase in the level of democracy was still associated with a decrease in CO2 despite increasing urbanization indicative of a higher quality of life and despite increases in economic growth and population after the end of the economic decline in the 1980s–1990s. The paper also confirms the logic of the environmental Kuznets curve, which is highly important for understanding the environmental challenges of post-Communist transition paralleled by transition to a market economy and an increase in income. According to the Kuznets curve, an initial increase in per capita income increases carbon emissions per capita until the per capita income reaches a certain point, after which further economic growth is associated with a decrease in CO2 emissions per capita.
The analysis controls for a number of economic, socio-cultural, geographic, and political factors and additionally builds on studies of the “democracy stock.” More importantly, within this special issue, the paper provides for a larger historical and geographic overview of the post-Communist states in terms of their dynamic in CO2 emissions over the decades and within a larger global context. When proceeding to more nuanced analysis of specific international organizations as actors in environmental politics and their implications for post-Communist states,Footnote3 it is important to have a clear picture of the nexus of political regimes and environmental challenges in Eurasia. This paper aspires to provide a wider global and historical context, within which further mapping of specific international organizations and their implications for sustainable development may be better understood. To this end, the paper proceeds as follows. The next section outlines the main theoretical issues in studies of democratization, sustainable development, and post-communism. The third presents data, empirical models, and descriptive statistics. The fourth section depicts the main empirical results and the final section concludes.
Post-Communist Democratization and the Challenge of Carbon Emissions
Debates on the role and effects of political factors for sustainable development have been growing fast since the collapse of communism (Andonova and Sun Citation2019; Bernauer and Koubi Citation2009; Bhattarai and Hammig Citation2001; Buitenzorgy and Mol Citation2011). However, the findings remain contradictory. On the one hand, within non-democratic regions, the ruling elite controls mass media and manipulates public opinion. The latter leads to public ignorance of global environmental concerns and poor environmental performance (if any). As the result of the lack of accountability of non-democracies to national and international publics, they may limit themselves to merely mimicking climate rhetoric (Ambrosio, Hall, and Obydenkova Citation2021; Hall, Lenz, and Obydenkova Citation2021; Ward, Cao, and Mukherjee Citation2014; Poberezhskaya Citation2015; Poberezhskaya Citation2018). Within the context of a bipolar world and Cold War competition for dominance, economic development was a clear priority for the USSR-dominated Communist states (on historical legacies, see Beissinger and Kotkin Citation2014; Beissinger Citation2002; Pop-Eleches and Tucker Citation2017). Therefore, our first hypothesis is the following:
Hypothesis 1: During the period of communism (Cold War) 1970–1990, CO2 emissions per capita were increasing across all post-Communist states converging to the level of consolidated democracies.
In contrast to a malicious image of autocracies as actors harmful for the environment, a number of studies on democratization have pointed out positive implications of transition in terms of promotion of environmental policies, adjusting state-level priorities, and increasing public awareness of the environmental agenda (Andersen Citation2002; Bragina et al. Citation2015; Kolk and van der Weij Citation1998). Indeed, the so-called “fourth wave” of democratization was influenced by international formal institutions and specifically the EU (Morlino Citation2011; Levitsky and Way Citation2010; Obydenkova Citation2012; Mišić and Obydenkova Citation2021). In contrast, some studies have argued that state capacity in autocracies is associated with higher pollution (Ward, Cao, and Mukherjee Citation2014); that autocracies tend to ignore public opinion on environmental conflicts (Demchuk et al. Citation2021); and that cooperation with an autocratic donor may undermine the priority of sustainable development (Obydenkova et al. Citation2021). To sum up, it is only within a climate of political openness, transparency, independent mass media, and governmental accountability to the public, is the collaboration of national and international actors efficient in terms of advancing the goals of sustainable development. All of these aspects of democratization are linked directly to more efficient management of climate policies and increased accountability of the government on these and other related matters. Within post-Communist states, a number of the EU-related leverages were applied to push environmental issues forward on the governmental agenda (e.g., Environmental Action Programme for Central and Eastern Europe; New Environmental Policy Instruments) (Kolk and van der Weij Citation1998; Andonova and Tuta Citation2014; Tews, Busch, and Helge Citation2003). Based on these numerous studies, we formulate our next two hypotheses as follows:
Hypothesis 2: Starting from the regime transition (from 1990s onwards) and along the transition path, the post-Communist states decreased CO2 emission per capita relative to the consolidated democracies.
Hypothesis 3: Post-Communist democratization has directly improved the environment by reducing CO2 emissions per capita (accounting for increased urbanization, population growth, and quality of life) and indirectly via EU membership. EU membership had a separate pathway to a reduction in CO2 emission per capita than democratization.
In general, and at the global level, democracies are indeed associated with political freedoms, civil liberties, freedom of information, pro-environmental civic awareness and pro-environmental legislation, and the rule of law—factors that all together are likely to improve environmental policy and decrease environmental degradation (e.g., Neumayer Citation2002; Ostrom Citation1990; Obydenkova and Salahodjaev Citation2016, Citation2017; Ward et al. Citation2014). The positive effect of democracy and quality of political institutions on a variety of environmental concerns was been shown to hold in the developing world and at the global level in Asia, South America, and Africa (see Aşıcı Citation2013; Bhattarai and Hammig Citation2001; Donohoe Citation2003).
On the other hand, there is some space for potential theoretical contradictions between democratization and specifically CO2 emissions. The modernization theory of democratization links political transition to urbanization, education, improving living standards, accessibility of goods, increase in travel and tourism—that is, higher quality of life. The higher quality of life has multiple indicators, many of which, if not all, relate to urban life style, increase in public transportation, ownership of individual vehicles, more frequent use of air flights and their accessibility, and increase in consumption associated with a market economy and better income, to name a few (e.g., Jiang et al. Citation2016; Saikawa Citation2013). Studies of the modernization theory of democratization, in fact, posit that democratization and modernization (proxied by urbanization, economic growth, and education) are highly interconnected and develop hand-in-hand during political regime transition and marketization (Aixala and Fabro Citation2009; Doucouliagos and Ulubasoglu Citation2008; Papaioannou and Siourouins Citation2008; Przeworski et al. Citation2000; Przeworski and Limongi Citation1993; Rodrik and Wacziarg Citation2005). While these studies debate the nexus of democratization, urbanization, and economic development, they still agree that economic growth and development are strongly associated with democratization and democracy as a political regime.
However, a different set of studies on the main drivers of CO2 emissions, outlined above, clearly indicate that economic factors (economic growth and development) are among the main causes associated with high CO2 emissions. Indeed, urbanization, rising income, and economic growth are among the main drivers of carbon emissions as multiple studies demonstrate (e.g., Khondaker et al. Citation2015; Roth et al. Citation2019; Sanwal and Zheng Citation2018). Moreover, the post-Communist regime transition was accompanied by a deep economic crisis throughout the 1980s and 1990s. It led to the closure of many industries in the region, which may also be associated with the decrease in CO2 emissions. Testing this potential contradiction between democratization and environmental challenges within the context of communism and post-communism over the larger period of analysis of 1970– 2015 aspires to provide better understanding of the nexus of political regimes, transition, and implications for the environment. While the impact of democracy as such has received some attention in the literature on sustainable development, the role of regime transition remains on the agenda.
Within these contradictory debates, one may expect to find a direct relation between the level of democracy and environmental indicators. Following Mikael Skou Andersen (Citation2002), weak democracies cannot impose environmental policies in the early stages of democratization. Nonetheless, as the level of democratization increases, the marginal social benefit of environmental policies increases enforcement of such policies by society. In sum, based on the previous literature, we shall proceed to operationalize and test our hypotheses.
Data and Methods
In this section, we first discuss the primary data sources and descriptive statistics for the key variables used in the analysis. Then, we turn our attention to the measure of democracy and explore the main outcome variable’s trends for the post-Communist states against the consolidated democracies. Finally, we elaborate on the empirical modeling based on the patterns observed in the initial descriptive analysis.
provides information on the key dependent and independent variables used in the analysis and the data sources. Our sample consists of 153 countries that we follow for 46 years—20 years before the start of the transition, from 1970, and 26 years after, up to 2015. We compile our sample using a rich set of sources: the main outcome variable, CO2 emission per capita, is from the World Bank Indicators; the independent variables are from various sources: Polity IV Project, World Religion Project, GeoDist Database, Barro-Lee Educational Attainment Dataset, and Ethnic Factorization Data (see ). Descriptive statistics for the key variables can be found in Appendix 1.
Table 1. Datasets Used in the Analysis of Quality of Life
Democracy Measure
In this study we employ a measure of democracy widely utilized in the literature, the Polity 2 index. The measure is made available by the Center for Systematic Peace as part of the Polity IV project, which codes all countries’ democratic characteristics on a longitudinal basis. The cumulative index measures competitive and open executive recruitment, the existence of institutionalized constraints on chief executives, the guarantees of civil liberties, and the political participation of citizens. The index is computed by differencing the institutionalized autocracy score, At, from the institutionalized democracy score, Dt:
Both institutionalized scores are constructed in additive eleven-point scales (0–10). Thus, the Polity 2 index ranges from −10 (hereditary monarchy) to +10 (consolidated democracy). The final score for any particular country represents three political regimes: “autocracies” with the score ranging from −10 to −6, “anocracies” with the score ranging from −5 to +5, and “democracies” with the score ranging from +6 to +10. For example, in 2007, Russia had an institutionalized democracy score of 6, and an institutionalized autocracy score of 1 bringing Russia’s overall democracy index to five, which categorized Russia’s political regime as “anocracy.”
There are five essential elements of the Polity 2 index. The first element measures the competitiveness of executive recruitment, which reveals how the existing modes of advancement create equal opportunities for an ordinary citizen to advance to a super-ordinate position. The second element assesses the country’s openness to executive recruitment. If the executive recruitment is “open,” then any politically active citizen has an opportunity to clinch the chief executive position through the lawfully determined process. The third element measures the extent to which executive constraints limit the decision-making power of the state’s chief executive. This element assesses the existence of any checks and balances embedded in the various parts of the chief executive’s decision-making. The fourth element is the competitiveness of participation, which measures evidence of the embedding of alternative policy preferences and leadership in the political system. The final element assesses the extent of regulation of citizens’ political activities.
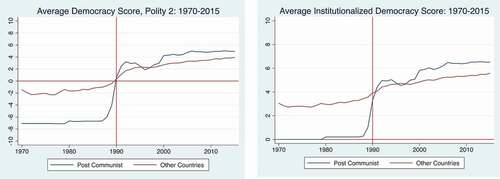
We first analyze the institutionalized democratic score changes over time for the post-Communist and the counterpart countries in . The average institutionalized democracy score patterns are similar to the patterns observed for the average democracy index. The counterpart, non–post-Communist states scored higher in terms of democratization in the earlier years before the transition. The gap converged at the time of transition, and then the gap narrowed by 2000. After 2000, the gap is stable with an increasing democracy score for both types of countries.
Figure 1. Average democracy index and institutionalized democracy score, polity 2, in post-communist states against the rest of the world.
The above comparisons miss the vast heterogeneity in the democracy index and institutionalized democracy score across the non–post-Communist states. It should be evident that European or North American states have paths to democracy that diverge from those for Sub-Saharan or Middle Eastern regions. To account for this heterogeneity, in we break down the non–post-Communist countries into seven regions: East Asia (EA), Europe (EU), Latin America & Caribbean (LA), Middle East & North Africa (MENA), North America (NA), South Asia (SA), and Sub-Saharan Africa (SSA). In the 1970s, the Communist states were considered among the least democratic societies, ranked last among eight types of countries. At the time of transition, in 1990, the post-Communist states’ position improved substantially. They were ranked sixth, surpassing the countries representing Sub-Saharan Africa and the Middle East & North African regions. Along the transition path, the post-Communist countries surpassed the countries representing the the East and South Asian regions, lagging behind only Latin American, European, and North American democracies. The same patterns, we can observe for the alternative measure: average institutionalized democracy score.
Figure 2. Polity 2 democracy index and institutionalize democracy score by region: 1970–2015 (East Asia (EA), Europe (EU), Latin America & Caribbean (LA), Middle East & North Africa (MENA), North America (NA), South Asia (SA), and sub-Saharan Africa (SSA).
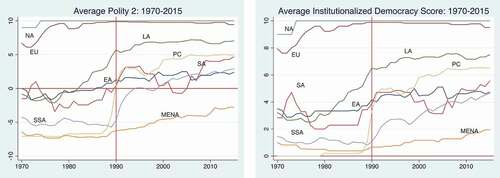
suggests that the political liberalization processes that the post-Communist states experienced in the early 1990s had implications for other regions. First, for the countries of the Sub-Saharan and East Asian regions, we observe significant improvements in the democratization index and score. The USSR had a substantial influence on most countries’ political regimes, and the loosened grip in the 1990s created a jump-start for democratization in these regions. Latin American countries had also experienced substantial improvements in democracy, but the liberalization processes in the Latin American region started much earlier than in the countries of the Warsaw Bloc. Finally, the Middle Eastern and North African countries, regions where the USSR had substantial military and economic influence in the pre-transition period, experienced only slight improvements in the average democratization score or index after 1990. And as seen in the figure, the USSR’s dissolution had almost no impact on political rights and civil liberties in this region. Finally, this visual analysis identifies the list of countries we include in the control group in the difference-in-differences analysis. North American and European countries can be viewed as countries with consolidated democracies and further considered in our study as control group countries (Appendix 1A).
Democracy in Post-Communist States
Previous analyses of the institutionalized democracy score do not consider the significant variation in this score across the post-Communist states in the period of transition. In the 1980s, only the former republics of Yugoslavia had a democracy score different from zero. In the electoral processes of these states, certain democratic institutions were present before the USSR’s dissolution. Specifically, the chief executives faced some constraints on their executive powers. These states had between “slight to moderate limitations” and “substantial limitations” on the executive authority’s power. In 1990, the project’s experts downgraded the democratic score in these states to 0 because of persistent ethnic turmoil following the first years of political liberalization at the time of transition. The institutionalized democracy score significantly increased in other post-Communist states. For example, Hungary immediately reached the highest possible rating of 10 points; the Czech and Slovak republics representing a single country at that time, Czechoslovakia reached the rating of 8 points; and all the republics of USSR had the rating of 3 points. The average score was 3.3 points for the average post-Communist state, equivalent to the democratic environment in the Bloc’s largest country, the USSR. The variability in the institutionalized democracy score was 1.9 points, which is the difference between the upper and lower bounds of the 95 percent confidence interval.
Along the transition path, some countries stayed autocratic with an absence of any democratic processes (Uzbekistan, Turkmenistan), and some countries advanced immediately to the rank of consolidated democracies (Hungary). Therefore, it is important to distinguish between “political regime transition” and “democratization” (terms often used interchangeably in studies during the 1990s and early 2000s). Indeed, in some cases, the transition that took place resulted in consolidation of autocracy or a so-called hybrid regime (Levitsky and Way Citation2010). The variability in the democracy score was stable throughout the transition path, 2.6–3.0 points, while the average value increased from 3.3 points in 1990 to 6.5 points in 2015. The snapshot of the democracy stock in 2010 (Appendix 2A) shows that at least six countries had no signs of democratic institutions being embedded into their political regimes; these countries continued to be “autocracies”: Azerbaijan, Belarus, Bosnia, Kazakhstan, Turkmenistan, Uzbekistan.Footnote4 The same number of countries reached the rank of consolidated democracies: Hungary, Lithuania, Mongolia, Poland, Slovak Republic, and Slovenia. The average democracy score was 6.4 units, somewhere between the scores enjoyed by Ukraine and Georgia. The 95 percent confidence interval of the democracy score lay between 5 and 8, the scores experienced by Armenia and Latvia, respectively.
Democracy Stock
Several studies in the literature explore the impact of democratization on various political and economic outcomes using the stock of democracy (Wigley and Akkoyunlu-Wigley Citation2011; Besley and Kudamatsu Citation2006; Nazarov and Obydenkova Citation2020, Citation2021). This measure’s main advantage is that it explores the long-run impact of democratization, since democratic processes may not change society’s behavior and outcomes immediately. The previous analysis confirms the substantial variation in the democracy score across the post-Communist states after 1990. We construct the democracy stock starting from this year to the final year of the study period, 2015.
Our approach in the construction of democracy stock is somewhat different from the previously suggested measures in the literature. Instead of using the whole Polity 2 democracy index, we use the institutionalized democracy score of this index. Our previous longitudinal analysis shows that the Polity 2 index and institutionalized democracy score are highly correlated series, and since our main interest is to understand the impact of democratization on the various outcomes of the post-Communist countries, our analysis should be more accurate with the use of the democracy score instead of the whole index.
Previous studies document that even after three decades of political regime transition, Communist historical legacies have survived in a number of regions and substantial variation in the political regimes remains across the post-Communist countries (Beissinger and Kotkin Citation2014; Gel’man Citation2013, Citation2015, Citation2016; Giuliano Citation2006; Libman and Obydenkova Citation2019, Citation2020; Pop-Eleches and Tucker Citation2017). As of 2015, after consistent influence of the EU, Hungary, Lithuania, Slovenia, the Czech Republic, Poland, and the Slovak Republic turned into newly established consolidated democracies, with the maximum or near-maximum democracy stocks of 250 points accumulated during the study period (notwithstanding the recent wave of populism). In contrast, a few states “outside the EU’s reach”—Turkmenistan, Bosnia, and Uzbekistan—have accumulated zero stock during the same period. Other post-Soviet states exhibit a combination of a number of external autocracy-consolidation factors and/or the impact of natural resources, that prevented them from consolidating democratic institutions. For example, Kazakhstan, Azerbaijan, Tajikistan, and Belarus have some decorative and rhetorical democratic institutions embedded into their political systems, but they lag substantially behind the first group of post-Communist countries. The goal is to look at the consequences of transition for carbon emissions and to advance the understanding of the implications of fluctuation in democracy for the environment (CO2).
Descriptive Statistics
The average CO2 emission per capita in the study period for the average country is 4.6 tons; for the average post-Communist country it is 6.47 tons, and for the average consolidated democracy it is 9.58 tons. A further comparison of the outcome variable over time between Communist countries and consolidated democracies is presented in (Appendix 2 provides the list of countries comprising consolidated democracies).
Figure 3. CO2 emission per capita in post-communist and consolidated democracy.
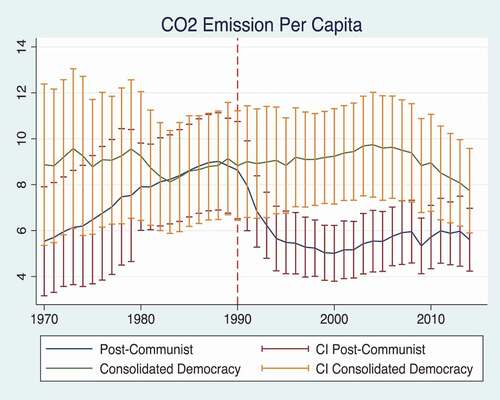
demonstrates that the carbon emission in the consolidated democracies has been dissimilar to the post-Communist states during the last five decades. In 1970, CO2 emission per capita in the consolidated democracies was 3.3 tons higher. Because of the process of ecological degradation that the post-Communist states experienced in the pre-transition period, the two series converged before the start of transition at the level of 8.8 tons per capita. In the next decade, per capita CO2 in the consolidated democracies increased to 9.7 tons while it decreased in the post-Communist countries, leading to the most massive gap between two types of countries: 4.3 tons. In the final period of transition, the consolidated democracies experienced a 23 percent decline in CO2 emission per capita, or a 2.3 percent decline on an annual basis, reaching a low of 7.7 tons per capita in 2014. For the same period, the post-Communist states experienced an increase in per capita carbon gas emissions. Thus, if these trends continue, a new convergence of CO2 emission per capita should be anticipated between the two types of countries in the immediate future.
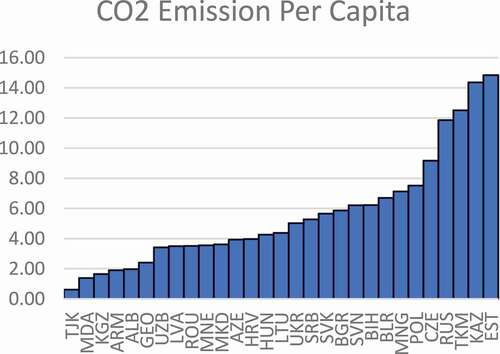
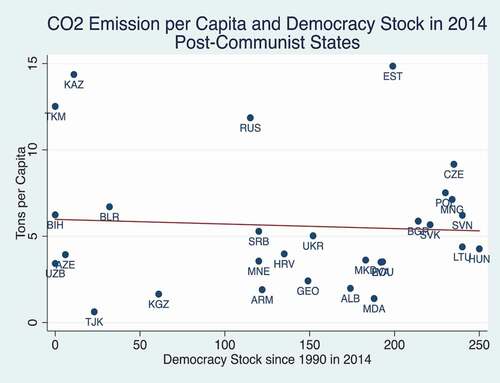
The previous descriptive analysis doesn’t reveal the differences in CO2 emissions across the post-Communist states. In , we depict these differences; it shows that as of 2014, the highest level of CO2 emissions in the post-Communist states was in Estonia. The level of carbon emission per capita in this country was 14.9 tons. The lowest level was in Tajikistan, with the level of CO2 emission per capita close to 0.6 tons. Thus, Estonia had a 25 times higher level of air pollution than Tajikistan. The average level of carbon emission per capita across all post-Communist countries was 5.6 tons, which is close to the level experienced by the Slovak Republic.
Figure 4. Rankings of CO2 emission per capita among the post-communist states in 2014.
Empirical Models
Based on the varying differences in CO2 emission per capita depicted in , we conduct a difference-in-differences analysis. This analysis enables us to investigate whether the post-Communist countries experienced different trends in CO2 emission before and during the period of transition relative to the consolidated states, after controlling for a rich set of socio-economic, institutional, and geographic factors. This analysis sets the path to test our first two hypotheses.
We run the difference-in-differences analysis by estimating the following regression equation:
In the above model, measures the differences in the CO2 emissions per capita,
, in the post-Communist states relative to the consolidated democracies in five-year time intervals. θ1 measures the difference in the five-year period prior to the start of transition, 1990; while θ2−θ6 measures the differences in the subsequent five periods of transition and what the size of these parameters suggests about differing trends in CO2 emissions in the post-Communist states relative to consolidated democracies. In the model, vector Xit controls for socio-economic differences across the states; it includes GDP per capita, its squared term, average years of education, and the population’s urbanization and growth rates. Vector Ii includes the institutional differences represented by the percentage of Catholics, an indicator of a Christian majority, and the ethnic factorization index. Vector Gi includes geographic controls, such as whether the country is landlocked and the distance to the equator and Greenwich, and land area in square kilometers. μ and τ are the post-Communist and year fixed effects.
suggests that the difference-in-differences analysis would only shed light on the indirect relationship between democracy and environment. The post-Communist countries have experienced dissimilar paths to democracy. Thus, an analysis that reveals heterogeneity in democratization is warranted to learn whether democracy itself is associated with CO2 emissions in the post-Communist countries.
Figure 5. CO2 emission per capita and democracy in post-communist states in 2014.
Taking this literature into consideration, we estimate the following regression model to test the third hypothesis.
In this model, DSit is the democracy stock for country i in year t and τ is the year fixed effects. The primary interest is the parameter γ1. If its value is less than zero this is an evidence that democracy reduces CO2 emission. We perform two different robustness analyses in our study. First, we estimate EquationEquation (4)(4)
(4) with the additional control, EU membership and parameter γ2 associated with it. In light of Hypothesis 3, this analysis enables us to quantify the mediating impact of EU membership on the democracy/environment gradient. Second, we estimate the model with the country-fixed effects, instead of vectors of institutional, Ii and geographic, Gi controls, to account for unobserved country-level heterogeneity not included in the given vectors.Footnote5 As shown in , the relationship between democracy stock and CO2 emissions per capita for the post-Communist republics is barely negative. The autocratic states with zero accumulated democratic stock after 25 years of transition are on both ends of the spectrum. For example, autocratic Turkmenistan and Kazakhstan, in 2014, had the highest levels of carbon emissions among the transition economies, 12.5 and 14.4 tons respectively, while Uzbekistan and Azerbaijan are among the medium polluted countries with per capita emission of 3.42 and 3.92 tons, respectively.
The least polluted countries are Tajikistan and Moldova, 0.62 and 1.39 tons per capita. Despite their dissimilar levels of democratic development as of 2014, they exhibit significant differences in terms of democracy stock. That is, Tajikistan has democratic stock of only 11. In contrast, Moldova can be viewed more as a newly established democracy with a stock of 188 (the maximum possible value in 25 years of transition is 250).
Variations in the democratic stock cannot singly explain the differences in per capita CO2 emission across the post-Communist states. The impact of democracy on CO2 emissions may be confounded by various socio-economic, institutional, and geographic factors similar to EquationEquation (3)(3)
(3) . These factors may simultaneously influence the level of carbon emissions in the country on the one hand and its democratic stock after 25 years of transition, on the other hand.
The endogeneity problem due to the failure to control for all unobserved differences across post-Communist countries is a primary concern for drawing any definitive conclusions, especially based on the second analysis. The extensive controls would not allow one to account for all the possible differences that affect simultaneously CO2 emissions and processes of democratization. Thus, γ can be biased because of the presence of unobserved country-level factors. To address this endogeneity concern, in the model we also control for both time (μ) and country (π) fixed effects, omitting institutional and geographic factors from the model. The impacts of the latter factors on CO2 emission should be captured by the country fixed effects. Most importantly, the impacts of any unaccounted factors by institutional and geographic factors would be captured by country-level fixed effects, bringing the estimate of γ closer to its true value.
Results
Difference-in-Differences Analysis
In , we depict the parameters from the difference-in-differences regression. First, in the pre-transition phase, 1985–1989, the average post-Communist state relative to the similar democratic state had a 1.53-ton higher CO2 emission per capita. This finding supports our first hypothesis. At the time of transition, 1990–1994, the difference decreased to 0.35 tons of CO2 with the higher emission per capita in the post-Communist states. We can further observe the reversal of the gap between the two types of states. In 2000–2004, the gap reaches a 1.75-ton per capita emission, which is less for the post-Communist states. In 2010–2014, the gap declined slightly, to 0.97 tons. The combination of these findings supports our second hypothesis.
Figure 6. Differences in CO2 emission between post-communist countries and consolidated democracies at transition and along the transition path (difference-in-differences approach).
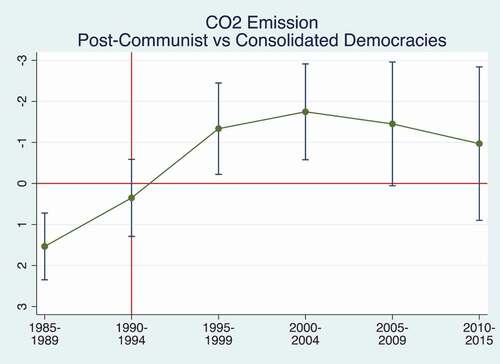
The main implication from this analysis is that the post-Communist states experienced a higher level of ecological degradation before the transition. Democratic processes may have catalyzed the adoption of more environment-friendly policies during the period of transition. An alternative explanation could be that liberalization processes significantly affected the production of goods and services, inadvertently reducing CO2 emissions to the atmosphere. In the final period, we observe a slight increase in CO2 emissions in the post-Communist states relative to the counterpart states, probably, because of intensified economic growth experienced by many post-Communist states in the later period of transition; but still, the post-Communist states pollute less per capita than the consolidated democracies.
Democracy Stock Analysis
Main Results
In the preceding analysis, we provide evidence that the post-Communist states have experienced improvement in the environmental outcome relative to the consolidated democracies. The CO2 emissions per capita dropped substantially along the transition path, even though the post-Communist states had higher rates in the pre-transition period.
To account for a potential economic explanation of changes in CO2, in , in the first model, we control only for the year fixed effects and find that the relationship between the two variables is slightly positive. However, after adding the urbanization rate, population growth, income, and another proxy from the modernization theory of democratization—the education variables—the relationship switched to the negative sign. After adding environmental and geographic factors, the relationship decreased in magnitude but preserved its statistical significance at the 5 percent level. In Model 4, our findings indicate that a unit increase in democracy stock reduces CO2 emissions by 0.016 tons per citizen; or, one standard deviation increase in democracy stock (σ = 86) decreases the emission by 1.4 tons per citizen This gradient’s elasticity is 0.19 percent; thus, a one percent increase in democracy stock leads to a 0.19 percent decrease in carbon emissions. Suppose Turkmenistan, with zero democracy stock, has CO2 emissions per capita of 12.5 and turns into a fully democratic society, like Hungary, with a democracy stock of 250. In that case, the CO2 emissions per capita in Turkmenistan should drop to 8.5 tons, the level experienced by Poland and the Czech Republic. Thus, based on this series of regression models, we can conclude that democratization processes are associated with a decrease in carbon emissions in the post-Communist states. In contrast, from the historical perspective, before the start of transition, these countries were steadily heading toward environmental degradation in the period of 1970–1990; that trend was reversed by economic and political liberalization processes.
Table 2. Regression Results with Democracy Stock (Dependent Variable: CO2 Emissions Per Capita (Post-Communist States – 1990–2015))
One of our interests lies in quantifying the association of urbanization and population growth with carbon emissions. In all three models, Model 2–Model 4, we can observe strong and positive associations. In Model 4, the most preferable specification, a one percentage point increase in the urbanization rate increases the CO2 emission per capita by 0.13 tons and a one percentage point increase in population growth increases the emission of CO2 gases by 0.65 tons. Both results confirm the earlier conceptualization that higher rates of urbanization and population growth have detrimental impacts on the environment.
Our analysis of transition economies also confirms the existence of the environmental Kuznets curve, a concept widely discussed in the recent environmental literature. The inverted Kuznets curve theory argues that economic development increases environmental degradation up to a certain point, after which economic development improves environmental indicators (e.g., Yasin, Ahmad, and Chaudhary Citation2020). Based on Model 4, an increase in per capita income increases carbon emissions per capita until the per capita income reaches $22,000 per capita. Similar to the Kuznets approach, we find that a further increase in income reduces air pollution, thus decreasing environmental degradation with an increased living standard.
Only one country, Slovenia is on the other end of the Kuznets curve, with a negative relationship between income and CO2 emissions; the Czech Republic and Estonia have almost approached the flat part of the curve, while the rest of the post-Communist countries are in the rising part of the Kuznets curve. These countries would experience an increase in CO2 emissions per capita with an improved living standard. In fact, this historical perspective explains why some of the post-Communist new EU member-states challenged the EU’s Green Pact and the EU’s suggestions for a “Green exit from the pandemic.” Among the states arguing for not prioritizing the goals of sustainable development over short-run economic benefits were the Czech Republic and Poland.
Following the literature on historical legacies, we account for whether the state has a Christian majority (Pop-Eleches and Tucker Citation2017; Beissinger and Kotkin Citation2014; Beissinger Citation2002). Religion, as a proxy for historical legacy, seems to be another contributing factor related to environmental indicators. Even after controlling for economic and other factors, a Christian majority is associated with significantly lower levels of CO2. That is, a country with a Christian majority compared with a counterpart country has 1.8 ton less of carbon emission per capita, ceteris paribus. Suppose we compare Poland, a country with an 88 percent Catholic population, and thus a Christian majority, and Turkmenistan, a counterpart with no Catholic population. The difference in CO2 emissions per capita between the two countries is 5 tons per capita, and this institutional factor can explain about 1.8 tons, ceteris paribus.
The state’s size in terms of land area measured in square kilometers has a positive implication for environmental degradation. The larger states like Russia or Kazakhstan are associated with higher CO2 per capita, 11.85 and 14.36 per capita, respectively. Holding all else constant, any additional 1 m. square kilometers is associated with an additional 0.2 tons of CO2 emissions per capita.
Finally, despite the absence of statistical significance, the substantial economic significance makes the relationship between ethnic fracture and CO2 emission worth discussing. The results show that a country with no ethnic heterogeneity in the population will experience 1.4 tons more of carbon emissions per capita than a country with a 100 percent chance of two randomly drawn citizens being representatives of two different ethnic groups.
Robustness Check: EU Membership and Environment
EU membership may partially explain the results of the preceding analysis. The existing EU norms require more comprehensive ecological policies. Thus, the negative association between democracy stock and CO emissions can be partially explained by the positive association of EU membership with democratization (Appendix Table 4 demonstrates that the two are strongly correlated with r-0.7) and negative association of EU membership with CO2 emissions. While the democracy stock is at the center of our attention, it is still important to distill the potential impact of EU membership on combatting climate change and its mitigating impact on the relationship of interest. In , we report the results for the regression analysis where the main independent variable along with the democracy stock is the country’s EU membership status in the given year. The Eastern European states in our sample became EU members in different periods (see Table 5). Out of 29 states in our sample, by the end of the study period, only 11 states were EU members. Eight countries became members as early as in 2003. Romania and Bulgaria were invited in 2006, and Croatia entered the EU in 2012. The heterogeneity in the time of entry along with the presence of countries that have never entered the EU allows us to identify the effect of EU membership on our environmental indicator. First, regardless of the model specification, in Model 2 to Model 4, we observe a negative association between EU membership and CO2 emissions per capita. Model 4’s results indicate that EU membership may have reduced CO2 emission per capita by 1.282 tons, which is equivalent to the effect of 106 units of the democracy stock, or the democracy stock accumulated by Serbia and Montenegro by 2014. The democracy stock coefficient is lower with the EU membership control by 0.004 (−0.016 in vs. −0.012 in ), which is a 25 percent reduction in bias. This analysis confirms that even after controlling for EU membership, we end up with evidence that democratization may have directly improved the environment, albeit to a lesser extent.
Table 3. Regressions with EU Membership and Democracy Stock (Dependent Variable: CO2 Emissions Per Capita (Post-Communist States – 1990–2015))b
Our finding goes along with previous studies, pointing out the importance of membership in the EU and a number of factors associated with it, such as, for example, transnational environmental networks and the importance of compliance with EU environmental norms, and the EU impact on the environmental agenda of post-Communist new member-states (e.g., Andonova and Tuta Citation2014).
Robustness Check: Endogeneity
The main drawback of Model 4’s results reported in is the endogeneity concern. Despite the extensive set of controls, the estimates may still be confounded by various factors not accounted for by the model. One quick solution to check the robustness of the received results for the significance of unobserved country-level factors is to account for the country-level fixed effects instead of country-level geographic and institutional controls. The results of the extended model are reported in the columns referred to as Model 5 in .
First, our previous analysis demonstrates that the estimates for the parameter associated with the democracy stock are more unbiased if we control for EU membership. As a result, Model 5 reported in is our preferred specification. Based on the R2 statistic, this model fits the actual data much better than the previous model, 0.939 versus 0.672. However, the most important result is that the coefficient associated with the democracy stock has changed in magnitude. It has dropped from 0.012 to 0.010 with similar standard errors. The statistical significance at the 10 percent level for the one-tailed t-test isn’t preserved at the margin. Although the coefficient associated with EU membership has also dropped in magnitude from −1.282 to −0.972, a 25 percent reduction in bias, the estimate is still statistically significant at the 5 percent level (one-tailed t-test). This analysis demonstrates that, although democracy may have directly improved air quality, the greater implication for environmental improvements in the transition period is related to EU membership.
Conclusion
How did political regime transition affect the carbon emissions of 35 post-Communist states as compared to the rest of the world over the twentieth-to-twenty-first centuries? The paper covers 46 years, almost half a century, of changes in political regime, urbanization, and CO2 across the world, focusing on the phenomenon of post-Communist states. Our findings indicate that an increase in democracy stock reduces CO2 emissions by 0.010 tons per citizen, or a one standard deviation increase in democracy stock decreases emissions by 0.86 tons per citizen, controlling for changes in income and other variables. Even if this estimate is marginally statistically insignificant at the 10 percent level, we cannot rule out the fact that democracy has a direct impact on CO2 emission. The insufficient sample size for the non-EU members wouldn’t allow us to test confidently this effect independent of the EU. Thus, based on this series of regression models, we can conclude that the democratization process has been associated with a decrease in carbon emissions in the post-communist states (despite a simultaneous increase in urbanization and EU membership). However, the EU membership played a greater role in environmental improvements. This holds even after accounting for an increase in urbanization during the transition period. Democratization has been found to be positively associated with the urbanization rate, and a one standard deviation increase in the democracy stock increases the urbanization rate by 4.4 percent.
The paper also offers an important historical perspective analysis. The analysis demonstrates that from the 1970s onwards, before the start of the transition, the former Communist countries had steadily increasing CO2 emissions in the period 1970–1989. This trend was reversed by economic and political liberalization processes. While the literature on the consequences of communism keeps on growing, this study is among the first to uncover the environmental degradation associated with communism as a political, economic, and ideological system.
The analysis also sheds more light on the relationship between economic development and environmental degradation, known as the environmental Kuznets curve. In accordance with the Kuznets curve approach, we find that after an increase of income reaches a turning point, it reduces CO2 emissions, thus decreasing environmental degradation and increasing the living standard further. Among other findings, historical legacies (religion) demonstrated significant negative impact on CO2 during the period of the study. For example, after controlling for economic and other factors, Catholic population is associated with a significantly lower level of CO2. This finding should have important implications for the literature on historical legacies and the impact of culture on environment.
The project also has a few relevant secondary findings (some of which are analyzed in detail in other contributions of this special issue). For example, in line with other essays in this issue on democracies-led versus autocracies-driven international organizations, we find that membership in the European Union is strongly associated with a decrease in CO2 emissions in post-Communist states. In this paper, our main focus remains on the nexus of democracy and carbon emissions across post-Communist states; but it is important to consider a somewhat more general trend of the effects of EU membership on the environment across post-Communist states. It is a somewhat remarkable finding that EU membership seems to have been a more powerful trigger in decreasing carbon emissions as compared to democracy alone (confirming the studies in this special issue on the role of integration into environmental transnational networks, environmental conditionality of loans, and diffusion of environmental values through membership).
Also, along with the existing literature on the importance of geographic location for sustainable development, we find that landlocked countries experience a higher rate of CO2 emissions per capita than the counterpart countries, ceteris paribus. On average, the former countries experience 2.82 tons more carbon emissions per capita, holding all other variables constant. Central Asian countries’ remote location may make the adoption of environmentally conscious production methods cost-effective. Moreover, the landlocked states are more dependent on their neighboring states across a number of issues and for connectedness with the outside world. They are thus also more susceptible to the influence of, for example, neighboring China, whose policy has been criticized for lack of sensitivity toward the goals and principles of sustainable development (e.g., Ambrosio, Hall, and Obydenkova Citation2021; Hall, Lenz, and Obydenkova Citation2021; Obydenkova et al. Citation2021). To sum up, the paper has placed post-Communist states within a global context and traced their development for almost half a century in terms of the nexus of democracy stock and changes in carbon emissions. Our analysis of the nexus of regime transition and CO2 across post-Communist states historically and globally contributes to a better understanding of the role and effects of international organizations and the sustainable development challenges of post-Communist states.
Supplemental Material
Download Zip (426.3 KB)Acknowledgments
Anastassia Obydenkova thanks the Basic Research Program of the National Research University Higher School of Economics (HSE University) for supporting her research. She is grateful to the Center for the Institutional Studies of the National Research University Higher School of Economics and to the Institute for Economic Analysis of the Spanish Council for Scientific Research (IAE-CSIC) for hosting her as a research fellow and affiliate. The findings of this paper were presented at Columbia University in New York (2017), Universidad Autonoma de Barcelona (2017), and New York University (2018). We thank the participants of these events for their insightful comments and suggestions. We are especially grateful to Joshua Tucker, Ada Ferrer-i-Carbonell, and Elise Giuliano for their great feedback on this project. The authors thank two anonymous reviewers of this paper for their excellent comments and insights. The authors of this paper are listed alphabetically and they contributed equally to this project.
Disclosure Statement
No potential conflict of interest was reported by the author(s).
Supplementary Material
Supplemental data for this article can be accessed on the publisher’s website at https://doi.org/10.1080/10758216.2021.1995437.
Notes
1. The authors of this paper are listed alphabetically and they contributed equally to this project.
2. While the literature on historical legacies of communism has been growing in the last decade, the impact of communism on the environmental agenda has not yet been addressed as the focus. On historical legacies, see (Beissinger and Kotkin Citation2014; Lankina, Libman, and Obydenkova Citation2016b; Pop-Eleches and Tucker Citation2017).
3. On democracies-driven international organizations and their implications, see Morlino (Citation2011), Lankina, Libman, and Obydenkova (Citation2016a), Lavelle (Citation2011, Citation2007, Citation2003), Pillarisetti (Citation2005), Arpino and Obydenkova (Citation2020), Obydenkova and Arpino (Citation2018), Obydenkova and Rodrigues Vieira (Citation2020); on autocracies-driven international organizations, see Debre and Dijkstra (Citation2020), Debre (Citation2020a, Citation2020b), Libman and Obydenkova (Citation2013), Libman and Obydenkova (Citation2018a, Citation2018b, Citation2021). Other studies also detail the rhetoric of climate change policies developed by non-democracies (e.g., Poberezhskaya Citation2014, Citation2018).
4. Within the focus of this special issue, it is important to point to the potential role of membership of post-Soviet states in non-democratic regional international organizations such as the Shanghai Cooperation Organization (see Ambrosio Citation2008, Citation2012, Izotov and Obydenkova Citation2021). Analysis of the impact of such membership on sustainable development is beyond this paper. It should, however, remain on the agenda for future studies.
5. In the Appendix, we have more detailed discussions of empirical strategies used to test the study’s hypotheses. On the format of the presentation of equations, also see Angrist and Pischke (Citation2009).
References
- Aixala, J., and G. Fabro. 2009. “Economic Freedom, Civil Liberties, Political Rights and Growth: A Causality Analysis.” Spanish Economic Review 11 (3): 165–78. doi:10.1007/s10108-008-9050-x.
- Ambrosio, T. 2008. “‘Catching the ‘Shanghai Spirit’: How the Shanghai Cooperation Organization Promotes Authoritarian Norms in Central Asia.” Europe-Asia Studies 60 (8): 1321–44. doi:10.1080/09668130802292143.
- Ambrosio, T. 2012. “The Rise of the ‘China Model’ and ‘Beijing Consensus’: Evidence of Authoritarian Diffusion?” Contemporary Politics 18 (4): 381–99. doi:10.1080/13569775.2012.728029.
- Ambrosio, T., A. Hall, and A. Obydenkova. 2021. “Sustainable Development Agendas of Regional International Organizations: The European Bank of Reconstruction and Development and the Eurasian Development Bank.” Problems of Post-Communism. doi:10.1080/10758216.2021.1979412.
- Andersen, M.S. 2002. “Ecological Modernization or Subversion? The Effect of Europeanization on Eastern Europe.” American Behavioral Scientist 45 (9): 1394–416. doi:10.1177/0002764202045009006.
- Andonova, Liliana B., and Yixian Sun. 2019. “Private Governance in Developing Countries: Drivers of Voluntary Carbon Offset Programs.” Global Environmental Politics 19 (1): 99–122. doi:10.1162/glep_a_00496.
- Andonova, Liliana B., and Ioana Tuta. 2014. “Transnational Networks and Paths to EU Environmental Compliance: Evidence from New Member States.” JCMS: Journal of Common Market Studies 52 (4): 775–93. doi:10.1111/jcms.12126.
- Angrist, Joshua D., and Jörn-Steffen Pischke. 2009. Mostly Harmless Econometrics: An Empiricist’s Companion. Princeton and Oxford: Princeton University Press.
- Arpino, B., and A. V. Obydenkova. 2020. “Democracy and Political Trust before and after the Great Recession 2008: The European Union and the United Nations.” Social Indicators Research 148 (2): 395–415. doi:10.1007/s11205-019-02204-x.
- Aşıcı, A. A. 2013. “Economic Growth and Its Impact on Environment: A Panel Data Analysis.” Ecological Indicators 24:324–33. doi: 10.1016/j.ecolind.2012.06.019.
- Beissinger, M., and S Kotkin, eds. 2014. Historical Legacies of Communism in Russia and Eastern Europe. Cambridge and New York: Cambridge University Press.
- Beissinger, M. R. 2002. Nationalist Mobilization and the Collapse of the Soviet State. Cambridge and New York: Cambridge University Press.
- Bernauer, T., and V. Koubi. 2009. “Effects of Political Institutions on Air Quality.” Ecological Economics 68 (5): 1355–65. doi:10.1016/j.ecolecon.2008.09.003.
- Besley, T., and M. Kudamastu. 2006. “Health and Democracy.” American Economic Review 96 (2): 313–8.
- Bhattarai, M., and M. Hammig. 2001. “Institutions and the Environmental Kuznets Curve for Deforestation: A Crosscountry Analysis for Latin America, Africa and Asia.” World Development 29 (6): 995–1010. doi:10.1016/S0305-750X(01)00019-5.
- Bragina, E., V. C. Radeloff, M. Baumann, K. Wendland, T. Kuemmerle, and A. M. Pidgeon. 2015. “Effectiveness of Protected Areas in the Western Caucasus before and after the Transition to Post-Socialism.” Biological Conservation 184:456–64. doi:10.1016/j.biocon.2015.02.013.
- Buitenzorgy, M., and A. P. Mol. 2011. “Does Democracy Lead to a Better Environment? Deforestation and the Democratic Transition Peak.” Environmental and Resource Economics 48 (1): 59–70. doi:10.1007/s10640-010-9397-y.
- Debre, M.J., and H. Dijkstra. 2020. “Institutional Design for a Post-liberal Order: Why Some International Organizations Live Longer than Others”. European Journal of International Relations (October). doi:10.1177/1354066120962183.
- Debre, Maria J. 2020a. “The Dark Side of Regionalism: How Regional Organizations Help Authoritarian Regimes to Boost Survival.” Democratization. doi:10.1080/13510347.2020.1823970.
- Debre, Maria J. 2020b. “Legitimation, Regime Survival, and Shifting Alliances in the Arab Spring: Explaining Sanction Politics during the Arab Spring.” International Political Science Review doi:10.1177/2F0192512120937749.
- Demchuk, A. L., M. Mišić, A. Obydenkova, and J. Tosun. 2021. “Environmental Conflict Management: A Comparative Cross-Cultural Perspective of China and Russia.” Post-Communist Economies 1–23. doi:10.1080/14631377.2021.1943915.
- Donohoe, M. 2003. “Causes and Health Consequences of Environmental Degradation and Social Injustice.” Social Science & Medicine 56 (3): 573–87. doi:10.1016/S0277-9536(02)00055-2.
- Doucouliagos, C., and M. Ulubasoglu. 2008. “Democracy and Economic Growth: A Meta-Analysis.” American Journal of Political Science 52 (1): 61–83. doi:10.1111/j.1540-5907.2007.00299.x.
- Fredriksson, P. G., and E. Neumayer. 2013. “Democracy and Climate Change Policies: Is History Important?” Ecological Economics 95:11–19. doi: 10.1016/j.ecolecon.2013.08.002.
- Fredriksson, P. G., and J. R. Wollscheid. 2007. “Democratic Institutions versus Autocratic Regimes: The Case of Environmental Policy.” Public Choice 130 (3–4): 381–93. doi:10.1007/s11127-006-9093-1.
- Gel’man, V. 2013. “Cracks in the Wall: Challenges to Electoral Authoritarianism in Russia.” Problems of Post-Communism 60 (2): 3–10. doi:10.2753/PPC1075-8216600201.
- Gel’man, V. 2015. Authoritarian Russia: Analyzing Post-Soviet Regime Changes. Pittsburgh: University of Pittsburgh Press.
- Gel’man, V. 2016. “The Vicious Circle of Post-Soviet Neopatrimonialism in Russia.” Post-Soviet Affairs 32 (5): 455–73. doi:10.1080/1060586X.2015.1071014.
- Giuliano, E. 2006. “Secessionism from the Bottom Up: Democratization, Nationalism, and Local Accountability in the Russian Transition.” World Politics 58 (2): 276–310. doi:10.1353/wp.2006.0025.
- Hall, Stephen G. F., Tobias Lenz, and Anastassia Obydenkova. 2021. “Environmental Commitments and Rhetoric over the Pandemic Crisis: Social Media and Legitimation of the AIIB, the EAEU, and the EU.” Post-Communist Economies. doi: 10.1080/14631377.2021.1954824.
- Izotov, V. S., and A. V. Obydenkova. 2021. “Geopolitical Games in Eurasian Regionalism: Ideational Interactions and Regional International Organisations.” Post-Communist Economies 33 (2–3): 150–74. doi:10.1080/14631377.2020.1793584.
- Jiang, Jingjing, Ye Bin, Ma Xiaoming, and Lixin Miao. 2016. “Controlling GHG Emissions from the Transportation Sector through an ETS: Institutional Arrangements in Shenzhen, China.” Climate Policy 16 (3): 353–71. doi:10.1080/14693062.2014.1003526.
- Khondaker, A. N., Syed Masiur Rahman, Karim Malik, Nahid Hossain, Shaikh Abdur Razzak, and Rouf Ahmad Khan. 2015. “Dynamics of Energy Sector and GHG Emissions in Saudi Arabia.” Climate Policy 15 (4): 517–41. doi:10.1080/14693062.2014.937387.
- Kolk, Ans, and Ewout van der Weij. 1998. “Financing Environmental Policy in East Central Europe.” Environmental Politics 7 (1): 53–68. doi:10.1080/09644019808414372.
- Lankina, T., A. Libman, and A. Obydenkova. 2016a. “Authoritarian and Democratic Diffusion in Post-Communist Regions.” Comparative Political Studies 49 (12): 1599–629. doi:10.1177/0010414016628270.
- Lankina, T. V., A. Libman, and A. Obydenkova. 2016b. “Appropriation and Subversion.” World Politics 68 (2): 229–74. doi:10.1017/S0043887115000428.
- Lavelle, Kathryn. 2003. “Participating in the Governance of Trade: The GATT, UNCTAD and WTO.” International Journal of Political Economy 33 (4): 28–42. doi:10.1080/08911916.2003.11042913.
- Lavelle, Kathryn. 2007. “Exit, Voice, and Loyalty in International Organizations: US Involvement in the League of Nations.” The Review of International Organizations 2 (4): 371–93. doi:10.1007/s11558-007-9015-0.
- Lavelle, Kathryn. 2011. “Multilateral Cooperation and Congress: The Legislative Process of Securing Funding for the World Bank.” International Studies Quarterly 55 (1): 199–222. doi:10.1098/oxfordhb/9780198754800.013.26.
- Levitsky, S., and L.A. Way. 2010. Comparative Authoritarianism: Hybrid Regimes after the Cold War. Cambridge: Cambridge University Press.
- Libman, A., and A. Obydenkova. 2013. “Informal Governance and Participation in Non-democratic International Organizations.” The Review of International Organizations 8 (2): 221–43. doi:10.1007/s11558-012-9160-y.
- Libman, A., and A. Obydenkova. 2014. “Governance of Commons in a Large Nondemocratic Country: The Case of Forestry in the Russian Federation.” Publius: The Journal of Federalism 44 (2): 298–323. doi:10.1093/publius/pjt065.
- Libman, A., and A. Obydenkova. 2019. “Inequality and Historical Legacies: Evidence from Post-communist Regions.” Post-Communist Economies 31 (6): 699–724. doi:10.1080/14631377.2019.1607440.
- Libman, A., and Anastassia V. Obydenkova. 2021. “Global Governance and Eurasian International Organisations: Lessons Learned and Future Agenda.” Post-Communist Economies 33 (2–3): 359–77. doi:10.1080/14631377.2020.1793587.
- Libman, A., and A. V. Obydenkova. 2018a. ““Understanding Authoritarian Regionalism.” Journal of Democracy 29 (4): 151–65. doi:10.1353/jod.2018.0070.
- Libman, A., and A. V. Obydenkova. 2018b. “Regional International Organizations as a Strategy of Autocracy: The Eurasian Economic Union and Russian Foreign Policy.” International Affairs 94 (5): 1037–58. doi:10.1093/ia/iiy147.
- Libman, A., and A. V. Obydenkova. 2020. “Proletarian Internationalism in Action? Communist Legacies and Attitudes Towards Migrants in Russia.” Problems of Post-Communism 67 (4–5): 402–16. doi:10.1080/10758216.2019.1640068.
- Mišić, Mile, and Anastassia Obydenkova. 2021. “Environmental Conflict, Renewable Energy, or Both? Public Opinion on Small Hydropower Plants in Serbia.” Post-Communist Economies. doi:10.1080/14631377.2021.1943928.
- Morlino, L. 2011. Changes for Democracy. Actors, Structures, Processes. Oxford: Oxford University Press.
- Nazarov, Zafar, and Anastassia Obydenkova. 2020. “Democratization and Firm Innovation: Evidence from the European and Central Asian Post-Communist States.” Post-Communist Economies 32 (7): 833–59. doi:10.1080/14631377.2020.1745565.
- Nazarov, Zafar, and Anastassia Obydenkova. 2021. “Public Health, Democracy, and Transition: Global Evidence and Post-Communism.” Social Indicators Research. doi:10.1007/s11205-021-02770-z.
- Neumayer, E. 2002. “Do Democracies Exhibit Stronger International Environmental Commitment? A Cross-Country Analysis.” Journal of Peace Research 39 (2): 139–64. doi:10.1177/0022343302039002001.
- Obydenkova, A. 2012. “Democratization at the Grassroots: The European Union’s External Impact.” Democratization 19 (2): 230–57. doi:10.1080/13510347.2011.576851.
- Obydenkova, A., and R. Salahodjaev. 2016. “Intelligence, Democracy, and International Environmental Commitment.” Environmental Research 147 (1): 82–88. doi:10.1016/j.envres.2016.01.042.
- Obydenkova, Anastassia, Rodrigues Vieira, G. Vinícius, and Jale Tosun. 2021. “The Impact of New Actors in Global Environmental Politics: The European Bank for Reconstruction and Development Meets China.” Post-Communist Economies. doi: 10.1080/14631377.2021.1954825.
- Obydenkova, A. V., and B. Arpino. 2018. “Corruption and Trust in the European Union and National Institutions: Changes over the Great Recession across European States.” JCMS: Journal of Common Market Studies 56 (3): 594–611. doi:10.1111/jcms.12646.
- Obydenkova, A. V., and V. G. Rodrigues Vieira. 2020. “The Limits of Collective Financial Statecraft: Regional Development Banks and Voting Alignment with the United States at the United Nations General Assembly.” International Studies Quarterly 64(1): Article sqz080. 13–25. doi:10.1093/isq/sqz080.
- Obydenkova, A. V., and R. Salahodjaev. 2017. “Climate Change Policies: The Role of Democracy and Social Cognitive Capital.” Environmental Research 157: 182–89. doi: 10.1016/j.envres.2017.05.009.
- Ostrom, Elinor. 1990. Governing the Commons: The Evolution of Institutions for Collective Action. Cambridge: Cambridge University Press.
- Ostrom, Elinor. 2012. “Why Do We Need to Protect Institutional Diversity?” European Political Science 11 (1): 128–47. doi:10.1057/eps.2011.37.
- Papaioannou, E., and G. Siourouins. 2008. “Democratization and Growth.” The Economic Journal 118 (532): 1520–51. doi:10.1111/j.1468-0297.2008.02189.x.
- Pillarisetti, J. R. 2005. “The World Bank’s ‘Genuine Savings’ Measure and Sustainability.” Ecological Economics 55 (4): 599–609. doi:10.1016/j.ecolecon.2005.01.018.
- Poberezhskaya, M. 2014. “Reflections on Climate Change and New Media in Russia: Challenges and Opportunities and New Media.” Digital Icons: Studies in Russian, Eurasian and Central European New Media (11): 37–50.
- Poberezhskaya, M. 2015. “Media Coverage of Climate Change in Russia: Governmental Bias and Climate Silence.” Public Understanding of Science 24(1): 96–111. doi:10.1177/0963662513517848.
- Poberezhskaya, M. 2018. “Blogging about Climate Change in Russia: Activism, Scepticism and Conspiracies.” Environmental Communication 12(7): 942–55. doi:10.1080/17524032.2017.1308406.
- Pop-Eleches, G., and J. A. Tucker. 2017. Communism’s Shadow: Historical Legacies and Contemporary Political Attitudes. Princeton and Oxford: Princeton University Press.
- Przeworski, A., M.E. Alvarez, J.A. Cheibub, and F. Limongi. 2000. Democracy and Development: Political Institutions and Well-Being in the World, 1950–1990. Cambridge: Cambridge University Press.
- Przeworski, A., and F. Limongi. 1993. “Political Regimes and Economic Growth.” Journal of Economic Perspectives 7 (3): 51–69. doi:10.1257/jep.7.3.51.
- Rodrik, D., and R. Wacziarg. 2005. “Do Democratic Transitions Produce Bad Economic Outcomes?” American Economic Review 95 (2): 50–55. doi:10.1257/000282805774670059.
- Roth, Dik, Muhammad Shah Alam Khan, Israt Jahan, Rezaur Rahman, Vishal Narain, Aditya Kumar Singh, Monica Priya, Sucharita Sen, Anushiya Shrestha, and Saroj Yakami. 2019. “Climates of Urbanization: Local Experiences of Water Security, Conflict and Cooperation in Peri-Urban South-Asia.” Climate Policy 19 (sup1): S78–S93. doi:10.1080/14693062.2018.1530967.
- Saikawa, Eri. 2013. “Policy Diffusion of Emission Standards Is There a Race to the Top?” World Politics 65 (1): 1–33. doi:10.1017/S0043887112000238.
- Sanwal, Mukul, and Xinzhu Zheng. 2018. “China’s Changing Economy and Emissions Trajectory: Following Global Trends.” Climate Policy 18 (1): 36–41. doi:10.1080/14693062.2016.1227956.
- Tews, Kerstin, Per-Olof Busch, and Jörgens Helge. 2003. “The Diffusion of New Environmental Policy Instruments.” European Journal of Political Research 42 (4): 569–600. doi:10.1111/1475-6765.00096.
- Wagner, A., and F. Schneider. 2006. “Satisfaction with Democracy and the Environment in Western Europe: A Panel Analysis.” Center for Economic Studies & Ifo Institute for Economic Research CESifo Working Paper No. 1660 Institute for the Study of Labor IZA Discussion Paper No. 1929 Available at Social Science Research Network Electronic Paper Collection. Accessed May 15, 2021. http://ssrn.com/abstract=878339.
- Ward, H., X. Cao, and B. Mukherjee. 2014. “State Capacity and the Environmental Investment Gap in Authoritarian States.” Comparative Political Studies 47 (3): 309–43. doi:10.1177/0010414013509569.
- Wigley, S., and A. Akkoyunlu-Wigley. 2011. “The Impact of Regime Type on Health: Does Redistribution Explain Everything?” World Politics 63 (4): 647–77.
- Yasin, Iftikhar, Nawaz Ahmad, and Muhammad Aslam Chaudhary. 2020. “The Impact of Financial Development, Political Institutions, and Urbanization on Environmental Degradation: Evidence from 59 Less-Developed Economies.” Environment, Development and Sustainability. doi:10.1007/s10668-020-00885-w.