
Abstract
The mechanism underlying the antiepileptic actions of norepinephrine (NE) is unclear with conflicting results. Our objectives are to conclusively delineate the specific adrenergic receptor (AR) involved in attenuating hippocampal CA3 epileptiform activity and assess compounds for lead drug development. We utilized the picrotoxin model of seizure generation in rat brain slices using electrophysiological recordings. Epinephrine (EPI) reduced epileptiform burst frequency in a concentration-dependent manner. To identify the specific receptor involved in this response, the equilibrium dissociation constants were determined for a panel of ligands and compared with established binding values for α1, α2, and other receptor subtypes. Correlation and slope of unity were found for the α2A-AR, but not other receptors. Effects of different chemical classes of α-AR agonists at inhibiting epileptiform activity by potency (pEC50) and relative efficacy (RE) were determined. Compared with NE (pEC50, 6.20; RE, 100%), dexmedetomidine, an imidazoline (pEC50, 8.59; RE, 67.1%), and guanabenz, a guanidine (pEC50, 7.94; RE, 37.9%), exhibited the highest potency (pEC50). In contrast, the catecholamines, EPI (pEC50, 6.95; RE, 120%) and α-methyl-NE (pEC50, 6.38; RE, 116%) were the most efficacious. These findings confirm that CA3 epileptiform activity is mediated solely by α2A-ARs without activation of other receptor systems. These findings suggest a pharmacotherapeutic target for treating epilepsy and highlight the need for selective and efficacious α2A-AR agonists that can cross the blood–brain barrier.
Introduction
The noradrenergic system in the central nervous system (CNS) is characterized by a highly divergent projection of norepinephrine (NE)-containing fibers that originate from locus coeruleus neurons and radiate throughout the neuroaxis. Specificity in this system, where NE terminals are spread throughout the brain, is achieved through a diversity of adrenergic receptors (ARs) with distinct expression and functions. This diversity enables NE to regulate a number of critical neural functions including cognition and epileptogenesis [Citation1].
The hippocampus, implicated in cognition, receives one of the highest densities of NE-containing terminals and is often involved in seizures, particularly with temporal lobe epilepsy, the most common form of epilepsy in adults. The high-seizure susceptibility of the hippocampus is believed due in part to the immense interconnectivity between hippocampal CA3 pyramidal neurons, known as recurrent circuitry. Due to the role of neuronal excitatory threshold in both seizure activity and activity-dependent synaptic plasticity, precise manipulation of the network activity in this region is essential to effectively control seizures without interfering with cognition. Several studies suggest that the antiepileptic role of NE alters the epileptic circuit, rendering NE as a more-desirable drug target for disease modification in epilepsy, rather than current therapeutics that merely increase the threshold for seizures [Citation1].
α-ARs are G protein-coupled receptors (GPCRs) that bind and transduce signals for NE and the hormone epinephrine (EPI). α2-AR (α2A, α2B, α2C) and α1-AR subtypes (α1A, α1B, α1D) are all expressed in the hippocampus [Citation2–3]. The mechanism underlying the antiepileptic actions of NE is unclear with both agonists and antagonists of the same AR subtype reporting similar results and both α1- and α2-ARs contributing [Citation4–9]. Although several centrally mediated actions are ascribed to α-ARs, the relative efficacy (RE) and potency of ligands at central α-ARs have not been extensively explored with respect to specific α-AR subtypes, contributing to difficulties in elucidating the CNS pharmacology of NE.
Previously, we presented evidence suggesting that α2A-ARs mediate the antiepileptic effect of NE [Citation10]. However, these findings were not definitive, as mRNA transcripts for α2A- and α2C-ARs were also found in CA3 pyramidal cells [Citation10] and several classes of GPCRs known to mediate CA3 epileptiform activity were not analyzed in that study [Citation11–12]. Therefore, the involvement of other receptor systems remained a distinct possibility.
The first goal of this study was to conclusively delineate the specific receptor(s) involved in attenuating hippocampal epileptiform activity. The second objective of this investigation was to examine the RE and potency of various adrenergic agonists at inhibiting hippocampal CA3 epileptiform activity for future drug development. We also explore if age or gender influence this response as both are known factors in epileptic vulnerability [Citation13–14].
Methods
Reagents
ARC-239, BRL-44408, clonidine hydrochloride, dexmedetomidine hydrochloride, efaroxan hydrochloride, guanabenz acetate, guanfacine hydrochloride, idazoxan hydrochloride, JP-1302, prazosin hydrochloride, rauwolscine hydrochloride, RS-79948, RX-821002, terazosin, UK-14304, WB-4101, and yohimbine hydrochloride were acquired from Tocris (Ellisville, MO). Atipamezole was from Orion Corporation (Espoo, Finland) and isoflurane was from Abbott Diagnostics (Chicago, IL). All other chemicals were obtained from Sigma-Aldrich (St. Louis, MO).
Animal use
Sprague-Dawley rats (31–200 d) weighing 90–300 g of both sexes were used and housed on a 12-h light/dark cycle in rooms maintained at a temperature of ∼22 °C with a relative humidity of ∼55%. Water and food were provided ad libitum. All protocols described have been approved by the Institutional Animal Care and Use Committee at the University of North Dakota in accordance with the Guide for the Care and Use of Laboratory Animals published by the National Institutes of Health.
Hippocampal slice preparation
Sprague-Dawley rats were anesthetized with isoflurane and sacrificed by decapitation. Brains were rapidly removed and the hippocampi quickly dissected from each hemisphere and placed into a 4 °C solution that contained 110 mM choline chloride, 2.5 mM KCl, 7 mM MgSO4, 0.5 mM CaCl2, 1.25 mM NaH2PO4, 25 mM NaHCO3, 25 mM D-glucose, 11.6 mM sodium ascorbate, and 3.1 mM sodium pyruvate. Using a conventional tissue chopper, the hippocampi were sliced transversely into 500-µm sections and transferred to artificial cerebral spinal fluid (ACSF) solution consisting of 119 mM NaCl, 5 mM KCl, 1.3 mM MgSO4, 2.5 mM CaCl2, 1 mM NaH2PO4, 26.2 mM NaHCO3, and 11 mM D-glucose. The slices were incubated for 30 min at 34 °C, then transferred to room temperature (RT) and allowed to recover for at least 30 min. All solutions were continually aerated with 95% O2, 5% CO2.
Electrophysiological recordings
Microelectrodes were made from borosilicate glass using a PP-830 vertical two-stage puller (Narashige, Tokyo, Japan) and filled with 3 M NaCl. A slice was submerged in the recording chamber and perfused at a rate of ≥4 ml/min with ACSF at RT. Using a SZ-61 stereo microscope (Olympus, Melville, NY) to visualize the CA3 region of the hippocampus, the microelectrode was placed in the center of stratum pyramidale. Extracellular field potentials were detected using either an Axoclamp 2B (Molecular Devices, Sunnyvale, CA) or BVC-700A (Dagan, Minneapolis, MN), amplified by a Brownlee 440 (Brownlee Precision, San Jose, CA), digitized with a Digidata 1322 A (Molecular Devices), and recorded using Axoscope 9.0 software (Molecular Devices).
Generation of spontaneous epileptiform activity
Spontaneous epileptiform bursts were elicited by superfusing the slice with ACSF containing the GABAA antagonist picrotoxin (100 µM) to attenuate the synaptic inhibition (). If no burst discharges were seen after 30 min of perfusion, the slices were determined to be unresponsive and discarded. Once burst discharges were evident, 30 min of baseline data was recorded. The ACSF also contained desipramine (0.5 µM) to block the potential reuptake of catecholamines and timolol (10 µM) to block any β-AR-mediated effects. Some α2-AR ligands are known to possess potent 5-HT1A-mediated agonist activity. For these AR ligands, pindolol (3 µM) which blocks both β-AR and 5-HT1A receptors was used in the place of timolol which only blocks β-ARs.
Figure 1. EPI reduces epileptiform burst discharge frequency. (A) Generation of hippocampal CA3 activity. Illustrated are pseudo-color images of a single epileptiform burst generated by voltage sensitive dye. (B) Continuous 150 s-long chart recordings of burst discharges are visualized on Axoscope 9.2. Increasing EPI produced a dose-dependent reduction of epileptiform burst activities. (C) Frequency histogram of burst discharges versus time of EPI administration. Each bin represents a 150-s time interval. (D) Concentration–response curve derived from 52 experiments.
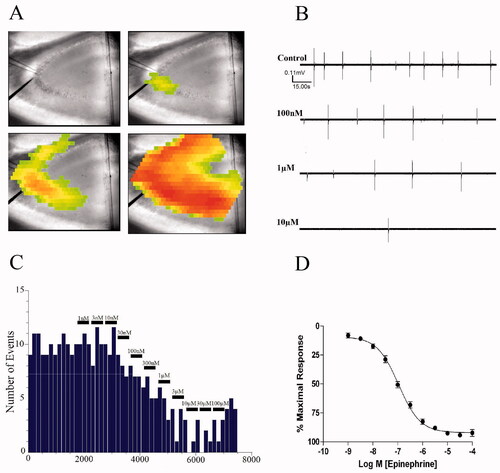
Epileptiform burst discharge frequencies were visualized in real time () using Mini Analysis 6.0 software (Synaptosoft, Decatur, GA). Burst frequency was binned in the course of the experiment in 180-s intervals (). The last interval correlating to each agonist concentration was noted, baseline frequency was subtracted, and that value was used to plot a concentration–response curve expressed as percentage of maximal response ().
Experimental pKb values for each α-AR ligand were determined using the method of Schild [Citation15]. For each experiment, cumulative concentration–response curves were performed in hippocampal slices from the same rat (single concentration–response curve per slice). Dose-ratios of EC50 values were calculated in the presence and absence of a αAR ligand and Schild regressions constructed. Linear regression analysis of these points was used to determine the slope and x-intercept of the Schild regressions.
Experimental pEC50 values and RE were determined by measuring the change in response elicited by each α-AR ligand. The pEC50 was calculated from the dose–response curve by non-linear regression analysis. The RE was calculated as the maximal response for each α-AR ligand normalized to the maximal response elicited by NE (i.e. 100), for comparisons of the maximal response between agonists and to allow comparisons to published data [Citation16]. However, (−)EPI was used in experimental conditions to increase assay sensitivity due to its larger RE value (i.e. 120) compared with NE.
Statistical methods
Concentration–response curves were constructed using a non-linear least squares curve fitting method in Prism (GraphPad, San Diego, CA). Each curve was fit with a standard (unity) or variable slope, and the best-fit determined using an F-test with a value of p < 0.05. Significance between groups was tested using an unpaired two-tailed Student's t test (p < 0.05).
Slopes are expressed as the mean ± SE and the 95% confidence level used to conclude a significant difference between groups. Differences in pKb values and Schild regression slopes were determined by analysis of covariance with a p < 0.01 level of probability as significant. Calculated pEC50 and pKb values are expressed as the mean ± SE for n experiments.
Results
Effects of EPI on hippocampal CA3 epileptiform activity
Under conditions of impaired synaptic inhibition by picrotoxin, CA3 pyramidal cells will spontaneously fire epileptiform burst discharges which will spread throughout the CA3 region. As illustrated in , each burst discharge is characterized by a sharp biphasic spike that corresponds to the synchronous depolarization and hyperpolarization of a population of CA3 pyramidal cells. In the absence of α-AR blockade, application of EPI reduces the frequency of these events in a concentration-dependent manner without affecting their amplitude (). Using a frequency histogram of the EPI-induced reduction in burst activity (), a concentration–response curve was constructed (). The mean EC50 for the EPI-induced decrease in burst frequency, derived from an aggregate of 52 experiments, was 108 ± 19 nM ().
Effects of selective α-AR ligands on EPI-mediated inhibition of epileptiform activity
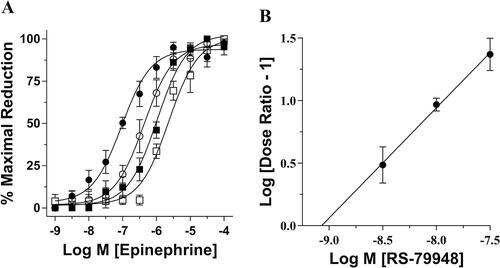
To identify receptor involved in this response, the equilibrium dissociation constant (pKb) of an α-AR ligand was functionally determined. Hippocampal slices that had been perfused with ACSF containing 3, 10, and 30 nM of RS-79948, a highly potent α2-AR antagonist [Citation17], produced 4-, 13-, and 34-fold of parallel rightward shifts of the control EPI concentration–response curve (). The Schild regression slope included unity and the x-intercept of the regression line represent the RS-79948 pKb of 9.00 ± 0.16 (). This pKb corresponded closely to the affinity value of RS-79948 for α2-ARs (Table S1) and suggested that a α2-AR was mediating the effect of EPI on attenuating epileptiform burst discharge frequencies.
Figure 2. Schild regression analysis using a highly selective α2-AR antagonist. (A) Consecutive EPI concentration–response curves demonstrate a concentration-dependent effect of the selective α2-AR antagonist RS79948. Pretreatment with 3 nM (○), 10 nM (■), and 30 nM (□) of RS79948 produced consecutive parallel rightward shifts of the curve that were significantly different from control (●) (EC50 = 423 ± 148 nM, 1211 ± 204 nM and 3221 ± 1954 nM, respectively, vs. 95 ± 16 nM for control). (B) Using dose ratios calculated from individual experiments illustrated in (A), a Schild plot was created generating a regression slope equaling 0.95 ± 0.11 and an x-intercept correlating to a pKb value of 9.00 ± 0.16 (n = 5).
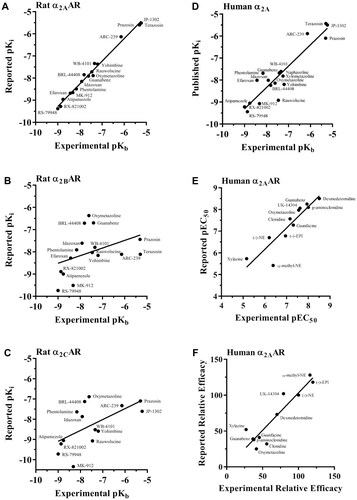
An assortment of α-AR ligands was then used to determine the specific subtype involved in this response and experimental pKb values for these compounds were calculated. In all instances, ligands produced parallel rightward shifts of the fitted EPI concentration–response curve. Furthermore, the slope of the regression curve was unity for each of these compounds (Table S1). The calculated pKb values of the α-AR ligands antagonizing EPI-induced reduction of epileptiform burst discharges were as follows: RS-79948 (9.00) > RX-821002 (8.87) > atipamezole (8.76) > efaroxan (8.43) > MK-912 (8.32) > phentolamine (8.16) > idazoxan (7.92) > BRL-44408 (7.81) > oxymetazoline (7.61) > rauwolscine (7.46) ≥ naphazoline (7.42) = guanabenz (7.40) > WB-4101 (7.34) > xylometazoline (7.25) ≥ yohimbine (7.20) > ARC-239 (6.14) > prazosin (5.31) = terazosin (5.30) ≥ JP-1302 (5.23). We then correlated these experimental pKb values with previously established pKi values for the rat and human α-AR subtypes (Table S1). There was a high correlation between our experimental pKb values and the pKi values for both the rat α2A-AR (r = 0.99, slope = 1.02, ) and human α2A-AR (r = 0.93, slope = 0.97, ). In contrast, all other receptor subtypes showed either a lower correlation (r ≤ 0.90) and/or a negative slope (, Table S2).
Figure 3. Correlation between experimental and reported pharmacological values for various α-AR ligands at rat or human α2A-ARs. Using the pKi values in Table S1, correlation analyses were performed for the rat α2A- (A), α2B- (B), and α2C-AR (C), or using pKb (D), pEC50 (E), or RE (F) at human α2A-ARs. The correlation coefficient and slope was 0.99 and 1.02, respectively, for the rat α2A-AR. A correlation coefficient and slope of 0.91 and 0.98, respectively, when correlating experimental pEC50 with the published human pEC50 for the α2A-AR. A correlation coefficient and slope of 0.92 and 1.05, respectively, when correlating experimental RE with the published human RE for the α2A-AR. Individual pKb and pKi values can be found in Table S1. Individual pEC50 and relative efficacy values are presented in Table S3. The slope and fit of each correlation are summarized in Tables S2 and S4.
Comparison of various classes of α-AR agonists normalized to percent maximal reduction of NE
To extend the relevance to possible human application, we then correlated our experimental pEC50 values with published pEC50 values of mouse and human α2-ARs, and human 5-HT1A (Table S3). Although agonist responses such as potency and RE are system-dependent and may not reflect the same intracellular pathways and amplification effects, there was high correlation of the potency data to the human α2A-AR subtype (r = 0.92) along with a slope of unity (). In contrast, for the human α2B- or α2C-AR, poor correlation coefficients were observed (Table S4). As imidazolines/guanidines can also cross-react with serotonergic receptors, we also compared published pEC50 with those of the 5-HT1A subtype (Table S3). However, apart from oxymetazoline, imidazolines/guanidines displayed over 10–1000 fold lower potency for the 5-HT1A, compared with the α2A-AR, consistent with their low correlation (0.42) (Table S2).
Characterization of various AR agonists on attenuating epileptiform burst activities
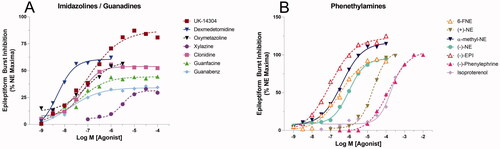
We next examined the effects of various adrenergic agonists at inhibiting rat hippocampal CA3 epileptiform activity. AR agonists representing three chemical classes were tested and compared with the actions of NE. The rank order potency and RE values for the catecholamines were as follows: EPI (EC50 = 72 ± 18 nM, RE = 1.20) > 6-FNE (EC50 = 380 ± 162 nM, RE = 0.91) ≥ α-methyl-NE (EC50 = 417 ± 199 nM, RE = 1.16) > (−)-NE (EC50 = 630 ± 207 nM, RE = 1.00) > deoxyNE (EC50 = 3550 ± 3400 nM, RE = 1.00) > (+)-NE (EC50 = 24000 ± 7900 nM, RE = 0.98) > phenylephrine (EC50 = 107 ± 148 μM, RE = 0.76) > isoproterenol (EC50 = 182 ± 51 μM, RE = 0.84). All catecholamines exhibited very high RE but relatively low potency when compared with other classes (Table S3, ). In contrast, of the imidazolines and guanidines ligands, only UK-14304 was found to be a full agonist (≥ 0.75 RE) at a 79.2% relative efficacy to NE. All of the other imidazoline and guanidine ligands were partial agonists; however, most exhibited significantly higher potency than catecholamines (). The rank order potency and RE for the imidazolines and guanadines tested were as follows: dexmedetomidine (EC50 = 2.57 ± 1.56 nM, RE = 0.67) > guanabenz (EC50 = 11 ± 10 nM, RE = 0.40) ≥ p-aminoclonidine (EC50 = 13 ± 13 nM, RE = 0.32) > UK-14304 (EC50 = 24 ± 21 nM, RE = 0.79) ≥ oxymetazoline (EC50 = 28 ± 23 nM, RE = 0.41) ≥ xylometazoline (EC50 = 33 ± 36 nM, RE = 0.20) > guanfacine (EC50 = 49 ± 46 nM, RE = 0.45) > clonidine (EC50 = 69 ± 37 nM, RE = 0.56) ≫ xylazine (EC50 = 6900 ± 6200 nM, RE = 0.27).
Figure 4. Comparison of various classes of α-AR agonists normalized to percent maximal reduction of NE on epileptiform burst inhibition. (A) The rank order potency for the imidazolines and guanadines is as follows: dexmedetomidine > guanabenz > UK-14304 ≥ oxymetazoline > guanfacine > clonidine ≫ xylazine. (B) The rank order potency for phenethylamines and their derivatives tested is as follows: EPI > 6-FNE ≥ α-methyl-NE > (−)-(R)-NE ≫ (+)-(S)-NE > (−)-Phenylephrine > Isoproterenol.
Effects of age and gender on the α2A-AR properties of EPI
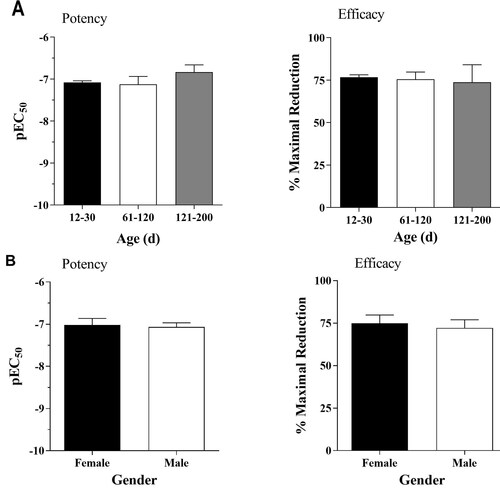
All data presented in this paper were collected in postnatal day (PND) from 12–30 rats, both male and female, with the exception of several from older age groups ranging from two to six month to determine the effects of age and gender on EPI’s ability to reduce epileptiform burst activities in the hippocampus. The three age groups PND 12–30, PND 60–120, and PND 121–200 all showed similar average pEC50 values and RE values with no statistically significant differences between any groups (). Similar comparisons were conducted with respect to gender ().
Figure 5. (A) Effects of age on the EPI-mediated inhibition of epileptiform activity. The average EC50 values for the PND12–30, 60–120, and 121–200 groups were 131 ± 10 nM (n = 140), 160 ± 70 nM (n = 9), and 204 ± 79 nM (n = 8), respectively. The average efficacy values for the three groups were 75 ± 2% (n = 140), 75 ± 5% (n = 9), and 73 ± 9% (n = 7), respectively. (B) Sex does not influence EPI-mediated inhibition of epileptiform activity. Age-matched average EC50 values are 93 ± 31 nM (n = 13) and 86 ± 19 nM (n = 13). Age-matched average efficacies are 75 ± 4.9% (n = 13), and 72 ± 4.9% (n = 13). Paired t-tests indicate no statistical significance in age or gender.
Discussion
In this study, we identified which AR mediates the inhibitory effect of NE on picrotoxin-induced rat hippocampal CA3 epileptiform activity and characterized various α-AR agonist classes at this antiepileptic response. Although previous findings suggested that the α2A-AR was primarily mediating the antiepileptic action of NE, these results did not eliminate the possibility of effects due to α2C-AR, α1-AR, D2, and 5-HT1A [Citation10]. This was mainly due to the low number of antagonists used in that study as well as the fact that α2A-AR mRNA expression level, used to identify the subtype, does not necessarily correlate to receptor protein function.
We addressed this problem by using a large number of α-AR ligands across receptor subtypes. In addition, we compiled a comprehensive list of binding (Table S1) and pEC50 (Table S3) profiles because many of the imidazolines/guanidines used in our study have affinities for other receptors, such as the 5-HT1A. However, other than oxymetazoline which displays selectivity for human 5-HT1A, all other imidazolines/guanidines displayed poor potency for 5-HT1A. Activation of 5-HT1A receptor has been shown to inhibit hippocampal network activity, although through an entirely different mechanism than that of α2A-ARs, as 5-HT1A activation leads to hyperpolarization of pyramidal cells, thereby inhibiting all neuronal activities [Citation17]. This mechanism of inhibition would not be an ideal therapeutic target for epilepsy since the absence of pyramidal cell activity would eliminate vital hippocampal functions such as cognition. In contrast, modulation of α2A-AR by an agonist such as EPI does not hyperpolarize pyramidal cells (data not shown). Instead, we hypothesize that α2A-AR activation reduces excess CA3 pyramidal cells recurrent network activity without interfering with normal transmission to and from the hippocampal CA3 region.
Using calculated pKb for each ligand (), a correlation study of all the receptor subtypes (Table S1) was performed. As Table S2 indicates, the rat α2A-AR exhibited near-perfect correlation with a slope and correlation coefficient of 1, whereas all other receptor subtypes showed very poor correlations. Our data indicate that the α2A-AR is the sole mediator of the NE-mediated anti-epileptic action in the rat CA3 hippocampus. When the same correlation plot was also performed with respect to pKi values from cloned human receptor subtypes (Table S2), the α2A-AR exhibited a slope and r value of 0.97 and 0.93, respectively, which strengthens the applicability of our findings for therapeutic purposes in humans.
Upon resolving the identity of the receptor subtype, we next assess the most suitable agonist for lead drug development. We also tested different classes of AR agonists (catecholamine, imidazoline, guanidine) to evaluate their performance at inhibiting epileptiform burst activities with respect to NE (). From a therapeutic standpoint, agonist(s) possessing the highest potency and efficacy would be the most promising candidate. Although most catecholamine compounds are expected to be full agonists, the imidazoline/guanidine agonists have little structural resemblance to catecholamines and therefore may interact with the α2-ARs through completely different mechanisms [Citation18–19]. However, unlike catecholamines, most imidazolines/guanidines can cross the blood–brain barrier, which is critical when considering their potential role in drug therapies. Rank order potency revealed that the imidazolines/guanidines possessed the highest pEC50 values (), as the most potent imidazoline, dexmedetomidnine, is over 30-fold more potent than EPI, the most potent catecholamine. However, all catecholamines were full agonists while only one non-catecholamine, UK-14304 (RE = 79.2), was a full agonist in this system ().
To better address the relevance of our findings with clinical applications, we compared our experimental EC50 values with published EC50 for cloned human α2-ARs (Table S3). The most efficacious, potent, and subtype selective agonist with the ability to cross the blood–brain barrier would be the ideal candidate for clinical application. Catecholamines had excellent efficacy (, Table S3), but none can cross the blood–brain barrier because of a highly charged protonated amine. The most potent agonists either had no subtype selectivity (dexmedetomidine), or had very poor efficacy (guanabenz, oxymetazoline) (, Table S3). UK-14304 is the only agonist which exhibited moderate efficacy and potency, some subtype selectivity (10-fold greater potency at α2A-ARs than α2B- or α2C-ARs), and a 1,000-fold lower potency toward 5-HT1A. Even so, the clinical applicability of UK-14304 is not ideal because, as with all non-catecholamines, the consistency of this agonist was not as high as catecholamines. EPI produced consistent effects that gave sigmoidal curves with little variance. In contrast, UK-14304 curves were often not sigmoidal and its potency and efficacy had large standard deviations (Table S3). It has been hypothesized and now shown in crystal structures that imidazolines activate ARs differently than catecholamines [Citation18,Citation20–23], which would account for the irregularities we have observed. In particular, F4277.39, a key residue in α2A-AR activation and identified as a ‘switching lid’ of an aromatic cage [Citation22], makes stronger contacts to the imidazoline ring than the amino-ethyl of NE [Citation23], which contributes to imidazoline efficacy and subtype selectivity. Distinguishing UK-14304 from dexmedetomidine, the bicyclic aromatic moiety of UK-14304 interacts stronger than dexmedetomidine with Y4096.55, another key residue involved in α2A-AR activation, and suggested to play a role in pathway-specific signaling similar to NE [Citation23]. In conjunction with UK-14304 being α2A-AR subtype selective while dexmedetomidine is not, chemical derivation of UK-14304 may produce a more ideal clinical candidate that preserves NE-specific antiepileptic function. Although imidazolines in general impart better potency than catecholamines because of higher binding affinities to α2-ARs (i.e. affinity-driven agonists), incorporating efficacy in the assessment [Citation24] provides the best guide to derivation of UK-14304, as both subtype-selectivity as well as full agonism would be the ideal antiepileptic therapeutic.
Finally, we explored age and gender as both parameters are associated with higher incidence of epilepsy [Citation13–14]. However, our data suggest that age and gender do not significantly influence the potency or efficacy of EPI (). As low efficacy, signaling-bias, and pregnancy/menopause may induce changes in pharmacokinetics [Citation25] that influence age and gender responses to therapeutics, our conclusions are limited and cannot be translated to other drugs such as the imidazolines/guanidines.
The functional CNS model of analysis performed here is seldom used, which is one of the factors that led to a disproportional understanding of AR in the periphery than in the CNS. Our in situ functional model offers an unique outlook on AR agonist functions rarely explored by in vitro models such as [35S]GTPγS binding by Jasper et al. [Citation19] Although this study reported a comprehensive list of pEC50 values for a large number of compounds, the absence of a relatable physiological function remains a major drawback. Because of the nature of the methods, system specificity cannot be easily achieved by conventional in vivo and in vitro models. Therefore, separation and retention of the complete hippocampal CA3 circuitry in situ are one of our primary strengths, which allowed us to study the pharmacology of the α-AR system as a whole.
In summary, the α2A-AR was determined to be the sole AR subtype mediating EPI-inhibition of rat hippocampal CA3 epileptiform activity and activity was neither gender nor age-dependent. Compared with established binding (pKi) values for the rat and human receptors, our data also suggest that the α2A-AR is a promising target for attenuating human hippocampal CA3 epileptiform activity. Generation of highly selective, efficacious, and brain-penetrant agonists for the α2A-AR based upon the UK-14304 pharmacophore could provide novel therapeutic strategies for treating temporal lobe epilepsy.
Supplemental Material
Download Zip (67.1 KB)Acknowledgements
The authors thank Sarah J. Boese, Jasmine J. O’Brien, Jackie L. Pribula, and Christina L. Schulte for assistance with experiments during their summer research experiences, and Dr. Rory McQuiston for assistance with the voltage sensitive dye images.
Disclosure statement
No potential conflict of interest was reported by the authors.
Data availability statement
Supplemental data sets are directly available in this manuscript or by contacting the corresponding author, Dr. Van Doze.
Additional information
Funding
References
- Giorgi FS, Pizzanelli C, Biagioni F, et al. The role of norepinephrine in epilepsy: from the bench to the bedside. Neurosci Biobehav Rev. 2004;28(5):507–524.
- Happe HK, Coulter CL, Gerety ME, et al. α2-adrenergic receptor development in rat CNS: an autoradiographic study. Neuroscience. 2004;123(1):167–178.
- Zilles K, Gross G, Schleicher A, et al. Regional and laminar distributions of alpha1-adrenoceptors and their subtypes in human and rat hippocampus. Neuroscience. 1991;40(2):307–320.
- Weinshenker D, Szot P. The role of catecholamines in seizure susceptibility: new results using genetically engineered mice. Pharmacol Ther. 2002;94(3):213–233.
- Clinckers R, Zgavc T, Vermoesen K, et al. Pharmacological and neurochemical characterization of the involvement of hippocampal adrenoreceptor subtypes in the modulation of acute limbic seizures. J Neurochem. 2010;115(6):1595–1607.
- Ghasemi M, Mehranfard N. Mechanisms underlying anticonvulsant and proconvulsant actions of norepinephrine. Neuropharmacology. 2018;137:297–308.
- Iváñez V, Ojeda J. Exacerbation of seizures in medial temporal lobe epilepsy due to an alpha1-adrenergic antagonist. Epilepsia. 2006;47(10):1741–1742.
- Löscher W, Czuczwar SJ. Comparison of drugs with different selectivity for Central alpha1- and alpha2-adrenoceptors in animal models of epilepsy. Epilepsy Res. 1987;1(3):165–172.
- Weinshenker D, Szot P, Miller NS, et al. Alpha(1) and beta(2)-adrenoreceptor agonists inhibit pentylenetetrazole-induced seizures in mice lacking norepinephrine. J Pharmacol Exp Ther. 2001;298(3):1042–1048.
- Jurgens CWD, Hammad HM, Lichter JA, et al. α2A adrenergic receptor activation inhibits epiletiform activity in the rat hippocampal CA3 region. Mol Pharmacol. 2007;71(6):1572–1581.
- Gill CH, Soffin EM, Hagan JJ, et al. 5-HT7 receptors modulate synchronized network activity in rat hippocampus. Neuropharmacology. 2002;42(1):82–92.
- Tesson F, Limon-Boulez I, Urban P, et al. Localization of I2-imidazoline binding sites on monoamine oxidases. J Biol Chem. 1995;270(17):9856–9861.
- Hauser WA. Seizure disorders: the changes with age. Epilepsia. 1992;33 Suppl 4(Suppl 4):S6–S14.
- Savic I. Sex differences in human epilepsy. Exp Neurol. 2014;259:38–43.
- Arunlakshana O, Schild HO. Some quantitative uses of drug antagonists. Br J Pharmacol Chemother. 1959;14(1):48–58.
- Uhlén S, Dambrova M, Näsman J, et al. 3H]RS79948-197 binding to human, rat, guinea pig and pig α2A-, α2B- and α2C-adrenoceptor. Comparison with MK912, RX821002, rauwolscine and yohimbine. Eur J Pharmacol. 1998;343(1):93–101.
- Beck SG, Choi KC, List TJ. Comparison of 5-hydroxytryptamine1A-mediated hyperpolarization in CA1 and CA3 hippocampal pyramidal cells. J Pharmacol Exp Ther. 1992;263(1):350–359.
- Ruffolo RR, Jr, Rice PJ, Patil PN, et al. Differences in the applicability of the easson-stedman hypothesis to the alpha1- and alpha2-adrenergic effects of phenethylamines and imidazolines. Eur J Pharmacol. 1983;86(3-4):471–475.
- Jasper JR, Lesnick JD, Chang LK, et al. Ligand efficacy and potency at recombinant α2-adrenergic receptors: agonist-mediated [35S]GTPγS binding. Biochem Pharmacol. 1998;55(7):1035–1043.
- Chen X, Xu Y, Qu L, et al. Molecular mechanism for ligand recognition and subtype selectivity of α2C-Adrenergic receptor. Cell Rep. 2019;29(10):2936–2943.e4.
- Yuan D, Liu Z, Kaindl J, et al. Activation of the α2B-adrenoceptor by the sedative sympatholytic dexmedetomidine. Nat Chem Biol. 2020;16(5):507–512.
- Qu L, Zhou Q, Xu Y, et al. Structural basis of the diversity of adrenergic receptors. Cell Rep. 2019;29(10):2929–2935.e4.
- Xu J, Cao S, Hübner H, et al. Structural insights into ligand recognition, activation, and signaling of the α2Aadrenergic receptor. Sci Adv. 2022;8(9)eabj:5347.
- Strange PG. Agonist binding, agonist affinity and agonist efficacy at G protein-coupled receptors. Br J Pharmacol. 2008;153(7):1353–1363.
- Soldin OP, Mattison DR. Sex differences in pharmacokinetics and pharmacodynamics. Clin Pharmacokinet. 2009;48(3):143–157.