
Abstract
This article presents the results of measurements of mechanical parameters for foamed materials with non-Newtonian liquid characteristics (energy suppressed in the sample, force transferred to the anvil during the dynamic tests). In dynamic studies, the following characteristics were determined: the pressure forces exerted on the anvil as a function of the sample deflection during the impact, the energy suppressed in the sample depending on the temperature and the energy suppressed in the sample depending on the sample density. Foamed materials with non-Newtonian characteristics are currently used as elements protecting against impacts. Such materials have been used for the first time in protective helmets, and in particular in those designed for workplace applications.
1 Introduction
Materials with non-Newtonian liquid characteristics are not subject to Newton’s hydrodynamic law [Citation1]. This means that they fail to demonstrate a linear relationship between the static stress and the compression velocity. Another feature of materials with non-Newtonian liquid characteristics is that they can act like solid bodies, deforming or cracking, or flow like liquids [Citation1]. Materials with non-Newtonian liquid characteristics can take the form of a solid (when they are referred to as foamed materials) or a liquid. Three fundamental groups have been distinguished among the non-Newtonian liquids [Citation1–3]:
rheostable liquids, whose rheological properties are independent of the shear time;
viscoelastic liquids, combining the rheological properties of viscous liquids and elastic solids, which demonstrate partial elastic return after elimination of the tangential stress that causes deformation –Maxwell fluids and Bingham fluids are particular cases of such liquids;
rheologically unstable liquids, whose rheological properties are dependent on the shear time (e.g., thixotropic or rheopectic fluids).
The possibility to produce foamed materials with non-Newtonian liquid characteristics has enabled their application in products for which it is very important to combine flexibility with high requirements in terms of shock-absorbing properties [Citation4,Citation5]. To date, materials such as rubber, plastic, elastomer materials and soft and hard microcellular polyurethane foams have been used. Textile materials capable of kinetic energy suppression [Citation6] for certain ranges of value, with a capacity comparable to that characterizing elastomer materials, have also been in use. These materials (e.g., microporous rubber, foamed rubber, polyvinyl chloride [PVC] and nitrile mixture) used, e.g., in shockproof pads are characterized by high energy absorption capacity and a small instant flexibility (elastic return) [Citation7,Citation8]. To improve the protective properties, the thickness of the cushioning material can be increased. However, the greater the density and thickness of the material, and the value of the force transferred through the sample, the less suitable such material is to protect against impacts [Citation6] because this causes a significant increase in weight and imposes restrictions of mobility.
Another example of materials with favourable energy absorption rates are knitted fabrics with different spacer design and thickness. Shockproof properties also characterize a product manufactured in shock absorbing liquid technology – a packet with a strong outer shell filled with numerous small and flexible capsules mixed with a liquid or grease, embedded in a matrix fluid. During a collision, the capsules are displaced, which allows the package to adopt the shape of the striking object, with simultaneous suppression of energy [Citation9]. The shock-absorbing material most commonly used in the case of protective helmets is polystyrene foam (EPS). By analysing its stress–strain characteristics, depending on the density, it is clearly visible that where the EPS foam density increases, the value of the strain decreases, which is followed by an exponential increase in stress [Citation10].
Therefore, to improve the user’s comfort and maintain the shock-absorbing properties, at the end of the 20th and the beginning of the 21st century, technological solutions based on the application of ‘intelligent molecules’ came into use [Citation9]. The most common basis of modern materials with non-Newtonian liquid characteristics used in engineering is polymers. They are composed of molecules, which move freely under small loads and forces. However, as a result of a violent impact, the individual molecules come close and connect to each other. Such a structure means that the shock-absorbing element retains its flexibility while worn, but on impact it hardens, forming a protective layer. In addition, such materials are characterized by a shock absorption parameter several times better than that of twice-as-thick polyurethane foam, or ethylene-vinyl acetate (EVA) copolymer-based material. Thanks to these properties, the use-related discomfort is low – the inlays adapt well to the user’s body, and their weight is small. Examples of such materials include visco-elastic polymer dough (VPD), polyethylene glycol (PEG), which may increase its viscosity by 1000% [Citation11], and a polymer with non-Newtonian liquid characteristics patented under the name D3O [Citation12]. The shear rate of these materials depends on the value of the shear stress and the time, and an increase in shear stress causes an exponential increase in the value of viscosity. The purpose of the study described in this article was to compare the foamed materials with non-Newtonian liquid characteristics of various densities with respect to their suitability for use as shock-absorbing inserts in protective helmets.
Preliminary studies of shock-absorbing materials (other than those with non-Newtonian characteristics) involving energy absorption tests revealed a significant influence of temperature and density on their physical parameters. On the other hand, the nature of such effects is not known for materials with non-Newtonian characteristics used as shock-absorbing elements, e.g., in sports and industrial safety helmets. It should be emphasized that these two different application areas are governed by various standards [Citation13–18].
The aim of the test described in the following was to compare non-Newtonian foamed materials of different densities and at different temperatures in terms of their suitability for use as shock-absorbing insulators in industrial safety helmets.
2 Test samples
For dynamic tests of selected mechanical parameters, three types of cylindrical samples of frontal surface area 95 cm2 and height 10 ± 0.2 mm made from foamed material with non-Newtonian liquid characteristics were selected. The frontal surface area of the sample corresponds to the surface area of rams and anvils used in the dynamic studies. The height of the sample corresponds to the typical thickness of the materials used in construction of shock-absorbing inserts. Three material samples (P1–P3) of differing density in the range 235–336 kg/m3 (see Table ) were selected. Materials of this type are used, among others, in shockproof pads and other items designed to alleviate the effects of an impact.
Table 1. Test sample density.
The structures of the tested materials, as well as their cross-sections and computer image analyses of their surface (done using ImageJ version 1.52j), are shown in Figure . Digital images of cross-sectional areas measuring 185 × 284 mm2 (350 × 502 px2) were recorded using a 2-MP optical microscope (Delta Optical Smart, Poland) and subjected to quantitative analysis of their structure. Image processing was based on simple functions using the following operations: conversion to grayscale (8 bit), brightness and contrast enhancement, and thresholding in the grayscale range of 0–152.
Figure 1. Structure of non-Newtonian foamed materials: (a–c) sample P1, (d–f) sample P2 and (g–i) sample P3 real view, computer analysis image and pore distribution in the sample structure, respectively. Note: The full colour version of this figure is available online.
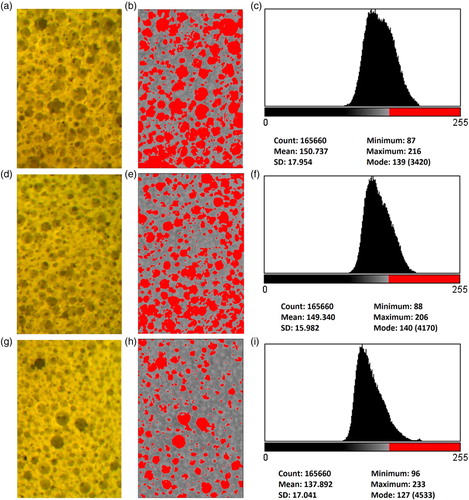
The histograms presented in Figure illustrate the pore distribution and frequency on the sample surface. The x axis represents light intensity expressed in grayscale, and the y axis represents the number of pixels assigned to each grayscale level. A summary of image analysis results is presented in Table .
Table 2. Summary of quantitative computer image analysis of the structure of the tested materials.
Computer analysis of digital images of the samples shows the ratio of pore area to total area. The most important parameters describing the sample structure are the number of pores, the total surface area of pores and the ratio of pore area to total surface area.
As can be seen from the results presented in Figure , samples with the lowest density contain the largest number of pores with the largest area ratio. An increase in density means that a structure containing a larger number of much smaller pores exhibits a lower total area of pores. It has also been found that pore distribution is homogeneous across the entire surface regardless of material density.
3 Research methodology
Dynamic tests of the mechanical parameters of the samples described in Section 2 were carried out using the impact test measuring stand (CIOP-PIB, Poland). The measurement system consists of the following main elements: a vertical frame, a ram beam, a base, a sample deflection sensor, a ram and an anvil with a force sensor 8231C type (Brüel & Kjær, Denmark; measuring range –111 kN and resonance frequency 75 kHz). The test stand was specifically designed for the needs of the research. Figure shows a photograph of the test stand used in the study.
Figure 2. The impact test measuring stand (CIOP-PIB, Poland): 1 = vertical frame, 2 = ram beam, 3 = base of 350 kg weight, 4 = sample deflection sensor, 5 = ram, 6 = anvil with a force sensor.
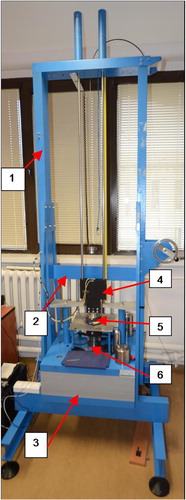
The stand is designed in such a way as to minimize the friction forces and to ensure the movement of the ram as close as possible to free fall. There is a laser light source on the ram. The laser light falling on a photodetector positioned on the frame allows the ram position to be measured in the course of the test. The distance measurement range is 25 mm, resolution 0.05 mm. The results from all detectors are collected and analysed by a connected computer with special software, Sad8 (CIOP-PIB, Poland), running on Windows.
The test involves dropping the ram onto the sample positioned on the anvil from a height of 50 mm. The ram has a cylindrical shape with a face area of 95 cm2. The weight of the ram is 3670 ± 1 g. During the ram drop, the following parameters are measured:
energy suppressed in the sample (Es);
pressure force exerted on the anvil (F) during the impact;
sample deflection during the impact (d).
The used specialist software – Sad8 – enabled the determination of the amount of energy suppressed in the sample and the maximum deflection of the sample. In the dynamic tests, the following characteristics were determined: pressure on the anvil as a function of sample deflection during the impact, energy suppressed in the sample as a function of temperature and energy depressed in the sample as a function of sample density. The tests were conducted on samples conditioned for 24 h at temperatures of –30, –20, –10, 20 or 50 °C, respectively. The temperatures correspond to temperatures of industrial protective helmet conditioning conditions (for EU-type assessment) presented in Standard No. EN 397:2012 + A1:2012 [Citation16]. In addition, a 20°C temperature was included. All of the tests for each of the samples were repeated 10 times.
4 Results
The values of the energy suppressed in the sample (Es) for the P1, P2 and P3 sample types at temperatures T1 = –30 °C, T2 = –20 °C, T3 = –10 °C, T4 = 20 °C and T5 = 50 °C are presented in Table .
Table 3. Energy suppressed in the sample (Es) values for P1, P2 and P3 sample types at temperatures T1 = –30 °C, T2 = –20 °C, T3 = –10 °C, T4 = 20 °C and T5 = 50 °C.
The Es values according to temperature (T) for samples P1, P2 and P3 are presented in Figure . Furthermore, a detailed analysis of the effect of temperature on absorbed energy for the studied density range is presented in Figure .
Figures – show the pressure force acting on the anvil during the impact (F) as a function of sample deflection (d) for samples P1, P2 and P3 at temperatures T1 = –30 °C, T2 = –20 °C, T3 = –10 °C, T4 = 20 °C and T5 = 50 °C.
5 Discussion and conclusions
Figures and show the impact of density and temperature on the Es values of materials with non-Newtonian liquid features intended for use in safety helmets.
Figure 3. Energy suppressed in the sample (Es) according to temperature (T1 = –30 °C, T2 = –20 °C, T3 = –10 °C, T4 = 20 °C and T5 = 50 °C) for samples P1, P2 and P3 (with linear fitting).
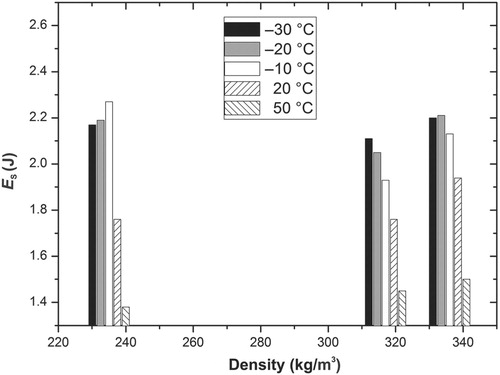
Figure 4. Energy suppressed in the sample (Es) according to temperature (T) for samples (a) P1, (b) P2 and (c) P3 (with linear fitting and SD).
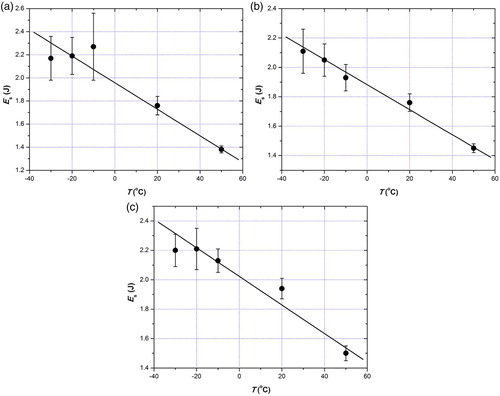
Figure 5. Pressure force acting on the anvil during the impact (F) as a function of sample deflection (d) for sample P1 at temperatures T1 = –30 °C, T2 = –20 °C, T3 = –10 °C, T4 = 20 °C and T5 = 50 °C.
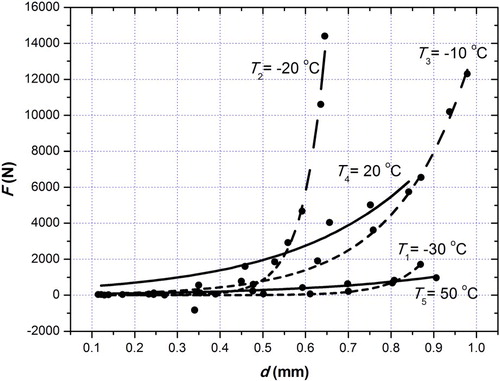
Figure 6. Pressure force acting on the anvil during the impact (F) as a function of sample deflection (d) for sample P2 at temperatures T1 = –30 °C, T2 = –20 °C, T3 = –10 °C, T4 = 20 °C and T5 = 50 °C.
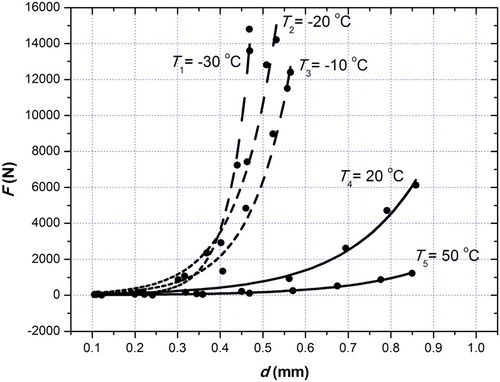
Figure 7. Pressure force acting on the anvil during the impact (F) as a function of sample deflection (d) for sample P3 at temperatures T1 = –30 °C, T2 = –20 °C, T3 = –10 °C, T4 = 20 °C and T5 = 50 °C.
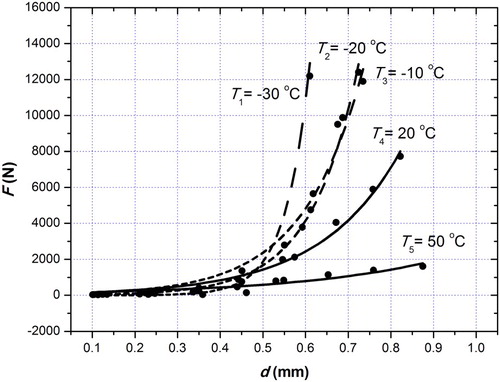
Figure 8. Pressure force acting on the anvil during the impact (F) as a function of sample deflection (d) for samples P1, P2 and P3 at temperature T1 = –30 °C.
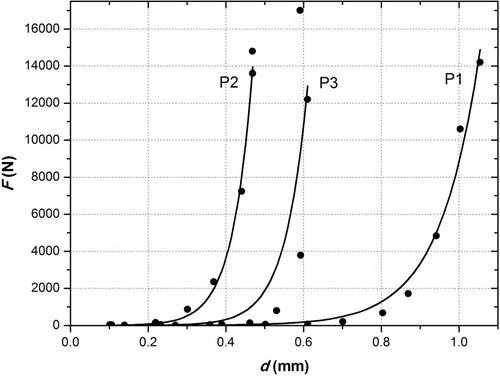
Figure 9. Pressure force acting on the anvil during the impact (F) as a function of sample deflection (d) for samples P1, P2 and P3 at temperature T2 = –20 °C.
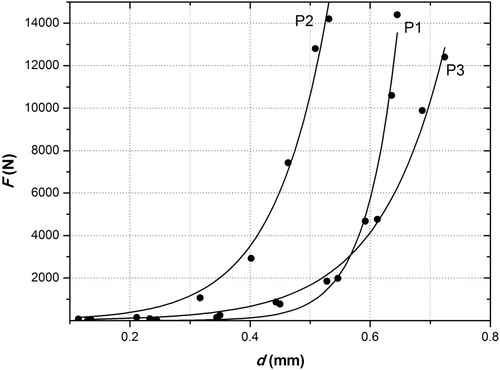
Figure 10. Pressure force acting on the anvil during the impact (F) as a function of sample deflection (d) for samples P1, P2 and P3 at temperature T3 = –10 °C.
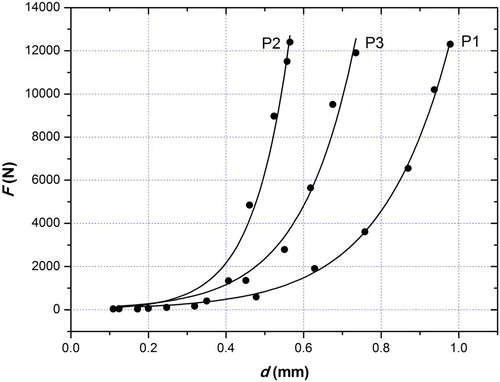
Figure 11. Pressure force acting on the anvil during the impact (F) as a function of sample deflection (d) for samples P1, P2 and P3 at temperature T4 = 20 °C.
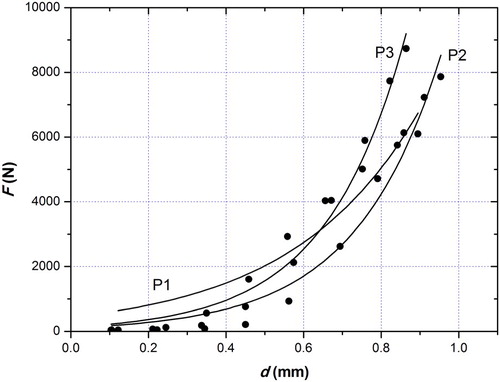
Figure 12. Pressure force acting on the anvil during the impact (F) as a function of sample deflection (d) for samples P1, P2 and P3 at temperature T5 = 50 °C.
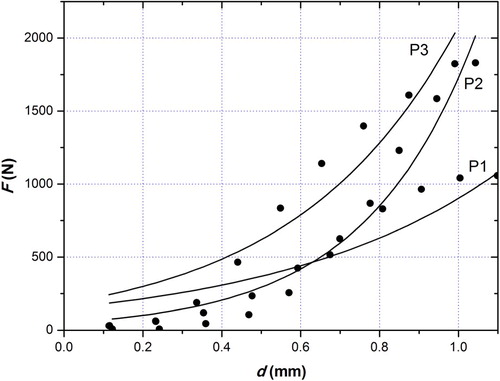
Figure presents the effect of densities on Es under variable temperature conditions (T1 = –30 °C, T2 =–20 °C, T3 = –10 °C, T4 = 20 °C and T5 = 50 °C). Suppressed energy increases with increasing density only for positive temperature (20 and 50 °C). As follows from the presented graphs, the Es value is highest at low temperatures.
Furthermore, Figure shows the correlation of Es as a function of temperature (Es(T)) with the linear approximation. Figure as an extension of the analysis presented in Figure allows one to clearly state that there is a significant temperature effect. For negative temperatures Es was about 2.2 J, while for positive temperatures it dropped to 1.4 J for all samples. The results allow one to conclude that for the studied density range, the suppressed energy does not depend on the density of the samples.
Figures 5–12 present the correlation of F as a function of d for samples P1, P2 and P3 at variable temperatures. As follows from the presented graphs, for all three tested samples the F value changes most rapidly at negative temperatures (mostly at T1 = –30 °C), and most slowly at temperature T3 = 50 °C. The most rapid changes were observed for the sample of highest density, P3, at temperature T1 = –30 °C.
Analysis of the presented results concerning foamed materials with non-Newtonian liquid characteristics in terms of their application as shock-absorbing inserts in protective helmets allows one to establish that, for the tested range density (for samples P1, P2 and P3), the energy suppressed (Es) in the sample does not depend on the density. Es in the sample depends on the temperature. Considering the basic temperature range within which protective helmets are used from –10 (optional –30) to 50 °C, the materials of higher density will provide a higher level of protection while maintaining the user’s comfort.
It should be emphasized that this study applies to the tested range of samples and this research is a preliminary study, while further research will be conducted on a larger amount of materials.
Disclosure statement
No potential conflict of interest was reported by the authors.
Additional information
Funding
Related Research Data
References
- Matras Z. Podstawy mechaniki płynów i dynamiki przepływów cieczy nienewtonowskich [ Fundamentals of the mechanics of liquids and flow dynamics of non-Newtonian fluids]. Kraków: Politechnika Krakowska; 2006. Polish.
- Ferguson J, Kembłowski Z. Reologia stosowana płynów [ Applied rheology of liquids]. Łódź: Marcus; 1995. Polish.
- Wilkinson W. Ciecze nienewtonowskie [ Non-Newtonian liquids]. Warszawa: WNT; 1963. Polish.
- Frederick E., inventor; Pierre Senizergues, assignee; Dynamically moderated shock attenuation system for apparel; Patent Number US2013000020-A1, US8359770-B2; 2007 Feb 12.
- Zografou J, Buenger D., inventors; Impact Protection Technology AG 8000 Zurich (CH), assignee; Hybrid material and production thereof. Patent Number EP2886573-A1, EP2886573-B1; 2013 Dec 20.
- Maklewska E, Demus J, Krucińska I, et al. Comparison analysis of shock-absorbing properties of materials used in impact protectors. Fibres Text East Eur. 2002;10(1):81–84.
- Fortuniak K, Redlich G. Kierunki modyfikacji konstrukcji ochraniaczy przeciwuderzeniowych kończyn i ich wpływ na właściwości ochronne wyrobów gotowych [ Directions of modification of the design of shockproof limb pads and their effect on the protective properties of the final products]. Techniczne Wyroby Włókiennicze. 2008;16(1/2):20–25. Polish.
- Maklewska E. Ochraniacze przeciwuderzeniowe w sporcie – moda i konieczność [ Shockproof pads in sports – fashion and necessity]. Techniczne Wyroby Włókiennicze. 2008;16(1/2):8–14. Polish.
- Łuczyński W, Redlich G, Fortuniak K, et al. Przegląd materiałów charakteryzujących się zdolnością tłumienia energii [ Review of materials characterized by energy suppression capability]. Techniczne Wyroby Włókiennicze. 2006;14(1/2):15–18. Polish.
- Forero Rueda MA, Cui L, Gilchrist MD. Optimisation of energy absorbing liner for equestrian helmets. Part I: layered foam liner. J Mater Des. 2009;30:3405–3413. doi: 10.1016/j.matdes.2009.03.037
- Sha X, Yu K, et al. Shear thickening behaviour of nanoparticle suspensions with carbon nanofillers. J Nanopart Res. 2013;15(7):1–11. doi: 10.1007/s11051-013-1816-x
- D3O. Nothing protects better than D3O®; [ cited 2019 Jun 5]. Available from www.d3o.com
- European Committee for Standardization (CEN). Helmets for alpine skiers and snowboarders. Brussels: CEN; 2007; Standard No. EN 1077:2007.
- European Committee for Standardization (CEN). Helmets for users of luges. Brussels: CEN; 2012; Standard No. EN 13484:2012.
- European Committee for Standardization (CEN). Protective helmets for drivers and passengers of snowmobiles and bobsleighs. Brussels: CEN; 2012; Standard No. EN 13781:2012.
- European Committee for Standardization (CEN). Industrial safety helmets. Brussels: CEN; 2012; Standard No. EN 397:2012+A1:2012.
- European Committee for Standardization (CEN). High performance industrial helmets. Brussels: CEN; 2012; Standard No. EN 14052:2012+A1:2012.
- European Committee for Standardization (CEN). Industrial bump caps. Brussels: CEN; 2012; Standard No. EN 812:2012.
