
ABSTRACT
Objectives. The safety behavior scale (SBS), developed by Neal, Griffin and Hart, is one of the most widely used conceptualizations in the field of occupational safety. Previous studies have evaluated the psychometric properties of this scale in different populations. However, few validation studies have been conducted in the Latin American context. To fill these gaps in the literature, this study aimed to assess the validity, reliability and measurement invariance of this instrument in the context of the Latin American mining industry. Methods. Data were collected from 398 workers from Ecuadorian mining companies. The questionnaire was translated into Spanish following a back-translation process. The latent factorial structure of the SBS was explored by estimating a series of confirmatory factor analysis (CFA) and exploratory equation modeling (ESEM) models. Results. The analyses showed that the two correlated first-order factor CFA representation was the most appropriate model for the data. Measurement invariance by age, type of contract and firm size was also confirmed. Conclusions. The SBS is a valid and reliable measure of safety behavior. In addition, this study determined the applicability of this instrument in the Latin American context, which enhances opportunities for future research in the region.
1. Introduction
According to the United Nations Global Compact and the International Labour Organization (ILO) [Citation1], more than 2.78 million workers worldwide die annually because of occupational accidents or diseases, and 374 million non-fatal work-related injuries occur. Additionally, in terms of economic impact, both institutions remarked that the economic weight of poor occupational safety and health practices account for almost 4% of the global gross domestic product each year. Fatality rates in Latin America and the Caribbean are significantly higher than those reported in industrialized countries (e.g., Switzerland, Sweden and the UK) [Citation2]. As reported by the ILO statistics on safety and health at work, among the region's countries, Costa Rica and Mexico reported the highest fatality rates of 9.7 and 7.5 per 100,000 workers, respectively. Therefore, a better understanding of how to support workplace safety in the region and contributions to assessing different concepts in this field are necessary.
In the case of Ecuador, more than 17,500 occupational accidents were reported in 2020 to the Labor Risk Insurance Office of the Ecuadorian Social Security Institute (IESS; acronym in Spanish) at the national level [Citation3]. These numbers increased by 11% in 2021, resulting in more than 19,400 accidents, mainly in manufacturing (18.6%), wholesale and retail trade (15.4%), agriculture, forestry and fishing (10.5%), transportation and storage (4.1%) and construction (2.6%). In the mining industry, 249 accidents were reported in 2021, 40% more than in 2020. The main factors affecting these accidents were miners and stonemasons (47.4%), and professional and technical workers (28.5%).
Empirical research indicates that tangible safety outcomes such as accidents, incidents and near misses can be conceptually and empirically distinguished from employee safety behaviors such as safety compliance and participation [Citation4]. Safety behavior is a key driver of safety outcomes, and different studies have found a negative relationship between safety behavior and reported injuries and accidents [Citation5–7]. Consequently, focusing on employee performance behaviors allows researchers to better understand how to support workplace safety, as these behaviors are strongly related to psychosocial factors, how workplace safety can be more accurately predicted and how interventions aimed at changing these behaviors can be scaled up in organizations [Citation4].
Several conceptualizations and associated measures of safety-related behaviors exist in the literature. While initial models [Citation8,Citation9] tended to either approach safety behaviors from a unidimensional perspective or focus solely on various aspects of compliance [Citation10,Citation11], more recent models have switched toward a multidimensional approach to safety behaviors [Citation12]. The number and nature of the proposed dimensions varied across various existing models. For example, Hayes et al. [Citation13] proposed a five-factor workplace safety scale that combines perceptions of one's own safety behaviors, the safety behaviors of colleagues and a wider working environment. Burke et al. [Citation12] developed a four-factor model comprising the use of protective equipment, engaging in risk reduction practices, communicating health and safety information, and exercising employee rights and responsibilities. The safety model developed by Neal et al. [Citation14] is another example of a multidimensional conceptualization of safety behaviors, focusing on two broad categories of behaviors: safety compliance and safety participation. This model has become one of the most widely used concepts in the safety field for several reasons. First, the proposed behavioral dimensions are aligned with broader theories of individual work performance [Citation15,Citation16]. Second, the proposed dimensions are embedded into a wider conceptual framework that explains how organizational factors, e.g., safety climate, can shape safety behavior through their effects on employees’ safety knowledge and motivation, and hence can better inform interventions. Third, the various behavioral safety dimensions proposed by alternative models can naturally be grouped under these broader safety compliance and participation categories, as evidenced by various meta-analyses using this taxonomy [Citation4,Citation17,Citation18].
Based on this context, this article is relevant for several reasons. First, despite the global agreement on the importance of occupational safety and health, studies related to the validation, translation into Spanish and adaptation to the Latin American context of the safety behavior scale (SBS) are still scarce. This significantly limits opportunities to monitor behaviors that lead to unsafe outcomes and design early interventions to support safe behaviors at work. Furthermore, it makes it challenging to compare internally, across different industries, and externally with other countries. Second, this article assesses the validity, reliability and measurement invariance (MI) of the SBS, which follows a back-translation process and has been carefully revised to provide an instrument that can be applied in the future in Spanish-speaking Latin American countries. Adapting the SBS would improve opportunities for cross-cultural comparisons and benchmarking, which might be especially insightful for companies operating in different countries in the region. Third, the COVID-19 pandemic has enhanced the importance of workers’ safety and health and their role in achieving safety objectives. In addition, it increased job demands and regulations on occupational safety [Citation19], even though searching for good practices and high standards in this respect had already been an important criterion for organizations, especially in the mining industry. In this sense, validating a scale that measures safety behavior at work will be helpful for academics and professionals in Latin America, given the need to understand how safety can be improved.
The remainder of this article is organized as follows. Previous research related to SBS application and validation is presented in Section 2. The materials and statistical procedures for the data analysis are described in Section 3. Subsequently, results regarding construct validity, reliability and measurement equivalence will be discussed in Section 4. Finally, the main findings, limitations, strengths and conclusions of this study are presented in Sections 5 and 6.
2. Literature review
Safety behavior can be defined as individuals’ actions to promote and comply with policies [Citation12], operational specifications [Citation20], routines [Citation21] or regulations [Citation22] related to safety in the workplace to avoid physical threats or harm [Citation23] or workplace accidents [Citation24]. A significant number of studies have associated safety behavior with different constructs, e.g., safety climate [Citation14,Citation21,Citation25], safety culture [Citation26], leadership [Citation27,Citation28], organizational commitment [Citation29,Citation30], physical and mental health [Citation31,Citation32], use of technology and psychological empowerment [Citation33], and social and psychological capital [Citation34–37].
The framework developed by Neal et al. [Citation14], one of the most commonly used frameworks in the literature on safety behavior, links safety climate with safety behavior by person-related factors such as safety motivation and knowledge. Griffin and Neal [Citation38,p.348] stated that ‘work behaviors relevant to safety can be conceptualized in the same way as other work behaviors that constitute work performance’, providing a basis for analyzing the impact of employees’ behaviors on organizational safety outcomes such as accidents and injury rates [Citation39]. According to Neal et al. [Citation14], safety behavior comprises two dimensions: safety compliance and safety participation. Safety compliance refers to the core activities individuals need to maintain workplace safety. These behaviors include adhering to standard work procedures and wearing personal protective equipment (PEE). Safety participation describes behaviors that do not directly contribute to an individual's safety but help develop an environment that supports safety. These behaviors include participation in voluntary safety activities, helping co-workers with safety-related issues and attending safety meetings.
The SBS has been used in different contexts, e.g., construction [Citation5,Citation6,Citation34,Citation35,Citation40–43], manufacturing [Citation44], oil and gas [Citation31,Citation32,Citation45], mining [Citation25,Citation33,Citation46], aviation [Citation21,Citation47], healthcare [Citation30,Citation48,Citation49], agriculture [Citation50], hospitality and accommodation services [Citation51], transportation [Citation52] and petrochemical [Citation53] industries. In addition, some scholars have analyzed its relationship with other variables in different populations, e.g., firefighters [Citation28,Citation29] and heavy-industry blue-collar workers [Citation54].
Previous studies have analyzed the SBS and provided evidence of its psychometric properties. On the one hand, several studies found better goodness-of-fit indices when the dimensions of safety behavior were specified as first-order constructs [Citation6,Citation27,Citation47,Citation48,Citation51]. On the other hand, some scholars have specified safety behavior as a second-order construct [Citation21,Citation46], while others have considered it as a unidimensional construct [Citation25,Citation40,Citation55,Citation56].
This instrument has been translated into different languages, e.g., Chinese [Citation5,Citation21,Citation23,Citation25,Citation41,Citation46,Citation48,Citation51], German [Citation57], Italian [Citation54,Citation58], Malay [Citation37], Persian [Citation59], Thai [Citation47], Turkish [Citation49] and Spanish [Citation60]. Several studies have evaluated the validity and reliability of the SBS using confirmatory factor analysis (CFA). The psychometric properties of the different translations and adaptations of the SBS are briefly discussed in the following.
The Chinese version reported appropriate reliability and model-fit values across different populations [Citation21,Citation23,Citation36,Citation46,Citation48]. Regarding the Persian version, Kalteh et al. [Citation59] translated the original English scale and adapted it for the Persian petrochemical industry context. Their results confirmed the instrument's internal validity and supported its two first-order factor structures, as proposed by Neal et al. [Citation14]. Heier et al. [Citation57] translated the original scale and proposed a German version that was adapted for healthcare professionals. This study conducted exploratory factor analysis (EFA) and CFA to evaluate the instrument's validity and reliability. Their results confirmed that both safety behavior dimensions had adequate reliability, and convergent and discriminant validity. Similar results were obtained by Toderi et al. [Citation58] when developing the Italian version with construction and logistics workers, Uzuntarla et al. [Citation49] with the Turkish version adapted for healthcare professionals, Maneechaeye and Potipiroon [Citation47] with the Thai version for civilian pilots and Saleem et al. [Citation37] with the Malay version for construction workers.
Martínez-Córcoles et al. [Citation60] proposed a Spanish version adapted for nuclear power plant workers in Spain. In this study, safety behavior was conceptualized as a three-factor construct that included both the dimensions proposed by Neal et al. [Citation14] and risky behavior. According to their results, the safety participation and compliance dimensions showed good reliability values, and the hypothesized model had adequate goodness-of-fit indices. Although this study offers a translation of the SBS into Spanish, there is no evidence of cross-cultural measurement equivalence in Latin American countries. Furthermore, the context of the mining industry in Latin America implies great challenges in the implementation of occupational safety standards, which could affect how miners across the region understand constructs related to work safety. In this sense, a report on the state of the mining industry in Latin America and the Caribbean, in the Economic Commission for Latin America and in the Caribbean [Citation61] emphasizes that, due to the level of industrialization in the region, great risks persist not only at the environmental level, but also for people dedicated to this activity. Therefore, proposing an instrument that can be applied directly in the Latin American context would allow for more accurate measures of safety behavior.
To the best of our knowledge, only one study has evaluated the MI of the SBS. Barbaranelli et al. [Citation62] conducted a cross-cultural validation using the English and Italian versions of the instrument. Their findings support the existence of configural, metric and scalar invariance between American and Italian workers from hospitality, healthcare, manufacturing, food processing, mining, pulp and paper milling, and transportation organizations. These results suggest that despite socio-cultural differences between the two countries, they share the same fundamental view of safety behavior. Table summarizes the findings of several studies that have evaluated the psychometric properties of the SBS across different countries and industries.
Table 1. Findings of selected studies about the psychometric properties of the SBS.
Based on the aforementioned findings, this study had two objectives. The first was to examine and validate the dimensionality of the SBS in the mining industry of a Latin American country to determine whether Neil, Griffin and Hart's questionnaire measures safety behavior reliably and validly. The second was to evaluate the MI of the SBS among different groups classified by age, type of contract and firm size, which has not been analyzed in previous studies. Therefore, this study aims to fill these gaps in the literature on workplace safety and provide a helpful instrument for measuring safety behavior in the region.
3. Materials and methods
3.1. Participants and data collection procedure
The study design was cross-sectional. The sample was incidental and comprised participants from three mining companies located in the province of Azuay, Ecuador. Data collection was performed in participants’ workplaces. All participants were informed about the purpose and scope of the study, ensuring their anonymity and confidentiality. The questionnaire required approximately 20 min to complete. A total of 517 surveys were delivered and 450 surveys were completed by the participants. The response rate was 87%. The final sample for data analysis consisted of 398 valid surveys after removing 47 questionnaires with missing data and five questionnaires that were detected as multivariate outliers using Mahalanobis distance statistics. Of the participants, 99.25% were male. Their average age was 28.91 years (SD 11.27) and ranged between 18 and 67 years. In general, 25.38% of the respondents were permanent employees and 74.62% were contractors, while 91.46% worked in operational roles and 8.54% worked in supervisory positions.
3.2. Measures
Neal et al.'s [Citation14] scale was used to measure safety behavior. This instrument comprises eight items grouped into two dimensions: safety participation and safety compliance. Items were measured on a 5-point Likert scale ranging from 1 = strongly disagree to 5 = strongly agree. Some examples of items are ‘I help my co-workers when they are working under risky or hazardous conditions’ (safety participation) and ‘I use the correct safety procedures for carrying out my job’ (safety compliance). The questionnaire was translated from English to Spanish following a back-translation process. Two translators translated the English into Spanish. A third translator back-translated the resulting version into English to check whether it reflected the original wording. The resulting Spanish items are shown in Appendix 1.
3.3. Data analysis
Before analyzing the latent factor structure of the SBS, the dataset was screened to identify potential issues (e.g., outliers and distributional characteristics). The Mahalanobis-squared distance (D2) [Citation64] was used to determine the multivariate outliers. The normality of the dataset was evaluated by inspecting the skewness and kurtosis and using the Kolmogorov–Smirnov test with Lilliefors significance correction normality test. These analyses were conducted using AMOS version 24.0.
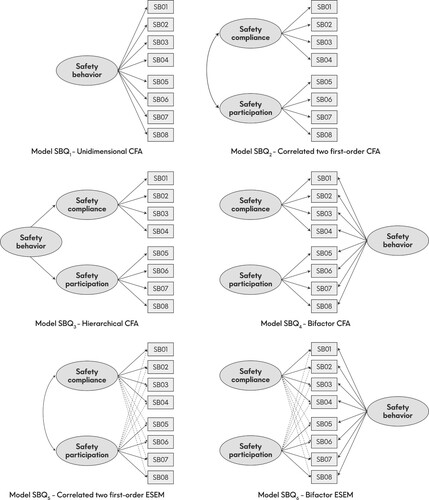
After removing multivariate outliers and identifying the distributional characteristics of the dataset, the latent structure of the SBS was analyzed using a series of CFA and exploratory equation modeling (ESEM) specifications to test potential factorial structures with different assumptions [Citation65,Citation66] and assess the instrument's psychometric properties. For example, under the CFA model approach, cross-loadings are constrained to zero. However, ESEM relaxes CFA assumptions and allows items to cross-load on non-target factors. Specifically, four CFA and two ESEM models were estimated to determine the factorial structure of the SBS: model SBQ1, a unidimensional CFA model representing a general measure of safety behavior; model SBQ2, a correlated two first-order factor CFA model comprising safety compliance and safety participation dimensions; model SBQ3, a hierarchical CFA model incorporating a single second-order factor of safety behavior comprising two first-order factors (safety compliance and safety participation dimensions); model SBQ4, a bifactor CFA model of safety behavior; model SBQ5, a correlated two first-order factor ESEM model comprising safety compliance and safety participation dimensions; and model SBQ6, a bifactor ESEM model of safety behavior. Figure shows a representation of each model.
Figure 1. Graphical representation of the CFA and ESEM factorial structures of the SBS tested in this study. Note: CFA = confirmatory factor analysis; ESEM = exploratory structural equation modeling; SBS = safety behavior scale.
All CFA and ESEM models were estimated using the maximum likelihood robust (MLR) estimator [Citation67]. The MLR estimator was selected for the following reasons: first, although the weighted least squares mean and variance adjusted (WLSMV) estimator is usually preferred with ordered categorical observed variables, it assumes the normal distribution of the underlying latent factors; however, the MLR estimator is less dependent on the assumption of multivariate normal distribution [Citation68]. Second, a maximum likelihood approach is a favored option when the items have five or more response options [Citation69]. Third, the MLR estimator outperforms the WLSMV estimator when testing the MI of five-option items because the WLSMV estimator results in higher error rates (both type I and type II) in these analyses, while the MLR estimator keeps them within acceptable ranges [Citation70]. Fourth, MLR estimates allow for the use of ΔCFI, an effect size usually used in MI analyses, which is not possible for WLSMV estimates [Citation70]. Latent variable modeling was implemented using Mplus version 6.12.
The goodness of fit was evaluated using the following indices: comparative fit index (CFI), Tucker–Lewis index (TLI), root mean square error of approximation (rmsea), standardized root mean square residual (SRMR), Akaike information criterion (AIC), Bayes information criterion (BIC) and sample-size adjusted BIC (SSA-BIC). Once each model was estimated, goodness-of-fit indices and measurement quality were evaluated. First, both analyses were performed individually for each model. Subsequently, the retained models were compared to each other to determine the best-fitting specification of the factorial structure of the SBS. When comparing the model fit indices, a CFI/TLI decrease higher than 0.01 and an rmsea/SRMR increase higher than or equal to 0.015 indicated a significant decrement in model goodness of fit. The measurement quality assessment involved the inspection of standardized factor loadings (i.e., strong loadings on expected latent factors), item uniqueness (preferably higher than 0.10, but less than 0.90), factor loading standard errors (preferably less than 0.04), factor correlations (in SBQ2 and SBQ5) and cross-loadings in ESEM models [Citation71]. If the differences were non-significant during the model comparison, the most parsimonious and theory-based model was retained for subsequent analyses [Citation72,Citation73].
Internal consistency was evaluated using McDonald's ω coefficient estimates [Citation74] instead of Cronbach's α coefficient [Citation75] to avoid underestimating reliability when there is considerable variation in factor loadings [Citation76–78].
Discriminant validity was tested using the Fornell–Larcker criterion [Citation79] and a modified version of the heterotrait–monotrait (HTMT) ratio of correlations [Citation80,Citation81]. The Fornell–Larcker criterion suggests that the square root of the average variance extracted (AVE) value of each latent variable should be higher than its correlation with other variables included in the model. The original version of the HTMT ratio developed by Henseler et al. [Citation82] relies on the assumption of tau-equivalent measurement models, resulting in a biased estimation of the correlations among the latent variables. However, the HTMT2 ratio relaxes the tau-equivalence assumption and provides more consistent estimates for congeneric measurement models [Citation81]. HTMT2 was calculated considering the geometric mean of the item's correlations between different factors relative to the square root of the geometric mean of the item's correlations within the same factor. Values below 0.85 were considered an indicator of sufficient discriminant validity.
Once the specification that best represented the factorial structure of the SBS was determined, MI was assessed using multigroup analysis with progressively restrictive nested models [Citation83,Citation84]. Three MI analyses were conducted considering participants’ type of contract, age and firm size. Each group's factorial structure is equivalent if a full MI is demonstrated. Nevertheless, if full MI cannot be established, some parameters can be allowed to vary across groups to test for partial invariance [Citation85,Citation86].
A configural invariance test was conducted to determine a baseline model across groups (model M1), allowing all parameters to be estimated freely. Then, metric invariance (also called ‘weak invariance’) was evaluated by constraining all factor loadings to be equal across groups to validate whether items were interpreted equally (model M2). Next, scalar (strong) invariance was tested by constraining factor loadings and intercepts to be the same across groups (model M3). Finally, a uniqueness (strict) invariance test is conducted (model M4). Invariance among the different successive models was tested considering the CFI (ΔCFI) and rmsea (Δrmsea) indices because the chi-square difference test is sensitive to non-normality and sample size. These analyses considered the cutoffs recommended by Cheung and Rensvold [Citation87] and Chen [Citation88], where a CFI decrease of >0.01 and an rmsea increase of ≥0.015 indicated a significant decrement in model goodness of fit and lack of invariance across groups.
4. Results
4.1. Item analysis
Table presents the item characteristics of the overall sample (N = 398). The mean values of the SBS items that comprise the safety compliance dimension ranged from 4.56 (SD 0.81) to 4.72 (SD 0.70), and from 4.23 (SD 0.83) to 4.68 (SD 0.62) for the items that constitute the safety participation dimension. The distributional properties of each item were examined by inspecting skewness and kurtosis. The univariate skewness values ranged from −2.96 to −2.10 for the safety compliance dimension and from −2.39 to −0.81 for the safety participation dimension. The univariate kurtosis values ranged from 5.02 to 9.73 for the safety compliance dimension and from 0.26 to 7.49 for the safety participation dimension. These results suggest that some items deviated from the normal distribution. In addition, the Kolmogorov–Smirnov test of normality revealed that each item had a distribution that was significantly different from normal. Based on this evidence, estimation procedures that assume a normal distribution may not be adequate to examine the underlying factorial structure of the SBS [Citation89,Citation90]. Consequently, the MLR estimator was applied to estimate the CFA and ESEM models described in Section 3.3.
Table 2. Descriptive statistics for the SBS items (N = 398).
4.2. Descriptive analysis
Table presents the means and standard deviations of the SBS dimensions for the overall sample and subsamples grouped by age, type of contract and firm size. Scores were calculated by summing the scores for those items that comprise each dimension and dividing them by the number of items (higher scores represent higher safety compliance and participation, respectively). Participants reported high scores in all safety behavior dimensions; nevertheless, some heterogeneity arose when comparing groups. In the case of young adults (age ≤ 35 years; n = 276), their scores were lower than those of middle-aged adults (age >35 years; n = 122) in both dimensions of safety behavior. Also, the permanent employees (n = 297) scored higher than contractors (n = 101) in both dimensions. Finally, in both dimensions, participants from firms with more than 500 workers (n = 223) scored higher than those from firms with fewer than 500 workers (n = 175).
Table 3. Means and standard deviations of the SBS dimensions for the overall sample and groups.
4.3. Validation of the Neal, Griffin and Hart safety behavior scale
4.3.1. Constructing the multidimensionality of the SBS
Table presents the goodness-of-fit indices for the different specifications evaluated using the overall sample (N = 398). According to the results, models SBQ1 (unidimensional CFA) and SBQ3 (hierarchical CFA) did not present an acceptable fit to the data; thus, they were not considered for further analysis. Models SBQ2 (correlated two first-order factor CFA), SBQ4 (bifactor CFA) and SBQ5 (correlated two first-order factor ESEM) exceeded the thresholds for the cutoff values of the established goodness-of-fit indices (CFI and TLI > 0.95; rmsea and SRMR < 0.05). Model SBQ6 (bifactor CFA) converged, but the error variance of item SB04 was negative, even after being constrained to be positive and close to zero. Consequently, models SBQ2, SBQ4 and SBQ5 were retained and compared to determine whether there was a significant difference in their goodness-of-fit and measurement quality, enough to prefer one model over another.
Table 4. Model fit of the estimated CFA and ESEM measurement models as estimated for the overall sample.
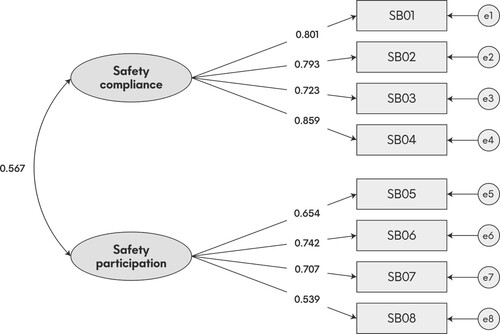
As presented in Table , differences in the model fit indices were not significant (ΔCFI, ΔTLI < 0.01; Δrmsea, ΔSRMR < 0.015). Regarding the measurement quality of each model, we first compared the SBQ2 and SBQ5 models. The factor loadings in model SBQ2 were statistically significant (p < 0.001) and ranged from 0.723 to 0.859 (Mλ = 0.794) in the safety compliance dimension, and from 0.539 to 0.742 (Mλ = 0.661) in the safety participation dimension. Similar results were observed when analyzing the target factor loadings in the model SBQ5. The target factor loadings in the safety compliance dimension ranged from 0.717 to 0.860 (Mλ = 0.794), and from 0.651 to 0.728 (Mλ = 0.683) in the safety participation dimension. In addition, it is worth noting that the cross-loadings in SBQ5 were very close to zero (λ < 0.05) and non-significant for both factors. The size of the factor correlation was moderate and similar in the SBQ2 (r = 0.567) and SBQ5 (r = 0.534) models. Thus, for the following reasons, model SBQ5 was discarded for further analyses: there was no difference in model fit between SBQ2 and SBQ5; incorporating cross-loadings did not affect target factor loadings significantly; the observed reduction in factor correlations (Δr = 0.033) when comparing SBQ2 and SBQ5 was not significant; and model SBQ2 was more parsimonious.
Table 5. Results of the retained CFA and ESEM measurement models comparison.
Subsequently, the retained CFA models (SBQ2 and SBQ4) were compared to determine the best-fit specification. No difference in model fit was found when comparing SBQ4 and SBQ2 (ΔCFI = 0.004; ΔTLI = 0.005; Δrmsea, ΔSRMR =−0.009). Regarding measurement quality, all factor loadings in model SBQ2 were statistically significant (p < 0.001). In model SBQ4 (bifactor CFA), the general factor was well-defined. All factor loadings in the general factor were significant and ranged from 0.290 to 0.836 (Mλ = 0.590), with the factor loadings of items SB01–SB04 (Mλ = 0.805) compared to items SB05–SB08 (Mλ = 0.375). However, the items did not load as expected for specific factors. In the safety compliance dimension, items SB01 and SB02 showed significant factor loadings (λSB01 = 0.522, p < 0.001; λSB02 = 0.256, p < 0.001), whereas items SB03 and SB04 did not load significantly (λSB03 = −0.092, p > 0.05; λSB04 = 0.000, p > 0.05). All factor loadings were significant (p < 0.001) in the safety participation dimension. It is important to mention that, on average, specific-factor loadings in model SBQ4 were 0.30 lower than in the SBQ2 model. In addition, the factor loading standard errors were lower in SBQ2 (SESC = 0.047; SESP = 0.058) than in SBQ4 (SESC = 0.113; SESP = 0.068). Hence, based on the aforementioned results and the theoretical framework proposed by Neal et al. [Citation14], model SBQ2 was selected as the best-fitting factorial structure of the SBS and the base for subsequent analyses. Figure shows the model SBQ2, as estimated for the overall sample.
Figure 2. Correlated two first-order factor CFA representation of the SBS as estimated for the overall sample (N = 398). Note: CFA = confirmatory factor analysis; SBS = safety behavior scale.
An adequate fit to the data and measurement quality was observed when estimating model SBQ2 in each subsample by age, contract type and firm size. Table summarizes the model fit indices. Although the goodness-of-fit indices were adequate when using both the overall sample and each subsample, it is worth mentioning that rmsea estimates are sensitive to sample size. This index tends to be upward biased [Citation91] and indicates a poor fit to the data when using small samples (N < 200) [Citation92–94]. Therefore, it is recommended to evaluate the goodness of fit with different indices and support the findings with an underlying theoretical framework [Citation93].
Table 6. Model fit indices of model SBQ2 as estimated by age, type of contract and firm size subsamples.
All factor loadings for model SBQ2, as estimated in each subsample, were statistically significant (p < 0.001) and sufficiently strong to ensure adequate levels of internal consistency [Citation95]. Regarding the safety compliance dimension, the factor-loading estimates were as follows: young adults (0.719–0.856, Mλ = 0.794), middle-aged adults (0.679–0.879, Mλ = 0.775), permanent employees (0.690–0.793, Mλ = 0.746), contractors (0.749–0.930, Mλ = 0.825), firms with fewer than 500 workers (0.773–0.891, Mλ = 0.828) and firms with more than 500 workers (0.628–0.841, Mλ = 0.772). Concerning the safety participation dimension, the factor loadings were as follows: young adults (0.590–0.837, Mλ = 0.739), middle-aged adults (0.533–0.699, Mλ = 0.614), permanent employees (0.588–0.643, Mλ = 0.611), contractors (0.570–0.920, Mλ =0.782), firms with fewer than 500 workers (0.678–0.917, Mλ = 0.978) and firms with more than 500 workers (0.548–0.678, Mλ = 0.608).
4.3.2. Reliability
Internal consistency was evaluated based on McDonald's ω composite reliability coefficient [Citation74] instead of Cronbach's α coefficient [Citation75] to avoid underestimating reliability when there is considerable variation in factor loadings [Citation76–78]. For the overall sample, the ω value was 0.873 for the safety compliance dimension, and 0.781 for the safety participation dimension. Table presents the ω estimates for each subsample. These estimates suggest that both dimensions of safety behavior have appropriate measurement properties [Citation79,Citation95].
Table 7. Reliability and AVE estimates of the safety behavior dimensions.
4.3.3. Convergent and discriminant validity
Convergent validity was evaluated using the Fornell–Larcker [Citation79] criterion. The AVE values for the safety compliance and safety participation dimensions were 0.633 and 0.472, respectively, when estimating SBQ2 using the overall sample, which ensured adequate convergent validity. Table presents the AVE values for each subsample. Even though the AVE values were lower than 0.50, in some subsamples McDonald's ω estimates allowed us to argue that there was an adequate level of convergent validity [Citation79]. Regarding discriminant validity, the square root of AVE values for the safety compliance and participation dimensions was higher than the correlation between both factors. When testing discriminant validity using the HTMT approach [Citation80,Citation81], the correlation ratio was 0.530, indicating that neither dimension overlapped. Similar discriminant validity results are obtained using subsamples based on age, contract type and firm size.
4.4. Measurement invariance of the Neal, Griffin and Hart safety behavior scale
The results of MI analysis are presented in Table . The models for testing MI by age-supported configural, weak and strong invariance given that the Δ changes in CFI, TLI and RMSEA were insignificant. However, the variation in the goodness-of-fit indices when comparing model M4 to model M3 did not support the hypothesis of full, strict invariance. After checking the modification indices, model M4a relaxes the constraints on the uniqueness of SB01, SB03, SB05 and SB08. Partial strict invariance was achieved by allowing the parameters to be estimated freely [Citation86].Footnote1
Table 8. Results of the MI analysis results by age, type of contract, and firm size.
Similarly, when testing MI by age, the results supported configural, weak and strong invariances. Fully strict invariance was not supported. The modification indices suggest that the uniqueness of SB02, SB03, SB05 and SB08 should be estimated freely. Hence, model M4a supported partial strict invariance. Finally, configural and weak invariances were confirmed when testing MI by firm size. However, a strong and strict invariance could not be achieved. Partial strong invariance was supported by allowing the intercept of item SB08 to be freely estimated. In addition, model M4a relaxed the constraint on the uniqueness of SB03, indicating the presence of partial strict invariance. Given that full (or at least partial) strong invariance was achieved in each MI analysis [Citation96,Citation97], the latent means of both dimensions of safety behavior were compared.
4.5. Testing for latent mean differences
Potential latent mean differences were explored after determining full (or at least partial) strong invariance across subsamples grouped by age, type of contract and firm size. The latent means of both dimensions of safety behavior were constrained to zero for the following subsamples, serving as the reference groups: young adults, contractors and firms with fewer than 500 workers. The mean of the other groups (middle-aged adults, permanent employees and employees in firms with more than 500 workers) was freely estimated. The decision of which group to constrain was arbitrary and did not influence the final estimated mean values [Citation98].
According to the results, statistically significant differences were found in the safety compliance dimension when comparing by age (standardized mean difference = 0.501, p = 0.016; Cohen's d = 0.331) and type of contract (standardized mean difference = 0.671, p = 0.006; Cohen's d = 0.501). These values suggest that middle-aged adults and permanent employees scored higher on this dimension than young adults and contractors. Regarding the safety participation dimension, statistically significant differences were found when comparing age (standardized mean difference = 0.718, p < 0.001; Cohen's d = 0.391), type of contract (standardized mean difference = 0.484, p = 0.045; Cohen's d = 0.347) and firm size (standardized mean difference = 0.337, p = 0.041; Cohen's d = 0.143). Higher scores were reported by middle-aged adults, permanent employees and employees in firms with more than 500 workers.
5. Discussion
The main objective of this study is to validate and evaluate the MI of the SBS developed by Neal et al. [Citation14] in the mining industry of a Latin American country. Although this instrument has been widely used in safety research across different countries and industries, no validated Spanish version has been adapted to the Latin American context. The results of this study allowed us to draw three important conclusions: first, using confirmatory methods, the data supported that the SBS is a reliable and valid measure of safety behavior in the Ecuadorian mining industry. Second, the SBS has two first-order factorial structures that include safety compliance and participation dimensions. Third, the results provide robust evidence about the MI of the SBS when tested by age, type of contract and firm size.
The findings of this study support the theoretical framework developed by Neal et al. [Citation14] on safety behavior and its components. The Spanish version of the SBS proposed in this study showed satisfactory construct validity. Following Neal et al. [Citation14] and previous findings [Citation5,Citation21,Citation23,Citation28,Citation46,Citation49,Citation58,Citation59], a series of CFA and ESEM specifications was tested to determine the best-fitting representation of the SBS. Although the two correlated first-order factor CFA and ESEM models (SBQ2 and SBQ5, respectively) and the bifactor CFA specification (SBQ4) showed an adequate fit to the data, model SBQ2 presented better measurement quality. This result is consistent with that of other studies [Citation6,Citation27,Citation47,Citation48,Citation51].
Regarding internal consistency, McDonald's ω coefficient estimates supported an adequate level of reliability [Citation79,Citation95], similar to those reported in previous studies [Citation25,Citation40]. Additionally, both dimensions showed appropriate convergent validity. These findings are consistent with those of previous studies [Citation5,Citation25,Citation30,Citation36,Citation37,Citation40,Citation47]. Discriminant validity was confirmed in the proposed Spanish version, as in other translations of the instrument, e.g., Italian [Citation58], Chinese [Citation5,Citation23,Citation36], German [Citation57] and Malay [Citation37]. This implies that the surveyed mining workers distinguished between two types of behaviors: mandatory (safety compliance) and voluntary or extra-role (safety participation). The size of the correlation between both dimensions of safety behavior was moderate, in agreement with other studies [Citation5,Citation28,Citation30,Citation36,Citation51,Citation54,Citation57,Citation58,Citation60]. In addition, it is worth noting that both factors conserved four items as in the original version by Neal et al. [Citation14]; thus, the evidence provided in this study supported the use of the eight-item version of the SBS [Citation42,Citation54,Citation59].
MI testing for the SBS has been conducted in a cross-cultural context [Citation62]; nevertheless, MI across different groups (e.g., by age, type of contract or firm size) in the mining industry of a Latin American country has not been evaluated before. According to the results, configural, weak, strong and strict invariances were supported. Although some differences in the goodness-of-fit indices were found between the unconstrained model and the subsequent invariance models, the values of ΔCFI and Δrmsea were within the cutoff values proposed by Chen [Citation88] and Cheung and Rensvold [Citation87]. These findings suggest that the SBS is a reliable instrument for comparing safety performance between groups in the Latin American mining industry.
Overall, the results of this study provide robust evidence about the factor structure, validity, reliability and MI of the SBS in the Latin American context, since there is increasing interest in understanding safety behavior and its impact and relevance in the workplace. However, this study has some limitations. The participants in our study were mainly male; therefore, gender effects could not be evaluated. In addition, future studies should examine the measurement equivalence of the SBS across different Latin American countries since the mining industry output is higher in other Spanish-speaking countries, e.g., Chile and Peru, given automatization, technology or innovation levels [Citation99]. Additionally, the psychometric properties of the SBS should be evaluated in other industries to test its stability in different contexts. Finally, given that current regulations or innovations could influence safety behavior, the validation of this type of instrument should be updated regularly.
The present study has some strengths, as it provides evidence of factorial validity and MI of the Spanish version of the SBS in the mining industry context in a Latin American country. The translation and validation of the SBS carried out in this study enhance opportunities for obtaining more accurate measures of safety behavior in the region, fostering future research on this topic to better understand the issues in our countries and to guide interventions to reduce negative safety outcomes. In this sense, our results fill gaps in the existing literature regarding the MI of this instrument, thereby improving future safety and psychological research in the region. Additionally, the Spanish version of the SBS used in this study provides opportunities for cross-cultural comparisons and benchmarking, which might be especially insightful for companies operating in different corners of the region.
6. Conclusion
This study found robust evidence for the construct validity, reliability and MI of the SBS in the mining industry of a Latin American country. Additionally, a validated Spanish version of the SBS was provided to improve opportunities for future research in this region.
Acknowledgements
Informed consent was obtained from all participants involved in the study. The study was conducted according to the guidelines of the Declaration of Helsinki and approved by the Research Committee of ESPAE Graduate School of Management (Approval code: PSICO-2015-04; 30 June 2015).
Data availability statement
The data presented in this study are available on request to the corresponding authors. The data are not publicly available due to privacy concerns.
Disclosure statement
No potential conflict of interest was reported by the authors.
Notes
1 According to Steenkamp and Baumgartner [86], partial invariance can be supported when the majority of ítems that comprise the latent variable are invariant.
References
- United Nations Global Compact & International Labour Organization. Nine business practices for improving safety and health through supply chains and building a culture of prevention and protection [Internet]. New York (NY): UN Global Compact & ILO; 2021 [cited 2022 Jun 26]. Available from: https://ungc-communications-assets.s3.amazonaws.com/docs/publications/OSH%20Brief_FINAL.pdf
- International Labour Organization. Statistics on safety and health at work. Geneva: ILO; 2021 [cited 2022 Jun 26]. Available from: https://ilostat.ilo.org/topics/safety-and-health-at-work/
- Labor Risk Insurance Office. Estadísticas del Seguro General de Riesgos del Trabajo [Labor risk insurance statistics]. Quito: Ecuadorian Social Security Institute; 2022 [cited 2022 Jun 26]. Spanish. Available from: https://www.iess.gob.ec/es/web/guest/20
- Christian MS, Bradley JC, Wallace JC, et al. Workplace safety: a meta-analysis of the roles of person and situation factors. J Appl Psychol. 2009;94(5):1103–1127. doi:10.1037/a0016172
- He C, McCabe B, Jia G, et al. Effects of safety climate and safety behavior on safety outcomes between supervisors and construction workers. J Constr Eng Manag. 2020;146(1):04019092. doi:10.1061/(ASCE)CO.1943-7862.0001735
- Lyu S, Hon CKH, Chan APC, et al. Relationships among safety climate, safety behavior, and safety outcomes for ethnic minority construction workers. Int J Environ Res Public Health. 2018;15(3):484. doi:10.3390/ijerph15030484
- Panuwatwanich K, Al-Haadir S, Stewart RA. Influence of safety motivation and climate on safety behaviour and outcomes: evidence from the Saudi Arabian construction industry. Int J Occup Saf Ergon. 2017;23(1):60–75. doi:10.1080/10803548.2016.1235424
- Cheyne A, Cox S, Oliver A, et al. Modelling safety climate in the prediction of levels of safety activity. Work Stress. 1998;12(3):255–271. doi:10.1080/02678379808256865
- Reber RA, Wallin JA, Chhokar JS. Improving safety performance with goal setting and feedback. Hum Perform. 1990;3(1):51–61. doi:10.1207/s15327043hup0301_4
- Hofmann DA, Stetzer A. A cross-level investigation of factors influencing unsafe behaviors and accidents. Pers Psychol. 1996;49(2):307–339. doi:10.1111/j.1744-6570.1996.tb01802.x
- Lingard H, Rowlinson S. Behavior-based safety management in Hong Kong’s construction industry. J Safety Res. 1997;28(4):243–256. doi:10.1016/S0022-4375(97)00010-8
- Burke MJ, Sarpy SA, Tesluk PE, et al. General safety performance: a test of a grounded theoretical model. Pers Psychol. 2002;55(2):429–457. doi:10.1111/j.1744-6570.2002.tb00116.x
- Hayes BE, Perander J, Smecko T, et al. Measuring perceptions of workplace safety: development and validation of the work safety scale. J Safety Res. 1998;29(3):145–161. doi:10.1016/S0022-4375(98)00011-5
- Neal A, Griffin MA, Hart PM. The impact of organizational climate on safety climate and individual behavior. Saf Sci. 2000;34(1-3):99–109. doi:10.1016/S0925-7535(00)00008-4
- Borman WC, Motowidlo SJ. Expanding the criterion domain to include elements of contextual performance. In: Schmitt N, Borman WC, editors. Personnel selection in organizations. San Francisco (CA): Jossey-Bass; 1993. p. 71–98.
- Campbell JP, McCloy RA, Oppler SH, et al. A theory of performance. In: Schmitt N, Borman WC, editors. Personnel selection in organizations. San Francisco (CA): Jossey-Bass; 1993. p. 35–70.
- Clarke S. Safety leadership: a meta-analytic review of transformational and transactional leadership styles as antecedents of safety behaviours. J Occup Organ Psychol. 2013;86(1):22–49. doi:10.1111/j.2044-8325.2012.02064.x
- Lyubykh Z, Turner N, Hershcovis MS, et al. A meta-analysis of leadership and workplace safety: examining relative importance, contextual contingencies, and methodological moderators. J Appl Psychol. 2022 [cited 2022 Oct 20]. doi:10.1037/apl0000557.
- Hu B, Guo H, Zhou P, et al. Characteristics of SARS-CoV-2 and COVID-19. Nat Rev Microbiol. 2021;19(3):141–154. doi:10.1038/s41579-020-00459-7
- Fugas CS, Silva SA, Meliá JL. Another look at safety climate and safety behavior: deepening the cognitive and social mediator mechanisms. Accid Anal Prev. 2012;45:468–477. doi:10.1016/j.aap.2011.08.013
- Xu Q, Wu Y, Wang M, et al. The relationship between sense of calling and safety behavior among airline pilots: the role of harmonious safety passion and safety climate. Saf Sci. 2022;150:105718. doi:10.1016/j.ssci.2022.105718
- Zhou Z, Goh Y, Li Q. Overview and analysis of safety management studies in the construction industry. Saf Sci. 2015;72:337–350. doi:10.1016/j.ssci.2014.10.006
- Liu Y, Wang X, Wang D. How leaders and c-workers affect construction workers’ safety behavior: an integrative perspective. J Constr Eng Manag. 2021;147(12):04021176. doi:10.1061/(ASCE)CO.1943-7862.0002215
- Zin SM, Ismail F. Employers’ behavioural safety compliance factors toward occupational, safety and health improvement in the construction industry. Procedia Soc Behav Sci. 2012;36:742–751. doi:10.1016/j.sbspro.2012.03.081
- Yu M, Qin W, Li J. The influence of psychosocial safety climate on miners’ safety behavior: a cross-level research. Saf Sci. 2022;150:105719. doi:10.1016/j.ssci.2022.105719
- Al-Bayati AJ. Impact of construction safety culture and construction safety climate on safety behavior and safety motivation. Safety. 2021;7(2):41–54. doi:10.3390/safety7020041
- Fruhen LS, Andrei DM, Griffin MA. Leaders as motivators and meaning makers: how perceived leader behaviors and leader safety commitment attributions shape employees’ safety behaviors. Saf Sci. 2022;152:105775. doi:10.1016/j.ssci.2022.105775
- Smith TD, Eldridge F, DeJoy DM. Safety-specific transformational and passive leadership influences on firefighter safety climate perceptions and safety behavior outcomes. Saf Sci. 2016;86:92–97. doi:10.1016/j.ssci.2016.02.019
- Smith TD. Examination of safety climate, affective organizational commitment, and safety behavior outcomes among fire service personnel. Disaster Med Public Health Prep. 2019;14(5):559–562. doi:10.1017/dmp.2019.117
- Mashi MS, Subramaniam C, Johari J. The effect of management commitment to safety, and safety communication and feedback on safety behavior of nurses: the moderating role of consideration of future safety consequences. Int J Hum Resour Manag. 2018;31(20):2565–2594. doi:10.1080/09585192.2018.1454491
- Alroomi AS, Mohamed S. Does fatigue mediate the relation between physical isolation and safety behaviour among isolated oil and gas workers? Saf Sci. 2022;147:105639. doi:10.1016/j.ssci.2021.105639
- Alroomi AS, Mohamed S. Physical isolation and safety behaviour among oil and gas workers in Kuwait: the mediating role of mental health. J Loss Prev Process Ind. 2022;75:104692. doi:10.1016/j.jlp.2021.104692
- Ochoa Pacheco P, Cunha MPE, Abrantes ACM. The impact of empowerment and technology on safety behavior: evidence from mining companies. Int J Occup Saf Ergon. 2022;28(1):581–589. doi:10.1080/10803548.2020.1808343
- Li S, Fan M, Wu X. Effect of social capital between construction supervisors and workers on workers’ safety behavior. J Constr Eng Manag. 2018;144(4):04018014. doi:10.1061/(ASCE)CO.1943-7862.0001467
- Li S, Wu X, Wang X, et al. Relationship between social capital, safety competency, and safety behaviors of construction workers. J Constr Eng Manag. 2020;146(6):04020059. doi:10.1061/(ASCE)CO.1943-7862.0001838
- He C, McCabe B, Jia G. Effect of leader–member exchange on construction worker safety behavior: safety climate and psychological capital as the mediators. Saf Sci. 2021;142:105401. doi:10.1016/j.ssci.2021.105401
- Saleem MS, Isha A, Yusop YM, et al. The role of psychological capital and work engagement in enhancing construction workers’ safety behavior. Front Public Health. 2022;10:810145. doi:10.3389/fpubh.2022.810145
- Griffin MA, Neal A. Perceptions of safety at work: a framework for linking safety climate to safety performance, knowledge, and motivation. J Occup Health Psychol. 2000;5(3):347–358. doi:10.1037/1076-8998.5.3.347
- Neal A, Griffin MA. A study of the lagged relationships among safety climate, safety motivation, safety behavior, and accidents at the individual and group levels. J Appl Psychol. 2006;91(4):946–953. doi:10.1037/0021-9010.91.4.946
- Newaz MT, Davis P, Jefferies M, et al. The psychological contract: a missing link between safety climate and safety behaviour on construction sites. Saf Sci. 2019;112:9–17. doi:10.1016/j.ssci.2018.10.002
- Xia N, Tang Y, Li D, et al. Safety behavior among construction workers: influences of personality and leadership. J Constr Eng Manag. 2021;147(4):04021019. doi:10.1061/(ASCE)CO.1943-7862.0002023
- Jung M, Lim S, Chi S. Impact of work environment and occupational stress on safety behavior of individual construction workers. Int J Environ Res Public Health. 2020;17(22):8304. doi:10.3390/ijerph17228304
- Zhang RP, Lingard H, Oswald D. Impact of supervisory safety communication on safety climate and behavior in construction workgroups. J Constr Eng Manag. 2020;146(8):04020089. doi:10.1061/(ASCE)CO.1943-7862.0001881
- Liu Q, Ye G, Feng Y. Workers’ safety behaviors in the off-site manufacturing plant. Eng Constr Archit Manag. 2019;27(3):765–784. doi:10.1108/ECAM-03-2019-0136
- Wang D, Zong Z, Mao W, et al. Investigating the relationship between person–environment fit and safety behavior: a social cognition perspective. J Safety Res. 2021;79:100–109. doi:10.1016/j.jsr.2021.08.010
- Li Y, Wu X, Luo X, et al. Impact of safety attitude on the safety behavior of coal miners in China. Sustainability. 2019;11(22):6382. doi:10.3390/su11226382
- Maneechaeye P, Potipiroon W. The impact of fleet-level and organization-level safety climates on safety behavior among Thai civilian pilots: the role of safety motivation. Saf Sci. 2022;147:105614. doi:10.1016/j.ssci.2021.105614
- Wong KCK. Work support, psychological well-being and safety performance among nurses in Hong Kong. Psychol Health Med. 2018;23(8):958–963. doi:10.1080/13548506.2018.1437275
- Uzuntarla F, Kucukali S, Uzuntarla Y. An analysis on the relationship between safety awareness and safety behaviors of healthcare professionals, Ankara/Turkey. J Occup Health. 2020;62(1):e12129. doi:10.1002/1348-9585.12129
- Sprung JM, Britton AR. The dyadic context of safety: an examination of safety motivation, behavior, and life satisfaction among farm couples. Saf Sci. 2016;85:1–8. doi:10.1016/j.ssci.2016.01.001
- Wong KCK, Chan AKK. Work antecedents, psychological strain and safety behaviours among Chinese hotel employees. Saf Sci. 2020;129:104825. doi:10.1016/j.ssci.2020.104825
- Chu F, Guo M, Liu S, et al. Work–family conflict, personality, and safety behaviors among high-speed railway drivers. J Transp Saf Secur. 2020;12(9):1147–1163.
- Xue Y, Fan Y, Xie X. Relation between senior managers’ safety leadership and safety behavior in the Chinese petrochemical industry. J Loss Prev Process Ind. 2020;65:104142. doi:10.1016/j.jlp.2020.104142
- Brondino M, Bazzoli A, Pasini M. Safety climate agreement for a safer work environment: a multilevel mediation analysis of the relationship between LMX and safety behaviors. TPM – Test Psychom Methodol Appl Psychol. 2020;27(3):361–382.
- Deng Y, Guo H, Meng M, et al. Exploring the effects of safety climate on worker’s safety behavior in subway operation. Sustainability. 2020;12(20):8310. doi:10.3390/su12208310
- Bayram M, Arpat B, Ozkan Y. Safety priority, safety rules, safety participation and safety behaviour: the mediating role of safety training. Int J Occup Saf Ergon. 2021 [cited 2022 Oct 20].doi:10.1080/10803548.2021.1959131.
- Heier L, Gambashidze N, Hammerschmidt J, et al. Safety performance of healthcare professionals: validation and use of the adapted workplace health and safety instrument. Int J Environ Res Public Health. 2021;18(15):7816. doi:10.3390/ijerph18157816
- Toderi S, Gaggia A, Mariani MG, et al. Griffin and Neal’s safety model: determinants and components of individual safety performance in the Italian context. Med Lav. 2015;106(6):447–459.
- Kalteh HO, Mortazavi SB, Mohammadi E, et al. Psychometric properties of the Persian version of Neal and Griffin’s safety performance scale. Int J Occup Saf Ergon. 2021;27(1):41–47. doi:10.1080/10803548.2018.1504853
- Martínez-Córcoles M, Gracia FJ, Tomás I, et al. Empowering team leadership and safety performance in nuclear power plants: a multilevel approach. Saf Sci. 2013;51(1):293–301. doi:10.1016/j.ssci.2012.08.001
- Economic Commission for Latin America and the Caribbean. Estado de situación de la minería en América Latina y el Caribe: desafíos y oportunidades para un desarrollo más sostenible [Status of mining in Latin America and the Caribbean: challenges and opportunities for a more sustainable development]. Lima: ECLAC; 2018 [2022 Jun 26]. Spanish. Available from: https://www.cepal.org/sites/default/files/presentation/files/181116_extendidafinalconferencia_a_los_ministros_mineria_lima.pdf
- Barbaranelli C, Petitta L, Probst TM. Does safety climate predict safety performance in Italy and the USA? Cross-cultural validation of a theoretical model of safety climate. Accid Anal Prev. 2015;77:35–44. doi:10.1016/j.aap.2015.01.012
- Yu X, Mehmood K, Paulsen N, et al. Why safety knowledge cannot be transferred directly to expected safety outcomes in construction workers: the moderating effect of physiological perceived control and mediating effect of safety behavior. J Constr Eng Manag. 2021;147(1):04020152. doi:10.1061/(ASCE)CO.1943-7862.0001965
- Mahalanobis PC. On the generalized distance in statistics. Proc Indian National Sci Acad. 1936;2:49–55.
- Brown TA. Confirmatory factor analysis for applied research. 2nd ed. New York (NY): Guilford Press; 2015.
- Morin AJ. Exploratory structural equation modeling. In: Hoyle H, editor. Handbook of structural equation modeling. 2nd ed. New York (NY): Guilford Press; Forthcoming 2023.
- Yuan KH, Bentler PM. Three likelihood-based methods for mean and covariance structure analysis with nonnormal missing data. Sociol Methodol. 2000;30(1):165–200. doi:10.1111/0081-1750.00078
- Li CH. Confirmatory factor analysis with ordinal data: comparing robust maximum likelihood and diagonally weighted least squares. Behav Res Methods. 2016;48:936–949. doi:10.3758/s13428-015-0619-7
- Rhemtulla M, Brosseau-Liard PE, Savalei V. When can categorical variables be treated as continuous? A comparison of robust continuous and categorical SEM estimation methods under suboptimal conditions. Psychol Methods. 2012;17(3):354–373. doi:10.1037/a0029315
- Sass DA, Schmitt TA, Marsh HW. Evaluating model fit with ordered categorical data within a measurement invariance framework: a comparison of estimators. Struct Equ Modeling. 2014;21(2):167–180. doi:10.1080/10705511.2014.882658
- van Zyl LE, ten Klooster PM. Exploratory structural equation modeling: practical guidelines and tutorial with a convenient online tool for Mplus. Front Psychiatry. 2022;12:795672. doi:10.3389/fpsyt.2021.795672
- Alamer A, Marsh H. Exploratory structural equation modeling in second language research: an applied example using the dualistic model of passion. Stud Second Lang Acquis. 2022 [cited 2022 Oct 20]. doi:10.1017/S0272263121000863.
- Alamer A. Exploratory structural equation modeling (ESEM) and bifactor ESEM for construct validation purposes: guidelines and applied example. Res Methods Appl Linguist. 2022;1(1):100005. doi:10.1016/j.rmal.2022.100005
- McDonald RP. Test theory: a unified treatment. 1st ed. New York (NY): Psychology Press; 1999.
- Cronbach LJ. Coefficient alpha and the internal structure of tests. Psychometrika. 1951;16:297–334. doi:10.1007/BF02310555
- Bacon D, Sauer PL, Young M. Composite reliability in structural equations modeling. Educ Psychol Meas. 1995;55(3):394–406. doi:10.1177/0013164495055003003
- Dunn TJ, Baguley T, Brunsden V. From alpha to omega: a practical solution to the pervasive problem of internal consistency estimation. Br J Psychol. 2014;105(3):399–412. doi:10.1111/bjop.12046
- Hayes A, Coutts JJ. Use omega rather than Cronbach’s alpha for estimating reliability. But … . Commun Methods Meas. 2020;14(1):1–24. doi:10.1080/19312458.2020.1718629
- Fornell C, Larcker DF. Evaluating structural equation models with unobservable variables and measurement error. J Mark Res. 1981;18(1):39–50. doi:10.1177/002224378101800104
- Henseler J. Composite-based structural equation modeling: analyzing latent and emergent variable. New York (NY): Guilford Press; 2021.
- Roemer E, Schuberth F, Henseler J. HTMT2 – an improved criterion for assessing discriminant validity in structural equation modeling. Ind Manag Data Syst. 2021;121(12):2637–2650. doi:10.1108/IMDS-02-2021-0082
- Henseler J, Ringle CM, Sarstedt M. A new criterion for assessing discriminant validity in variance-based structural equation modeling. J Acad Mark Sci. 2015;43(1):115–135. doi:10.1007/s11747-014-0403-8
- Vandenberg RJ, Lance CE. A review and synthesis of the measurement invariance literature: suggestions, practices, and recommendations for organizational research. Organ Res Methods. 2000;3(1):4–70. doi:10.1177/109442810031002
- Kim ES, Cao C, Wang Y, et al. Measurement invariance testing with many groups: a comparison of five approaches. Struct Equ Modeling. 2017;24(4):524–544. doi:10.1080/10705511.2017.1304822
- Byrne BM, Shavelson RJ, Muthén B. Testing for the equivalence of factor covariance and mean structures: the issue of partial measurement invariance. Psychol Bull. 1989;105(3):456–466. doi:10.1037/0033-2909.105.3.456
- Steenkamp JBE, Baumgartner H. Assessing measurement invariance in cross-national consumer research. J Consum Res. 1998;25(1):78–90. doi:10.1086/209528
- Cheung G, Rensvold R. Evaluating goodness-of-fit indexes for testing measurement invariance. Struct Equ Modeling. 2002;9(2):233–255. doi:10.1207/S15328007SEM0902_5
- Chen F. Sensitivity of goodness of fit indexes to lack of measurement invariance. Struct Equ Modeling. 2007;14(3):464–504. doi:10.1080/10705510701301834
- Bollen KA. Structural equations with latent variables. New York (NY): Wiley; 1989.
- Nunnally J, Bernsteing I. Psychometric theory. 3rd ed. New York (NY): McGraw-Hill; 1994.
- Shi D, Lee T, Maydeu-Olivares A. Understanding the model size effect on SEM fit indices. Educ Psychol Meas. 2019;79(2):310–334. doi:10.1177/0013164418783530
- Chen F, Curran P, Bollen K, et al. An empirical evaluation of the use of fixed cutoff points in rmsea test statistic in structural equation models. Sociol Methods Res. 2008;36(4):462–494. doi:10.1177/0049124108314720
- Kenny D, Kaniskan B, McCoach DB. The performance of rmsea in models with small degrees of freedom. Sociol Methods Res. 2015;44(3):486–507. doi:10.1177/0049124114543236
- Taasoobshirazi G, Wang S. The performance of the SRMR, rmsea, CFI, and TLI: an examination of sample size, path size, and degrees of freedom. J Appl Quant Methods. 2016;11(3):31–39.
- Hair JF, Black WC, Babin BJ, et al. Multivariate data analysis. 8th ed. Andover: Cengage Learning; 2019.
- Meredith W. Measurement invariance, factor analysis and factorial invariance. Psychometrika. 1993;58(4):525–543. doi:10.1007/BF02294825
- Putnik DL, Bornstein MH. Measurement invariance conventions and reporting: the state of the art and future directions for psychological research. Dev Rev. 2016;41:71–90. doi:10.1016/j.dr.2016.06.004
- Byrne BM. Structural equation modeling with AMOS: basic concepts, applications, and programming. 3rd ed. New York (NY): Routledge; 2016.
- Pietrobelli C, Marin A, Olivari J. Innovation in mining value chains: new evidence from Latin America. Resour Policy. 2018;58:1–10. doi:10.1016/j.resourpol.2018.05.010