
 ?Mathematical formulae have been encoded as MathML and are displayed in this HTML version using MathJax in order to improve their display. Uncheck the box to turn MathJax off. This feature requires Javascript. Click on a formula to zoom.
Abstract
Since the modern industrial revolution, the speed of urbanization has accelerated, resulting in a series of ecological environment problems. Fujian province will begin to implement the policy of strengthening the provincial capital in October 2021. Therefore, it is crucial to analyze the ecological maintenance status of Fuzhou and provide a relevant reference for Fuzhou to be built into a national central city. This article takes Fuzhou city as the research area, collects land use data in 2000, 2010, and 2020 from Globeland30, combines remote sensing image data, statistical yearbook data, and Digital Elevation Model (DEM) data, and based on Pressure-State-Responses (PSR) model. A total of 15 indicators were selected to construct the ecological security evaluation system of Fuzhou in 2000, 2010, and 2020, and the weight of each indicator was determined by analytic hierarchy process. Spatial autocorrelation was used to analyze the correlation degree of the land use ecological security index in Fuzhou. The concept of ecological maintenance was introduced to analyze the status of ecological maintenance in Fuzhou during the third period. Finally, the diagnostic model of obstacle factors was used to determine the main obstacle factors affecting ecological security in Fuzhou. The results showed that from 2000 to 2020, the area of cultivated land, grassland and bare land decreased year by year, and transferred 320.63 km2, 25.34 km2 and 9.85 km2 to the artificial surface respectively. The high-value ecological security indexes in 2000, 2010 and 2020 were 27.54%, 28.67% and 30.93% respectively. Therefore, the overall level of ecological security in Fuzhou has improved, but there is a large gap in local ecological security. The area with moderate ecological maintenance degree accounted for 60.15%. From the perspective of the whole city, the very poor ecological maintenance degree mainly concentrated in the downtown area and Pingtan Island, while the very good ecological maintenance degree accounted for very little, mainly distributed in the northwest of Fuzhou. The ecological security index showed the characteristics of high and low-value agglomeration, and the distribution of four clusters in three periods was similar. The main obstacle factors of ecological security in three periods are highway density, population density, surface temperature, intensity of human interference, landscape diversity, GDP per capita, and regional development degree. The ecological security evaluation and ecological maintenance of Fuzhou city is beneficial to provide an efficient decision support tool for the ecological environment protection of Fuzhou City.
1. Introduction
Along with the climate change and the human impacts, the change of ecological environment will bring great challenges to human survival and development (Sun et al. Citation2020; Kurup et al. Citation2022). Land use/land cover is one of the most important surface changes in the earth system caused by development. It is the most typical process of human activities in the landscape, and its change will directly or indirectly impact the natural resources and environment, and then affect the regional ecological environment and social and economic development (Usha et al. Citation2021; Yuyu et al. Citation2021). Since the modern industrial Revolution, with the rapid development of urbanization, the impact of land use and cover change is driven by economic development on the ecological environment is increasing, which not only threatens the survival and development of human beings but also has a great impact on the urban development and ecosystem functions (Junling Citation2021; Renyi et al. Citation2021). Therefore, ecological security has attracted more attention from researchers globally (Tadjibaeva and Mambetullaeva Citation2021; Wang et al. Citation2021). Ecological security means that when a country maintains normal development, the ecological environment is not seriously threatened or seldom threatened by environmental damage, and the natural ecosystem can meet the needs of sustainable development of human production and life (Rogers Citation1997). The evaluation methods of ecological security at home and abroad include Pressure-State-Response (PSR) model (Subhasis et al. Citation2020; Singh et al. Citation2021; Tu et al. Citation2021), Driving force -Pressure-State- Impact-Response (DPSIR) model (Alexakis Citation2021; Peng et al. Citation2021; Ruidong et al. Citation2021), Technique for Order Preference by Similarity to an Ideal Solution (TOPSIS) model (Xuefen Citation2021; Xueyan et al. Citation2021; Mandal et al. Citation2022), minimum cumulative resistance (MCR) model (Lu et al. Citation2021; Qianguo et al. Citation2021; Ziyang et al. Citation2021)and so on. Ecosystem stability is an important factor to determine the degree of ecological security and is affected by many factors such as population stability, community stability, system stability, and ecological function stability (Gaowen et al. Citation2021; Huang et al. Citation2021; Qianna et al. Citation2021). On the premise of ecosystem stability, ecological maintenance adds the concept of time scale to emphasize the change of ecological security level of regional units at the scale of ten years or more, to evaluate the long-term stability of regional ecological security. On July 8, 2021, Fuzhou Municipal People’s Government issued a notice on the implementation of “Three-line one-order” ecological zoning management and control. Following the general idea of “keeping the bottom line, optimizing pattern, improving quality and ensuring safety,” and focusing on improving ecological environment quality, the “three-line one-order” ecological environment zoning management and control system covering the whole city was established. To determine the red line of ecological protection, the bottom line of environmental quality, the upper limit of resource utilization, and the list of access to the ecological environment, among which the determination of the existing ecological maintenance is the premise and basis for the implementation of all policies (Fuzhou Municipal People’s Government Citation2021). Therefore, using a reasonable mathematical model and evaluation index system to evaluate ecological maintenance is the most important part of ecological zoning management and control.
Among the numerous models for evaluating regional ecological security, PSR model is more comprehensive and more convincing for the final evaluation result due to its relatively easy acquisition of relevant data and its combination of pressure, state and response to jointly evaluate regional ecological security from the perspectives of natural environment, humanistic environment and social economy. In addition, combined with the characteristics of the study area, this article finally chooses to use the PSR model to evaluate the land ecological security in Fuzhou. Because this article is to study the land ecological security in Fuzhou, the transfer matrix and dynamic attitude are first used to study the change of land use types in Fuzhou in 20 years, paving the way for the subsequent research on ecological security and maintenance of land. Then, based on The PSR model, 15 index factors were selected to construct the ecological security evaluation system of Fuzhou, and the analytic hierarchy process was used to determine the weight of each index factor, and the ecological security index of Fuzhou in three periods was calculated, and the ecological maintenance degree was introduced to study. Then the spatial autocorrelation method is used to analyze the correlation degree of the ecological security index in the global and local aspects in the three periods in Fuzhou. Finally, the diagnostic model of obstacle factors was used to construct the ecological security obstacle degree of Fuzhou in three periods, and the changes of ecological security and ecological maintenance in Fuzhou were obtained. In this article, the hydrological parameters, land use change, vegetation, topography, geomorphology, ecology, and other conditions were quantified and compared from time and space with many research methods, and the ecological changes in Fuzhou were studied in detail in 20 years. The research results can provide a relevant basis for land consolidation planning and ecological security pattern planning in Fuzhou, help to promote the implementation of Fuzhou’s policy of strengthening the provincial capital, and also provide a reference for the construction of ecological security patterns in coastal areas.
2. Study area and data sources
2.1. Study area
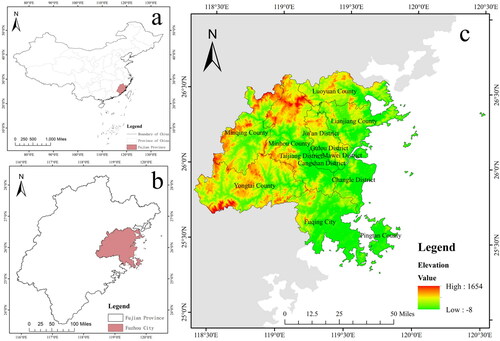
Fuzhou is the capital city of Fujian Province, also known as Banyan City, located in the geographical location of 25°15′–26°39′ N, 118°08′–120°31′ E, in the east of China, the east of Fujian Province, the lower reaches of Minjiang River and coastal areas, is an important city in the southeast coast of China, the first open coastal city, Marine economic development demonstration area (). The gateway of the Maritime Silk Road and China (Fujian) Free trade Zone, one of the central cities of the economic zone on the west coast of the Straits, a riverside ecological garden city. The city has jurisdiction over 6 municipal districts, 1 county-level city, and 6 counties, with a total area of 11968 square kilometers. In 2021, Fujian province issued the 14th Five-year Plan for National Economic and Social Development of Fujian Province and the Outline of 2035 Vision Goals (People’s Government of Fujian Province Citation2021), which will build Fuzhou metropolitan circle at a high level and encourage Fuzhou to become a national central city. We will encourage Fuzhou New Area to accelerate its development into an important platform for cross-Straits exchanges and cooperation, a demonstration zone for reform and innovation, a pioneer zone for ecological progress, an important gateway for opening up to the outside world, and an important modern industrial base in the southeast coast.
Figure 1. Geographical location of Fuzhou City (a is the provincial administrative division of China, b is the location of Fuzhou city in Fujian province, and c is the elevation of the district and county administrative divisions of Fuzhou City.).
2.2. Data sources
The data and sources used in this article are shown in the following table (). Both remote sensing image data and DEM data come from the geospatial data cloud (http://www.gscloud.cn/). Basic geographic information data from China academy of sciences, resources and environmental science and data center (https://www.resdc.cn/Default.aspx), statistical yearbook data from the Fuzhou city bureau of statistics (http://tjj.Fuzhou.gov.cn/).
Table 1. Research data and sources.
3. Research methods
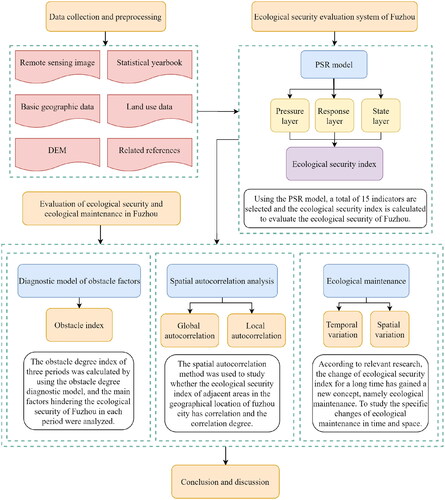
This article first uses the transfer matrix and the dynamic attitude to study the changing situation of land ecological security in Fuzhou from the change of land use types. A total of 15 indicators were then selected based on the PSR model to build an evaluation system for land ecological security in Fuzhou, and the weights of each indicator were determined using hierarchical analysis. Spatial autocorrelation analysis was then used to study the degree of correlation between the ecological security indices of Fuzhou city from both global and local aspects. Finally, diagnostic model of obstacle factors was used to select the main influencing factors affecting land ecological security in Fuzhou ().
Figure 2. Flow chart of this study.
3.1. Land use change
Land provides humans with the resources they need to live and produce, and human activities influence ecological security, of which there is a close relationship between land use types and regional ecological security, interacting and influencing each other, thus constituting the land ecological security. This article is a study of one of the branches in the field of ecological security, that is, land ecological security. Therefore, this article first researches the changes in land use types in Fuzhou City to set the stage for the subsequent research on land ecological security. There are many methods to study the land use change in a region (Kumar and Agrawal Citation2019; Mbaziira Citation2019; Duan et al. Citation2020; Xiaoyong et al. Citation2021). This article uses transfer matrix and dynamic attitude to study the land use change in Fuzhou city.
3.1.1. Transfer matrix
Transfer matrix is a number of different land use types and the direction of mutual transformation between the main method of quantitative research, through the analysis of transfer matrix, can be in Fuzhou conversion between different periods of land types, this can be a concrete analysis to the change of the class and the use of characteristics of the land use planning of Fuzhou city. Its mathematical model is as follows:
(1)
(1)
Where, represents the amount of the
land-use type being converted into the
land-use type in the study area.
3.1.2. Dynamic attitude
(1) Dynamic attitude of a single land-use type refers to the quantity change of a certain land-use type in a certain time range in a certain research area, which can be expressed as follows:
(2)
(2)
and
respectively studied the area (km2) of a certain land-use type in the early stage and the late stage, and
was the length of the research period (years) from moment
to moment
A positive result indicates an increase and a negative result indicates a decrease.
(2) Comprehensive land use dynamic attitude refers to the quantitative reflection of the speed of comprehensive land-use change in the study area, considering the mutual transformation of various land types in the study area. Its mathematical expression is:
(3)
(3)
Where is the absolute value of the area of class
land-use type changing to non-class
land-use type in a certain research period, and
is the area of class
land-use type in a certain research period;
is the length of the study period (years).
3.2. PSR model
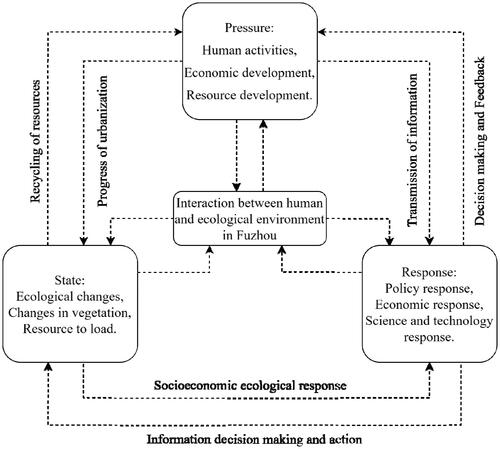
The PSR model was proposed by the United Nations Economic Cooperation Development Agency in the late 1980s (WALZ Citation2000). It divides an evaluation indicator system into pressure-state-response three subsystems, each of which contains different indicator types (). The model focuses on the human impact on the environment, reflects the relationship among natural system, ecological system, and social system, and systematically reflects the process mechanism of ecological security assessment (Wei et al. Citation2020; Yunshu et al. Citation2020). Based on the PSR model, this article selects a total of 15 evaluation indicators from the three criteria layers of pressure, state and response ( and ).
Figure 3. Ecological security analysis framework based on PSR model.
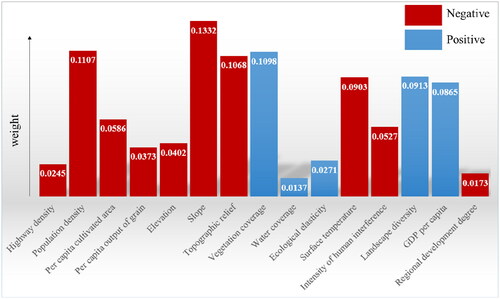
Table 2. Calculation method of PSR model index factors in Fuzhou.
Table 3. Evaluation index system of land ecological security in Fuzhou.
3.2.1. Standardization of indicators
Due to the lack of comparability among selected evaluation indicators with different dimensions and units, it is impossible to directly calculate, so it is necessary to conduct dimensionless processing for data of each indicator (Thorson et al. Citation2020). In this article, the range method is adopted to standardize each indicator factor, and the range of each indicator selected above is calculated between [0,1]. Some of the ecological security evaluation indexes have positive effects, and the higher the value is, the safer the ecosystem will be, while some indexes have negative effects, and the higher the value is, the more unsafe the ecosystem will be.
Positive index calculation formula:
(4)
(4)
Negative index calculation formula:
(5)
(5)
Where represents the
index of the
unit after standardized treatment;
represents the original value of the
index of
units;
is the maximum value of the
index of the
cell,
is the minimum value of the
index of the
cell.
3.2.2. Ecological security index
Where is ecological security index;
is the weight value of the index;
is its dimensionless value;
is the total number of evaluation indicators.
3.3. Analytic hierarchy process
Determining the weight of evaluation index is the key to ecological security evaluation. The existing index weight calculation method has been quite mature. In this article, the analytic hierarchy process (AHP) is used to determine the index weight. AHP is a combination of qualitative and quantitative weighting method, and a multi-criteria decision-making method with flexibility, logic, practicality, and effectiveness (Kaymaz et al. Citation2021). Its basic principle is to treat a complex problem as a system after in-depth analysis of its essence, influencing factors and internal correlation (Koppiahraj et al. Citation2021). According to the functional characteristics of the internal components, the system is divided into layers and branches, and then the judgment matrix is constructed, and the relative important corresponding elements of each layer are sorted. This article collected questionnaires from four experts and teachers who studied ecological security and processed the questionnaire with yaahp software (Ma Citation2015; Liu, Citation2021). Yaahp is a simple tabbed interface style analytic hierarchy process software, made by Shanxi Yuan Decision Software Technology Company, China. It can according to the business data and scientific to evaluate the allocation of resources, benefit-cost analysis, business operations, such as can support hierarchical model mapping, data comparison, matrix of data entry, automatic correction, the imperfect but inconsistent judgment matrix can accept the judgment matrix and the total goals or objectives that sorting weighting function, can help users don’t need to understand and use analytic hierarchy process to make decisions (F and H Citation2018). The results passed the consistency test and finally obtained the weight of each indicator (, ).
Figure 4. Factor weight and trend of ecological security index in Fuzhou.
3.4. Spatial autocorrelation analysis
Spatial autocorrelation refers to whether a geographical phenomenon in adjacent regions is correlated (Juan et al. Citation2021; Xiaoling et al. Citation2021; Yalan et al. Citation2021). This article uses global autocorrelation methods and local autocorrelation methods to study the characteristics of Fuzhou’s ecological security index in the overall and local areas.
3.4.1. Global autocorrelation
Global autocorrelation refers to whether an attribute value in the whole region is correlated. Since Moran’s I index is less affected by deviation from normal distribution, this article adopts global Moran’s I index to test the global autocorrelation of ecological security index, and the calculation formula is as follows:
(7)
(7)
In the formula, is the number of grids,
and
are the attribute values of spatial geographical objects at the I and J points, respectively.
is the mean value of
and
is the spatial weight matrix, representing the connection relationship between a spatial geographical object at the
and
points. Moran’s I∈[−1,1], the larger the absolute value is, the stronger the spatial correlation is.
3.4.2. Local autocorrelation
After global autocorrelation was used to detect the global spatial correlation of ecological security index, local autocorrelation was used to analyze its local correlation properties. The global Moran’s I is decomposed, and the calculation formula of local Moran’s I is as follows:
(8)
(8)
In the formula, is
is the mean value of
is the spatial weight matrix, and local Moran’s I is tested by z-score.
3.5. Diagnostic model of obstacle factors
The purpose of ecological security evaluation is not only to get the influence degree of each index factor, but also to find out the gap between each index factor and determine the direction of future improvement. It is necessary to evaluate the obstacle degree of a single indicator, and then diagnose its obstacle factors (Shaohua et al. Citation2019; Huiqin et al., Citation2020). This article refers to relevant literature (Di et al. Citation2020; Xie et al. Citation2021; Zhang et al. Citation2021), introduces index contribution degree, index deviation degree and index obstacle degree, establishes a diagnostic model of ecological security obstacle factors, diagnoses the ecological security obstacle factors in Fuzhou City in three periods, and puts forward the corresponding ecological security strategy according to the obstacle factors.
(9)
(9)
(10)
(10)
Where, is the indicator obstacle degree;
is the contribution degree of index, and the value is the weight of item
determined by analytic hierarchy process.
is index deviation degree;
is the normalized value of index
4. Results and analysis
4.1. Land use change
Land use change is both the cause and the result of environmental change and an important component of global environmental change. Land use/land cover is an important source of information for understanding the complex interaction between human activities and ecological environment, and it is crucial to improve the understanding of global sustainable development and man-land relationship (Hong et al. Citation2021; Hongfei et al. Citation2021; Zhang and Zhou Citation2021).
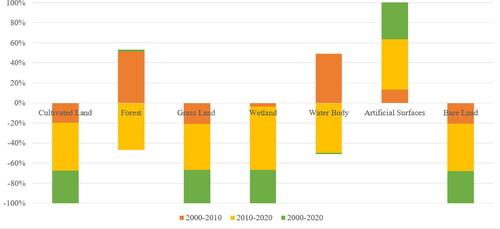
Due to the rapid urban development, the demand for construction land is gradually increasing, in which the increase of artificial surfaces and bare land area and the decrease of cultivated land area are the most obvious, mainly occurring in Cangshan District, Taijiang District, Jin’an District, Gulou District and Pingtan County. Because Cangshan district, Taijiang District, Jin’an District, Gulou District are the downtown areas of Fuzhou city, the urbanization development is earlier, but also rapid development. Pingtan County is due to Pingtan Island, which is the largest island in Fujian province and the fifth largest island in China. Due to the development of tourism industry in the past 20 years, and the Fujian provincial government is also vigorously developing Pingtan comprehensive experimental area, Pingtan Island has been overdeveloped and the urbanization speed is too fast (). The land use statistics of Fuzhou in three periods are shown in the following table (). From 2000 to 2010, the area of artificial surfaces increased from 460.06 km2 to 546.56 km2, and the area of construction land reached 935.53 km2 in 2020. The proportion of bare land in 2000 was 0.55%, in 2010 was 0.50%, and in 2020 was 0.41%. The area of cultivated land decreased by 141.17 km2 from 2000 to 2010 and by 322.48 km2 from 2010 to 2020. Forest, grass land, water body and wetland did not change significantly during the 20 years.
Figure 5. Spatial distribution of land use types in Fuzhou.
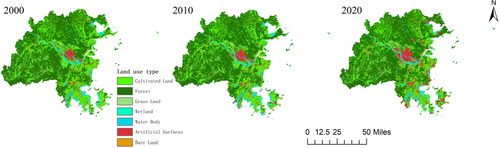
Table 4. Transfer matrix of land use type change in Fuzhou (km2).
4.1.1. Transfer matrix analysis
It can be seen that from 2000 to 2010, the area of land use type in Fuzhou did not change much (), and the conversion of land type was mainly concentrated in the conversion of cultivated land to construction land and forest land, and forest land to construction land and water body. The area of cultivated land decreased by 141.61 km2, the area of construction land and woodland increased by 85.95 km2 and 50.83 km2, respectively. The area of forestland decreased by 36.01 km2, 27.30 km2 of forestland was converted to construction land, and 8.71 km2 of forestland was converted to water body. From 2010 to 2020, the change of land type is relatively large, and the change of land type is concentrated in the conversion of cultivated land to building land. During this period, the area of construction land increased greatly, about 389 km2, while the area of cultivated land decreased about 322 km2. In addition, other types of land area have different degrees of decline. The more obvious changes in land use types in Pingtan County, Fuqing City, Lianjiang County, Cangshan District, Gulou District and Changle District are mainly due to the fact that these areas are the central, coastal and economically developed areas of Fuzhou City and the development of urbanization requires the conversion of other land use types into urban construction land. During the past 20 years, land change occurred among forest, grassland, cultivated land and building land, and the increase of building land and the decrease of cultivated land were the most obvious. From 2000 to 2020, the area of construction land increased by about 475 km2, while the area of arable land decreased by about 464 km2. The main reason for this change is that Fuzhou is located in the southeast hills of China, and there is less land available for human use. In addition, Fuzhou is the capital city of Fujian Province. With the construction of urbanization, the reduced cultivated land is mainly transferred to the construction land, leading to the gradual imbalance of man-land relationship, and the contradiction becomes more acute.
4.1.2. Dynamic attitude analysis
Through the analysis of single and comprehensive dynamic attitude of land use, the change rate of regional comprehensive land type from 2010 to 2020 is about eight times of that from 2000 to 2010, with a large difference (). Fuzhou construction has been rapid after 2010, and the change of land type in both area and rate is greater than that before 2010. During the period of 2010–2020, construction land not only increased in area, but also grew at a relatively fast rate. During the 2010–2020 period, construction land increased at a rapid rate of about seven times that before 2010, followed by a relatively fast decline around Bare Land. From 2000 to 2010, construction land changed the most rapidly, with an average annual decrease of 1.8801%. Wetlands showed the slowest rate of change, with an average annual increase of 0.0317%; From 2000 to 2010 and 2010 to 2020, the decrease rate of arable land decreased, with the slowest change rate being woodland, which increased by 0.0705% per year on average. Looking at the positive and negative signs of the dynamic attitude, cultivated land, grass land, wetland and bare land are all negative values over the three periods, indicating that the area of these four land use types is decreasing over the three periods. Forest land and water body both end up with very small values, indicating that these two land use types have changed less over a 20-year period, while the artificial surfaces have been at positive values due to urbanization. This is mainly because the general outline of 2006–2020 land use planning put forward by the Fuzhou Municipal People’s Government in 2009 according to the problems of land use in Fuzhou clearly stated that the strictest farmland protection system and the strictest land saving system should be implemented, the land use should be coordinated, and the overall control of planning should be strengthened. And the increase of urban construction land is mainly due to the Fuzhou channel west bank economic zone strategic position in the provincial capital city, to achieve cross-strait “three links,” guarantee the formation of the two wings of a city dual-axis, meet in Fuzhou, such as high-speed rail, important port, water conservancy facilities and other major infrastructure facilities and requirements of construction land increase caused by the larger.
Figure 6. Dynamic attitude of land use in Fuzhou from 2000 to 2020.
4.2. Analysis of changes in ecological security
4.2.1. Evaluation index database
4.2.1.1. Highway density
Highway density can reflect the speed and scale of urbanization development of a city, and indirectly reflect the ecological environment of a city. In this article, vector data of the Fuzhou highway network were collected to create a grid of 300 m × 300m. The intersection analysis of ArcGIS software was used to calculate the proportion of road network length in each grid to the area of each grid, and finally, the grid was rasterized.
4.2.1.2. Population density
Population density refers to the number of people living per unit area of land, which can reflect the density of population living in various regions of the world. According to previous research results (Yuanwei Citation2020), population distribution is closely related to construction land distribution. Query Fuzhou statistical yearbook, this article will assign of each area county, the population to the grid, then will the land use data of construction land classification, created 300 m300 m grid, each grid construction land area is calculated using the area TAB proportion, finally will be used in front of the three grids calculator multiply by the final population density.
4.2.1.3. Per capita cultivated area
The change of per capita cultivated land area is mainly affected by urbanization rate, population growth and the development of primary industry. The area of arable land per capita is equal to the average amount of arable land owned by each person in a certain area. This article inquired Fuzhou statistical yearbook and combined with land use data, calculated and assigned the per capita cultivated land area in each district and county, then transformed the grid, and then divided the land use data into two categories of cultivated land, created 300 m × 300m grid, and calculated the area ratio of each grid with area tabulation. Finally, multiply the first three using a grid calculator to get the final area per capita.
4.2.1.4. Per capita output of grain
Per capita output of grain is the amount of grain available per person per unit area. This article inquired Fuzhou statistical yearbook and combined with land use data, calculated and assigned per capita grain output in each district and county, then transformed the grid, and then divided the land use data into two categories of cultivated land, created 300 m × 300m grid, and calculated the area ratio of each grid with area tabulation. Finally, multiply the first three times using a grid calculator to get the final per capita food production.
4.2.1.5. Elevation, slope and topographic relief
Topographic topography is often used to describe the changes of regional topographic relief, and its common descriptive indicators include elevation, slope and topographic relief. As one of the important factors to describe regional geographical environment, topography and landform will influence the formation and development of different natural landscapes to a certain extent. In addition, landform also restricts social activities that affect human beings to a large extent, leading to the differentiation of regional land use patterns, and ultimately affecting regional ecological security. Elevation affects the availability of the region, which is an important factor to determine the land use pattern and has a great impact on the ecological environment. Slope affects the availability of the region, which is an important factor to determine the land use pattern and has a great impact on the ecological environment. Topographic relief is widely used in geological research, as one of the core bases for dividing landforms, and is often used in ecological environment assessment, soil erosion assessment, and so on. In this article, block statistics of neighborhood analysis in ArcGIS10.2 are used, and then the difference between the maximum value and minimum value of DEM is obtained by using a grid calculator.
4.2.1.6. Vegetation coverage
As an important indicator to measure the growth of surface vegetation and to indicate the changes in the ecological environment, vegetation coverage plays an important role in the ecological environment system (Al-Ali et al. Citation2021; Zuo et al. Citation2021). In this article, the pixel dichotomy model is used to calculate vegetation coverage. Since the NDVI value of a mixed pixel can be composed of the of the vegetated part and the
value of the non-vegetated part, the NDVI value is substituted into the formula to calculate the vegetation coverage. According to the cumulative probability distribution table of NDVI, the confidence interval is set at 5% and 95%, and the NDVI values near 5% and 95% are selected as the values of soil and vegetable respectively.
4.2.1.7. Water coverage
Water area coverage is an important component of ecological planning and analysis, so ecological security evaluation is inseparable from water body analysis. This article selects water area coverage as the research index, which refers to the proportion of the area occupied by the water body in the total area of the research area. In this article, a grid of 300 m × 300m is created, and the area proportion of the water body in each grid is calculated by area tabulation, and then rasterized.
4.2.1.8. Surface temperature
With the rapid development of urbanization, land use and ecological pattern have undergone drastic changes. Woodland and cultivated land have been occupied and converted into construction land, and the urban environment and urban ecosystem have been greatly affected. The urban heat island effect is one of them, and human life is closely related to the change of urban temperature. The change of land use and vegetation cover type and regional temperature distribution interact with each other, thus exerting an effect on the ecological environment (Somenguem et al. Citation2021; Zhiwei et al. Citation2021). The atmospheric correction method based on the radiative transfer equation was adopted in this article (Mike et al. Citation2020).
4.2.1.9. Intensity of human interference
Human interference affects the natural landscape through a series of human activities, which gradually reduces the sustainability of the natural landscape. Different landscape types can reflect the intensity of human activities’ interference on the natural surface (Vytautas et al. Citation2018). This article refers to relevant literature (Enping et al. Citation2014; Xin et al. Citation2015) and assigns corresponding parameters of human disturbance intensity to each land-use type ().
Table 5. Parameters of human interference intensity in Fuzhou.
4.2.1.10. Ecological elasticity
Ecological elasticity reflects the ability of the self-regulation of the ecosystem to recover to its initial state after deviating from the equilibrium state. The greater the ecological elasticity, the more stable the ecosystem and the stronger the anti-interference capability (Abebe Citation2012; Chu et al. Citation2016). This article refers to relevant literature (Liuwen et al. Citation2015) and assigns corresponding ecological elasticity scores to each land-use type ().
Table 6. Ecological elasticity score of Fuzhou city.
4.2.1.11. Landscape diversity
The landscape diversity index can be used to represent the richness and complexity of various landscape types in the region. The higher the landscape type diversity index is, the higher the fragmentation degree of land use types in the region is, the more likely it is to be disturbed by human factors, and the worse the stability of the ecological environment is (Sonko et al. Citation2021). If the value of the landscape diversity index is 0, it means that there is only one land class in the whole landscape.
4.2.1.12. GDP per capita
GDP per capita refers to the ratio of a country’s annual GDP to its resident population. This article inquired Fuzhou statistical yearbook and combined with land use data, calculated and assigned per capita GDP to each district and county, then transformed the grid, and then divided the land use data into two categories of construction land, created 300 m × 300m grid, and calculated the area proportion of construction land in each grid by area tabulation. Finally, multiply the first three times using a grid calculator to get the final GDP per capita.
4.2.1.13. Regional development degree
Regional development is a process in which social and economic activities are carried out to meet human needs in a certain region and land use is continuously expanded in the region as a result (Xi et al. Citation2021). In this article, the regional development degree is expressed by calculating the proportion of construction land and cultivated land to the total area of the region.
4.2.2. Ecological security index
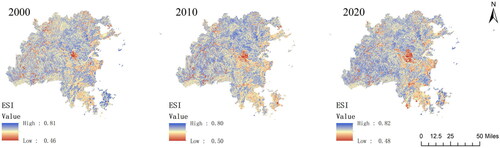
As can be seen that the spatial distribution of ecological security in 2000, 2010, and 2020 is generally similar (). High-value ecological security means that the ecological environment of this region is very good, while low-value ecological security means that the ecological environment of this region is poor due to excessive urbanization and development. Better ecological security is mainly concentrated in the northwest of Fuzhou, that is, the north of Minhou County, Luoyuan County, Minqing County, and Yongtai County, because these four counties are far away from the center of Fuzhou city, the main land use type is forest land, and the urbanization speed in the past 20 years is relatively moderate. And with poor ecological security are mainly concentrated in Fuzhou city center and the coastal areas of Fuzhou city, namely Cangshan district, Taijiang District, Jin’an District, Gulou District, Mawei District, Changle District, Fuqing City and Pingtan Island, because these districts and counties are located in the city center area with rapid urbanization development and coastal areas open to the outside world, and the main land use type is construction land. During the three periods, the areas that have been at low levels of ecological security are located in Cangshan District, Taijiang District and Gulou District. These three districts and counties have been at low levels of ecological security covering these areas for 20 years and extending outwards, mainly because these three districts and counties are the downtown areas of Fuzhou City and the scale of urbanization has grown to its limits over a 20-year period. The ecological security level of Minhou County in the area close to the city center has also gradually decreased, mainly because it is a suburb of Fuzhou City, which is also a high-tech development zone and a university town area, and the municipality is also making great efforts to develop this part of the city, which has led to a decline in the ecological environment. Pingtan Island, the main island of Pingtan County, had a high overall ecological security index in 2000, but was at a very low ecological security level in 2010, and by 2020 the overall ecological security level had improved. The reason for this phenomenon is due to the establishment of the Pingtan Comprehensive Experimental Zone by Fuzhou City in 2009 and the vigorous development of Pingtan Island, coupled with the fragile ecosystem of Pingtan Island itself, which led to serious damage to the ecological environment of Pingtan Island. Afterwards, the municipal government realized that ecological protection was as important as economic development and started to carry out measures such as reclamation and afforestation to prevent wind, with the aim of turning Pingtan Island into a large island famous for international tourism.
Figure 7. Spatial distribution of ecological security index of Fuzhou.
4.3. Ecological maintenance analysis
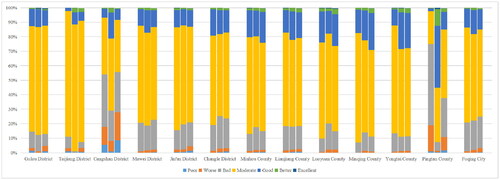
Reference literature (Zhencan et al. Citation2019; Jianhui et al. Citation2021), this article puts forward the ecological maintenance concept, namely ecological maintenance status by the regional development model, environmental management, ecological protection, people’s lifestyle, the coordination of regional ecological and economic development, the influence of such factors as reflect a region ecological maintenance level over a period of time, is also a region ecological response of important evaluation indexes. This article will Fuzhou three periods of ESI following paragraph point method is divided into four types, the values from small to large respectively correspond to very unsafe, relatively unsafe, relatively safe and very safe. Then using ArcGIS software of raster calculator every two phases difference, the result is ecological maintenance, representing over a period of time, the change of the ecological security. The distribution of values from small to large corresponds to 7 categories: poor, worse, bad, moderate, good, better, excellent.
As can be seen that the ecological maintenance degree in the three periods of 2000, 2010 and 2020 occupies a large part in the moderate level ( and ). From 2000 to 2020, the area of the moderate level accounts for 60.15%, and from 2010 to 2020, the area of the moderate level accounts for 60.87%. From 2000 to 2010, the area with moderate ecological maintenance degree accounted for 67.47%, indicating that the overall change of ecological security in Fuzhou during the 20 years was not big. The poor ecological maintenance indicates that the ecological security of the region deteriorates significantly during this period. From the perspective of the whole Fuzhou city, the poor ecological maintenance degree is mainly concentrated in the downtown area and Pingtan Island, while the excellent ecological maintenance degree occupies a very small proportion, mainly distributed in the northwest of Fuzhou city. In terms of districts and counties, poor ecological maintain degrees, Cangshan District, Jin’an District, Minhou County and Pingtan County were mainly distributed in the areas of 7.92 km2, 2.16 km2, 2.34 km2 and 2.97 km2 from 2000 to 2010. This is mainly due to urbanization, the highly urbanized development of city centers in areas such as Cangshan District, the urbanized development of suburban areas in parts of Minhou County and the development of tourist islands in the Pingtan Island area, resulting in a sharp decline in the level of ecological security leading to poorer ecological maintenance during this decade. From 2010 to 2020, the poor ecological maintenance degree was mainly distributed in Jin’an District, Changle District, Minhou County and Lianjiang County, with an area of 2.16 km2, 2.34 km2, 4.95 km2 and 5.58 km2, respectively. From 2000 to 2020, the poor ecological maintenance degree was mainly distributed in Cangshan District, Jin’an District, Changle District, Minhou County, Lianjiang County, Pingtan County and Fuqing City, with an area of 12.69 km2, 7.65 km2, 5.58 km2, 8.64 km2, 6.75 km2, 4.50 km2 and 4.05 km2, respectively. During this decade, the ecological security level continued to decline in some areas of Minhou County due to the construction of the university city and the development of the high-tech development zone, while the central business district of Fuzhou City began to move northward, resulting in the ecological security of Jin’an District also began to decline, as well as Changle District also began to expand the scale of the construction of Changle Airport, resulting in the poor ecological maintenance of these areas. However, as the municipal government started to develop Pingtan Island into an international tourist island and introduced relevant ecological protection measures along with economic development, the ecological quality of Pingtan Island gradually improved and the ecological security level increased, resulting in an excellent ecological maintenance level during this period. Between 2000 and 2020, the Central Business District (CBD) around Cangshan District, as well as Changle District, Jin’an District and Fuqing City, all of which have experienced a significant decline in the level of ecological security and poor ecological maintenance over a 20-year period due to urbanization, as a result of the reasons mentioned above. In addition, although the ecological maintenance level of Pingtan Island was poor in the first 10 years and excellent in the second 10 years, the overall ecological maintenance level was poor in 20 years because the ecological damage in the earlier period was too severe.
Figure 8. Spatial distribution of ecological maintenance in Fuzhou.
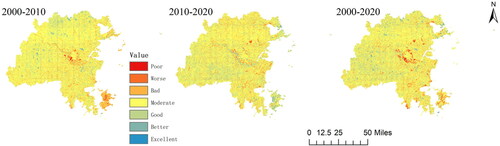
Figure 9. Area statistics of ecological maintenance degree in Fuzhou. (The three time periods are, from left to right: 2000 to 2010, 2010 to 2020 and 2000 to 2020.).
4.4. Spatial autocorrelation analysis
In this article, ArcGIS software was used to create a 300 m × 300m grid and combined with GeoDa software, spatial correlation analysis was conducted on the ecological security index of Fuzhou for three periods, and then Monte Carlo simulation method was used to test whether Moran’I was significant. It shows that the spatial autocorrelation is significant with 99.9% confidence (). The ecological security index of most areas in the study area showed an obvious positive spatial correlation. The Moran′s I indexes for 2000, 2010 and 2020 are 0.4502, 0.4582 and 0.5147 respectively, and the Moran′s I indexes for all three periods are greater than 0. This indicates that ecological security in Fuzhou City shows a positive spatial autocorrelation in the overall spatial direction, and the spatial autocorrelation is increasing, with the latter decade increasing more significantly than the former decade. The increase in spatial autocorrelation is more significant in the latter decade than in the previous decade, indicating that the overall ecological security of Fuzhou has improved, and the ecological protection measures in Fuzhou have been strengthened in the latter decade compared to the previous decade. In this article, significance tests were conducted on the z-values based on p = 0.001. The results show that the z-values for the three periods are 315.8332, 332.0072 and 366.9501 respectively, which are all greater than 2.58, passing the significance test, proving that the possibility of randomly producing this clustering result is less than 0.1%, indicating that ecological security in Fuzhou City shows obvious clustering characteristics with certain spatial autocorrelation, and the clustering phenomenon in the latter decade is more significant.
Table 7. Spatial correlation test results of ecological security index in Fuzhou.
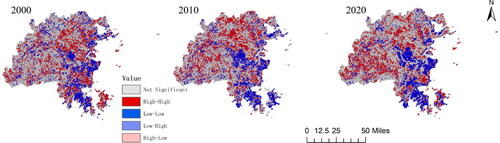
To further, reveal the “neighborhood space” autocorrelation, the LISA aggregation map of the ecological security index was calculated and drawn using GeoDa software, thus allowing the degree of aggregation of ecological security in the local area of Fuzhou to be clearly obtained. The ecological security index of Fuzhou presents the characteristics of high and low values agglomeration ( and ). In 2000, the high-high (H-H) positive correlation clusters were mainly distributed in Jin’an District, Mawei District, Yongtai County and Pingtan County. the H-H clustering type indicates that the ecological security index of this region and the surrounding areas is higher than the mean value of this index in the study area. The main reason is that these areas were economically underdeveloped at the time, urbanization progressed more slowly and the ecological environment of the area was better protected compared to the developed areas, resulting in a higher ecological security index. The low-low (L-L) negative correlation clusters are mainly distributed in Changle District, Fuqing City, Cangshan District, Gulou District and Taijiang District. the L-L aggregation type, indicates that the ecological security index in the region and surrounding areas is lower than the mean value of this index in the study area. The spatial distribution of the four clusters is roughly similar in 2010 compared to 2000, mainly the H-H positive correlation clusters and L-L negative correlation clusters expand to a larger area, with the area share increasing by 1.09%, and 1.31%. The reason for this change is that Fuzhou, as the capital city of Fujian Province, needed to expand outward into the urban center because of the high rate of urbanization across China at that time. One of the most obvious changes is Pingtan Island, which was still in the H-H positively correlated cluster in 2000, but by 2020, due to the development and construction of Pingtan Island, the whole island becomes an L-L negatively correlated cluster. By 2020, based on the similar distribution of the four clusters, the H-H positively correlated cluster expands outwards to the entire southeastern coastal area of Fuzhou, while the L-L negatively correlated cluster expands to the northwestern area of Fuzhou. The area share of the H-H positively correlated clusters reaches a 20-year high of 18.36% at this time, indicating that Fuzhou as a whole is striving to harmonize economic development with ecological conservation at this time. One of the most obvious changes was on Pingtan Island, which was committed to becoming a major international tourism island, resulting in a marked improvement in its ecological environment in the latter decade. The regional distribution of high-low (H-L) and low-high (L-H) in the three periods is more dispersed. the H-L aggregation and L-H aggregation types indicate a strong spatial variability of the ecological security index in the region and the surrounding areas. The area shares of the sum of the two is also smaller, at 4.43%, 4.25% and 3.53% for the three periods respectively, indicating that the variation of the ESSI in Fuzhou as a whole is decreasing year by year. The percentage of area in the insignificant type is 64.82%, 62.29% and 62.53% in 2000, 2010 and 2020 respectively. The “insignificant” type indicates that the area and the surrounding areas are less spatially concentrated and do not pass the significance test. As most of these areas are far away from urban centers, on the outskirts of cities or in remote areas, the connectivity between areas is poor, resulting in a low degree of clustering of ecological security in the area. At the same time the 20-year area of insignificant types is decreasing overall, indicating that the overall ecological security is moving in the direction of agglomeration. In conclusion, the distribution of ecological security in Fuzhou has obvious regional characteristics, and the types of agglomeration also change over time. The main reason for this is the different natural environment, socio-economic development and ecological policies of each district and county.
Figure 10. Moran Scatter plot of Fuzhou.
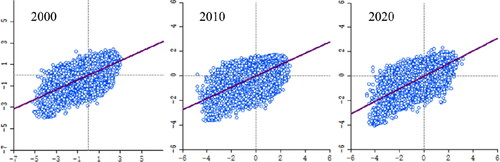
Figure 11. Spatial aggregation of ecological security index in Fuzhou.
4.5. Analysis of ecological security obstacle degree
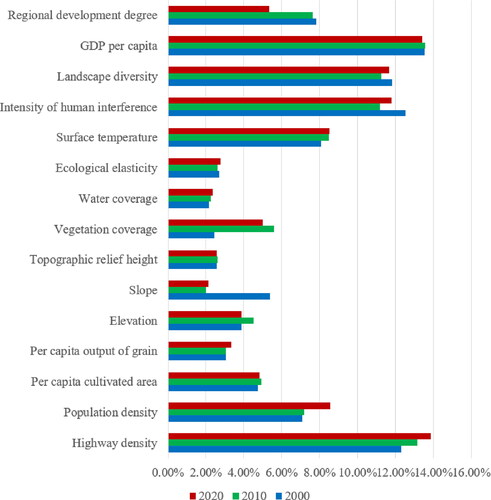
The proportion of obstacle degrees for each indicator was largely similar across the three phases (). The main barriers are highway density, population density, surface temperature, intensity of human interference, landscape diversity, GDP per capita and regional development degree, and these seven main barriers remain firmly in the top seven over the three periods. The highway density in the three periods was 12.30%, 13.16% and 13.85% respectively, showing an increasing trend year by year. This is because in order to carry out urbanization, roads need to be built first, and the completion of road construction can greatly reduce the transportation time costs for all industries, so it also leads to highway density becoming an important factor hindering ecological security. Population density was 7.08%, 7.17% and 8.54% in the three periods. Due to the large base of China’s population and the gradual concentration of provincial resources in Fuzhou, which is the capital city of the province, the city is becoming more and more populated, and the increase in population will lead to a series of ecological problems, such as traffic congestion, massive consumption of natural resources and massive development of land for construction, all of which These will reduce the level of regional ecological security. Surface temperature was 8.06%, 8.48% and 8.53% in the three periods. Surface temperature is closely related to urbanization, and the need for economic development has led to a large number of natural surfaces becoming impermeable, seriously affecting regional ecological security. The intensity of human interference was 12.52%, 11.18% and 11.80% in the three periods, respectively. Excessive human interference can endanger the natural environment and thus affect regional ecological security. Landscape diversity was 11.82%, 11.25% and 11.66% respectively, with more landscape types indicating that the regional environment has been excessively modified by humans, which is also harmful to regional ecological security. The GDP per capita for the three periods is 13.55%, 13.58% and 13.40% respectively, and the relationship between GDP and regional ecological security is negative, which can jeopardize regional ecological security. The degree of regional development is 7.80%, 7.64% and 5.35% for the three periods respectively, and the degree of obstruction of regional development is gradually decreasing, indicating that with urbanization, the level of urbanization in the region is close to saturation and the degree of obstruction of regional development to ecological security in Fuzhou is gradually decreasing. Among the seven major impediments, the degree of impediment of highway density, population density and surface temperature gradually increase from 2000 to 2020, indicating that these three indicators are becoming more and more of an impediment to ecological security. As slope, elevation and topographic relief are natural factors, they are less of an obstacle to ecological security in Fuzhou, and the two factors of water coverage and ecological elasticity play a positive role in the ecological security of Fuzhou’s land, so they are also less of an obstacle. In conclusion, the Fuzhou government should build on its own advantages in ecological conditions and natural resources, optimize the spatial pattern of urban development, build a modern industrial system, and increase policy support to achieve healthy and sustainable development in Fuzhou.
Figure 12. Obstacle degree of ecological security evaluation index in Fuzhou.
5. Conclusion
In this article, the land use data of Fuzhou city in 2000, 2010, and 2020 were collected from Globeland30, and the transfer matrix analysis and dynamic attitude analysis were carried out on the land use data of the three periods. In the land-use change from 2000 to 2020, due to the development of urbanization, the area of cultivated land, grassland, and naked land decreased year by year. And mainly to the direction of construction land transfer; Then based on the PSR model, selected a total of 15 indicators and combined with AHP to determine the weight, build the Fuzhou city ecological security evaluation system, 2000–2020, the ecological security level of Fuzhou generally improved, but the ecological security gap of the local area is larger, downtown area and the ecological security of Pingtan island is poorer, The main reason is the excessive concentration of population in the downtown area and the construction of Pingtan tourism island city by Fuzhou government. Then the introduction of the ecological concept, combined with the change of the ecological security of Fuzhou city ecological environment quality in time and space analysis, from 2000 to 2020, with a moderate level of ecological maintenance area accounted for 60.15%, poor ecological maintenance degrees are mainly concentrated in the downtown area and Pingtan island and excellent ecological maintain degrees of few, mainly distributed in Fuzhou in the northwest; Then, the spatial autocorrelation was used to analyze the correlation degree of the ecological security index of The third period in Fuzhou. The ecological security index of Fuzhou showed the characteristics of high and low-value agglomeration, and the distribution of the four clusters in the third period was roughly similar. The final diagnosis model using obstruction factors evaluated the degree of each index of ecological security of Fuzhou block, get three periods of Fuzhou city ecological security is the main obstacle factors of road network density, population density, surface temperature, the intensity of human disturbance, landscape diversity, per capita GDP, regional development degree of the seven indicators, and the degree of each factor of obstacles exist band phenomenon.
In this article, a total of 15 indicators were selected to construct the ecological security evaluation system of Fuzhou based on the PSR model, and the ecological maintenance status of Fuzhou in 20 years was studied. Because the current PSR model does not have a specific standard evaluation system, the selection of indicators is not comprehensive, and the use of an analytic hierarchy process in determining the weight of indicators is subjective. In addition, ecological maintenance is a new concept, and there is no research method related to ecological maintenance so far. In this article, it is one-sided to explain ecological maintenance from the long-term series changes of ecological security, and the research on ecological maintenance can be further studied by adding the Moran index and factor diagnostic model.
Disclosure statement
No potential conflict of interest was reported by the authors.
Additional information
Funding
References
- Abebe S. 2012. Functional distances of woody species, proxy of ecological elasticity and provision for forest management. J Horticul Forest. 4:136–147.
- Al-Ali ZM, Abdullah MM, Assi AA, Alhumimidi MS, Wasan AQ, Ali TS. 2021. The immediate impact of the associated COVID-19’s lockdown campaign on the native vegetation recovery of Wadi Al Batin Tri-state desert. Remote Sens Appl Soc Environ. 23:100557.
- Alexakis DE. 2021. Linking DPSIR model and water quality indices to achieve sustainable development goals in groundwater resources. Hydrology. 8(2):90.
- Chu PY, Lin YL, Guo CS. 2016. The effect of ecological elasticity in Taiwan’s carbon reduction policies: the STIRPAT model. J Manage Sustain. 6(1):121–131.
- Di W, Shen Y, Zhao Y, He W, Liu X, Qian X, Lv T. 2020. Integrated assessment and obstacle factor diagnosis of China’s scientific coal production capacity based on the PSR sustainability framework. Res Policy. 68:101794., doi:10.1016/j.resourpol.2020.101794
- Duan Y, Wang X, Wei Y. 2020. Land use change analysis of Daishan Island using multi-temporal remote sensing imagery. Arab J Geosci. 13(15):741. doi:10.1007/s12517-020-05513-5
- Enping Y, Hui L, Guangxing W, Chaozong X. 2014. Changes and driving forces of ecosystem service value in the Three Gorges Reservoir area from 1990 to 2011. Acta Ecol Sinica. 34:5962–5973.
- F G, H L. 2018. Assessing the suitability of the distribution of street vendor spaces based on AHP and yaahp. IPPTA: Quar J Indian Pulp Paper Tech Assoc. 30(8)
- Fuzhou Municipal People’s Government. 2021. Notice of Fuzhou Municipal People’s Government on the implementation of “Three Lines and One Order”. Ecological Zoning Control. [2021 Jul 14]. http://www.fuzhou.gov.cn/zgfzzt/shbj/zz/hjzc/202111/t20211121_4249030.htm.
- Gaowen Y, Masahiro R, Julien R, Stefan H, C, RM. 2021. Plant and soil biodiversity have non-substitutable stabilising effects on biomass production. Ecol Lett. 24(8):1582–1593.
- Hong W, Liyang X, Guoan T, Josef S, Kaikai X. 2021. Spatial–temporal variation of land use and land cover change in the glacial affected area of the Tianshan Mountains. Catena. 202:105256.
- Hongfei Y, Xuanning Z, Siqi D, Hao X. 2021. Assessment of the impact of LUCC on NPP and its influencing factors in the Yangtze River basin, China. Catena. 206:105542. doi:10.1016/j.catena.2021.105542
- Huang W, Wang W, Cao M, Fu G, Xia J, Wang Z, Li J., 2021. Local climate and biodiversity affect the stability of China’s grasslands in response to drought. Sci Total Environ. 768:145482. doi:10.1016/j.scitotenv.2021.145482
- Huiqin L, Tinghong G, Peter N, Xuelian X, Jingjing L. 2020. Farmers’ livelihood adaptability in rural tourism destinations: an evaluation study of rural revitalization in China. Sustainability. 12(22):9544. doi:10.3390/su12229544
- Jianhui Q, Zhuang Y, Yongjian M. 2021. Sensitivity evaluation of cultivated land based on GIS for agricultural production-urban development-ecological maintenance. J Henan Polytechnic Univ (Nat Sci Ed). 40:78–88.
- Juan H, Xueyi S, Yangjun F. 2021. Identifying vegetation restoration effectiveness and driving factors on different micro-topographic types of hilly Loess Plateau: From the perspective of ecological resilience. J Environ Manage. 289:112562. doi:10.1016/j.jenvman.2021.112562
- Junling C. 2021. Study on land use change and land ecological security in Zhoushan Archipelago. IOP Conf Ser: Earth Environ Sci. 668(1):012019.
- Kaymaz AK, Birinci S, Kzlkan Y. 2021. Sustainable development goals assessment of Erzurum province with SWOT-AHP analysis. Enviro Develop Sustain. 24(3):2986–3012.
- Koppiahraj K, Bathrinath S, Mithun AS, Kumar PS. 2021. Key challenges to sustainable humanitarian supply chains: lessons from the COVID-19 pandemic. Sustainability. 13(11):5850.
- Kumar V, Agrawal S. 2019. Agricultural land use change analysis using remote sensing and GIS: a case study of Allahabad, India. ISPRS – International Archives of the Photogrammetry, Remote Sensing and Spatial Information Sciences XLII-3/W6.
- Kurup BM, Boopendranath MR, Harikrishnan M, Shibu AV. 2022. Impact of climate change on hydrological cycle, ecosystem, fisheries and food security. Taylor and Francis.
- Liu Y. 2021. Construction of the professional quality evaluation system of environmental impact assessment engineers based on yaahp software. E3S Web of Conferences 259.
- Liuwen L, Jianxin Q, Yongqiang L, Tingting L. 2015. Study on ecological elasticity of Hunan Province based on land use transition. Econ Geog. 35:16–23.
- Lu D, Yaobin L, Xiaoyi L. 2021. Integrating the MCR and DOI models to construct an ecological security network for the urban agglomeration around Poyang Lake, China. Sci Total Environ. 754:141868.
- Ma X. 2015. Build the structural model of risk assessment on the AHP method by Yaahp Software: a case study on housing fund. J Appl Sci Eng Innov. 2(6):212–215.
- Mandal T, Saha S, Das J, Sarkar A. 2022. Groundwater depletion susceptibility zonation using TOPSIS model in Bhagirathi River basin, India. Model Earth Syst Environ. 8(2):1711–1731. doi:10.1007/s40808-021-01176-7
- Mbaziira J. 2019. Land cover and land use change analysis: Its impacts on rangeland ecosystems in Kakooge County, Nakasongola district, Uganda. J Sci Sust Dev. 6(2):167–180. doi:10.4314/jssd.v6i2.9
- Mike P, Ghent DJ, Jiménez C, Dodd E, Ermida SL, Trigo IF, Veal KL. 2020. Multisensor Thermal Infrared and Microwave Land Surface Temperature Algorithm. Remote Sens. 12(24):4164.
- Peng C, Li B, Nan B. 2021. An analysis framework for the ecological security of urban agglomeration: a case study of the Beijing-Tianjin-Hebei urban agglomeration. J Clean Prod. 315:128111. doi:10.1016/j.jclepro.2021.128111
- People’s Government of Fujian Province. 2021. The fourteenth five-year plan of Fujian Province for National Economic and Social Development and the outline of the long-term Goal of 2035. Fujian Daily, 006:1473.
- Qianguo L, Lucang W, Nayab GH, Dan L. 2021. Simulation and optimization of land use pattern to embed ecological suitability in an oasis region: a case study of Ganzhou district, Gansu province, China. J Environ Manage. 287:112321. doi:10.1016/j.jenvman.2021.112321
- Qianna X, Xian Y, Ying Y, Shaopeng W, Michel L, Lin J. 2021. Consistently positive effect of species diversity on ecosystem, but not population, temporal stability. Ecol Lett. 24(10)
- Renyi Y, Wanying D, Zisheng Y. 2021. Spatiotemporal Evolution and Influencing Factors of Urban Land Ecological Security in Yunnan Province. Sustainability. 13(5):2936. doi:10.3390/su13052936
- Rogers KS. 1997. Ecological security and multinational corporations. WW Environmental Change and Security Project Report.
- Ruidong Z, Chuanglin F, Haimeng L, Xiaoxiao L. 2021. Evaluating urban ecosystem resilience using the DPSIR framework and the ENA model: a case study of 35 cities in China. Sustain Cities Soc. 72:102997.
- Shaohua Z, Peng S, Wengang Y, Zhanbin L, Peng L, Shutong Y. 2019. Health evaluation and obstacle factor diagnosis of land use system based on PSR model: A case study of Yanchang County. Soil Water Conserv Res. 26:283–289.
- Singh BM, Komal C, Rustam P, Alexander K. 2021. Eco-environmental quality assessment based on pressure-state-response framework by remote sensing and GIS. Remote Sens Appl Soc Environ. 23:100530.
- Somenguem DL, Alexander R, Florian E, Martin E, Bambang I, Dirk H, Alexander K, Holger K, J, SE, Leti S, Christian, et al. 2021. Microclimate and land surface temperature in a biodiversity enriched oil palm plantation. Forest Ecol Manage. 497:119480.
- Sonko S, Maksymenko N, Vasylenko O, Chornomorets V, Koval I. 2021. Biodiversity and landscape diversity as indicators of sustainable development. E3S Web Conf. 255:01046. doi:10.1051/e3sconf/202125501046
- Subhasis D, Biswajeet P, Pravat KS, Abdullah MA. 2020. Assessment of wetland ecosystem health using the pressure–state–response (PSR) model: a case study of Mursidabad District of West Bengal (India). Sustainability. 12(15):5932.
- Sun R, Wu Z, Chen B, Yang C, Qi D, Lan G, Fraedrich K. 2020. Effects of land-use change on eco-environmental quality in Hainan Island, China. Ecol Indicator. 109(C):105777. doi:10.1016/j.ecolind.2019.105777
- Tadjibaeva МК, Mambetullaeva SМ. 2021. Ecological assessment of population health indicators in the republic of Karakapakstan and their relationship with the environment. Asian J Multidimen Res AJMR. 10(3):167–172.
- Thorson JT, Adams CF, Brooks EN, Eisner LB, Kimmel DG, Legault CM, Rogers LA, Yasumiishi EM. 2020. Seasonal and interannual variation in spatio-temporal models for index standardization and phenology studies. ICES J Marine Sci. 77(5):1879–1892. doi:10.1093/icesjms/fsaa074
- Tu WY, Shao WY, Lin WM, Ci SC, Dong GJ. 2021. Assessing ecological health of mangrove ecosystems along South China Coast by the pressure–state–response (PSR) model. Ecotoxicology. 30(4):622–631.
- Usha G, Sangam S, Sanjiv N, S, M, Oranuj L. 2021. Climate and land-use change impacts on spatiotemporal variations in groundwater recharge: a case study of the Bangkok Area, Thailand. Sci Total Environ. 792:148370.
- Vytautas S, Alfas P, Juozas L, Vaidotas L, Dorota D, Jurga J, Rita V. 2018. Evaluation of early stage regeneration of forest communities following natural and human-caused disturbances in the transitional zone between temperate and hemiboreal forests. Baltic Forest. 24(1):131–147.
- WALZ q. 2000. Development of environmental indicators systems: experiences from Germany. Environ Manage. 25(6):613–623. doi:10.1007/s002670010048
- Wang D, Yu M, Mo W, Lv D, Cheng J, Sun L. 2021. Ecological safety evaluation for water resources of China based on pressure-state-response model: a case from Zhoushan Archipelago. NEPT. 20(2):601–612. doi:10.46488/NEPT.2021.v20i02.017
- Wei H, Zhang W, Zhang F, Sun G. 2020. Ecological security evaluation of Africa. Front Agr Sci Eng. 7(4):467. doi:10.15302/J-FASE-2020320
- Xi X, Wang S, Yao L, Zhang Y, Niu R, Zhou Y., 2021. Evaluation on geological environment carrying capacity of mining city – A case study in Huangshi City, Hubei Province, China. Int J Appl Earth Observ Geoinform. 102(1352):102410. doi:10.1016/j.jag.2021.102410
- Xiaoling K, Xingyue W, Haixiang G, Chang Y, Qi Z, Amal M. 2021. Urban ecological security evaluation and spatial correlation research––-based on data analysis of 16 cities in Hubei Province of China. J Cleaner Prod. :311:127613.
- Xiaoyong W, Lihe Y, Honglin MA, Zebing D, Jiaqiu D, Xueqin Z. 2021. The influence of change of land-use type on hydrological cycle. IOP Conf Ser: Earth Environ Sci. 671(1):012041. doi:10.1088/1755-1315/671/1/012041
- Xie X, Fang B, Li X, He S. 2021. Urban ecosystem health assessment and obstacle factor diagnosis using a comprehensive assessment model for Nanjing, China. Growth Change. 52(3):1938–1954. doi:10.1111/grow.12492
- Xin H, Guanghui J, Ruijuan Z, Wenqiu M, Tao Z. 2015. Temporal and spatial changes of land ecosystem health based on PSR model: a case study of Pinggu District, Beijing. J Nat Res. 30:2057–2068.
- Xuefen L. 2021. TOPSIS model with entropy weight for eco geological environmental carrying capacity assessment. Microprocess Microsyst. 82:103805. doi:10.1016/j.micpro.2020.103805
- Xueyan X, Zhonghao Z, Tao L, Shimeng S, Jun G. 2021. Mega-city region sustainability assessment and obstacles identification with GIS–entropy–TOPSIS model: A case in Yangtze River Delta urban agglomeration, China. J Clean Prod. 294:126147. doi:10.1016/j.jclepro.2021.126147
- Yalan X, Yiran L, Shiyao X, Guohui W, Ouping D. 2021. Multi-scale spatial correlation between vegetation index and terrain attributes in a small watershed of the upper Minjiang River. Ecol Indicator. 126 :107610.
- Yuanwei L. 2020. Evaluation of land ecological security in Zunyi City based on remote sensing and GIS. Jiangxi Agricultural University.
- Yunshu T, Xiaoyu Z, Jianling J. 2020. Ecological security assessment of Chaohu Lake Basin of China in the context of River Chief System reform. Environ Sci Pollut Res Int. 27(3):2773–2785.
- Yuyu W, Bixiao C, Peng D, Dian Z, Weiwei Y, Wenjia H, Zhiyuan M, Guangcheng C, Zhenghua L, Bin C. 2021. Simulating spatial change of mangrove habitat under the impact of coastal land use: coupling MaxEnt and Dyna-CLUE models. Sci Total Environ. 788:147914. doi:10.1016/j.scitotenv.2021.147914
- Zhang B, Zhou W. 2021. Spatial–temporal characteristics of precipitation and its relationship with land use/cover change on the Qinghai-Tibet Plateau, China. Land. 10(3):269. doi:10.3390/land10030269
- Zhang X, Leng H, Huang Y, Yan W. 2021. Evaluation of innovation driven capability and diagnosis of obstacle factors based on comprehensive index method–a case study of Qingdao Marine Industry. IOP Conf Ser: Earth Environ Sci. 634(1):012067. doi:10.1088/1755-1315/634/1/012067
- Zhencan Z, Songtao C, Wenhui C, Mengsi W, Sijia W, Bingqian C. 2019. Remote sensing monitoring and evaluation of ecological environment quality in Pingtan Comprehensive Experimental Area from 2007 to 2017. J Fujian Normal Univ (Nat Sci Ed). 35:89–97.
- Zhiwei Y, Yingbiao C, Guanhua G, Zihao Z, Zhifeng W. 2021. Characteristics of land surface temperature clusters: Case study of the central urban area of Guangzhou. Sustain Cities Soc. 73:103140.
- Ziyang W, Peiji S, Xuebin Z, Huali T, Weiping Z, Yue L. 2021. Research on landscape pattern construction and ecological restoration of Jiuquan City based on ecological security evaluation. Sustainability. 13(10):5732.
- Zuo D, Han Y, Xu Z, Li P, Ban C, Sun W, Pang B, Peng D, Kan G, Zhang R, et al. 2021. Time-lag effects of climatic change and drought on vegetation dynamics in an alpine river basin of the Tibet Plateau, China. J Hydrol. 600:126532., doi:10.1016/j.jhydrol.2021.126532