
 ?Mathematical formulae have been encoded as MathML and are displayed in this HTML version using MathJax in order to improve their display. Uncheck the box to turn MathJax off. This feature requires Javascript. Click on a formula to zoom.
Abstract
Previous research has shown that real estate serves as a diversifier in mixed-asset portfolios. However, this empirical finding is beset with some drawbacks associated with direct real estate investment. In order to overcome some of these drawbacks, we use theoretical real estate exchange traded notes (ETNs) in a mean-shortfall setting to optimize an international mixed-asset portfolio. In addition, the typical long-only strategy is abandoned in favor of a 130/30 long-short and an exchange rate hedge strategy. Not only in-sample but also out-of-sample portfolios yield significant diversification benefits by means of real estate ETNs in different portfolio strategies.
Real estate investments constitute an attractive asset class, particularly because of their low co-movements with stocks and bonds, low volatility, and hedge ability against inflation. Given the characteristic of real estate to enhance diversification, the integration of real estate into a stock and bond portfolio should reduce the risk of a mixed-asset portfolio. Nevertheless, investment in direct real estate is associated with several familiar drawbacks, for example, high transaction costs, large lot sizes, low liquidity, tying up of management resources, and the need for local market expertise. Furthermore, investors who wish to diversify in different currency regions face additional currency risks.
Indirect real estate investments can solve some of the above-mentioned disadvantages of direct real estate investments. Besides various investment vehicles, either listed or unlisted, open-end or closed-end, real estate derivatives are a young and developing form of investment for indirect real estate exposure. At a first glance, derivatives seem applicable for asset-allocation purposes through avoiding transaction costs and achieving higher diversification (see, e.g., Hsuku [Citation2007] or Haugh and Lo [Citation2001]). Real estate derivatives can be traded continuously in regulated financial markets, thus potentially lowering transaction costs and raising liquidity. Furthermore, only real estate derivatives can perfectly replicate a portfolio represented by real estate indices.
There are two major strands of literature on real estate derivatives. The first is oriented toward the application of real estate derivatives as protection for homeowners against declines in the prices of their homes. Consequently, this kind of product is based on home price indices (see, among others, Shiller and Weiss [Citation1999], Iacoviello and Ortalo-Magné [Citation2003], Deng and Quigley [Citation2008], or Baroni et al. [Citation2008]). The second strand concerns the construction and pricing of commercial real estate derivatives (see, among others, Buttimer et al. [Citation1997], Björk and Clapham [Citation2002], Geltner and Fisher [Citation2007], Lizieri et al. [Citation2012], or Rehring and Steininger [Citation2011]).
Both strands are important to get a deeper understanding of derivatives, but in this paper, we focus on the investment possibility of real estate index derivatives. To the best of our knowledge, we are the first to provide empirical evidence of the diversification potential of real estate derivatives in an international mixed-asset portfolio. This gap in the literature has probably been induced through the limited data on real estate derivatives. By using exchange traded notes (ETN) as the most practicable derivative form, we examine the potential of real estate derivatives to reduce the risk and enhance the performance of an international mixed-asset portfolio. ETNs are typically senior, unsecured, unsubordinated debt securities issued by an underwriting issuer. ETNs are directly linked to the return of an index, less a fee, and can be traded and shorted on an exchange. Consequently, they combine the typical characteristics of equities—fungibility, short selling, liability, and no rating—with the typical characteristics of debt securities—maturity date, no voting rights, no dividend distributions, and backed by the credit of the issuer. ETNs give investors exposure to the physical real estate market and real liquidity, if continuously traded on a stock exchange, and also entail low initial investments. All factors are essential for an efficient market, especially for financial products designed for private investors. ETNs are designed so that their risk/return characteristics are almost identical to the underlying indices. This product is ideal for our purposes because its returns can easily be replicated using the time series of modified real estate index returns, even though ETNs have not yet appeared in real estate markets all over the world. In this paper, we construct virtual products for several national real estate markets, where appraisal-based indices are available. We examine the diversification potential of these derivatives in a mixed-asset portfolio of stocks and bonds, using a mean-shortfall optimization. We include an out-of-sample and an in-sample perspective. Furthermore, we apply a 130/30 long/short strategy, which allows us to simultaneously hold both long, 130%, and short, 30%, positions. In addition, we also exploit the diversification potential of a currency hedging strategy, by using the Glen and Jorion (Citation1993) procedure, entailing forward contracts and optimal hedge ratios from a euro-area investor perspective.
This paper is organized as follows. The second section describes the data and research design. In the next section, we analyze a mixed-asset portfolio from an out-of-sample perspective. In this respect, we first focus on the dependency of diversification potential of international real estate investments on the currency region and currency hedging strategy. We then emphasize the 130/30 short-selling strategy, the effects of integrating real estate derivatives into international portfolios, and their dependency on exchange rate risk hedging. The penultimate section follows the same approach from an out-of-sample perspective. The final section concludes.
Data and Research Design
Data
The study is based on data from 1996 to 2009. The time span is limited by the data availability on the underlying for the real estate derivatives. The historical time series for the stock, bond, and real estate markets are included for the USA, the UK, France (FRA),Footnote1 and Germany (GER). These countries are selected as representatives of the international financial world by virtue of their market capitalization and turnover. illustrates the invested market size for the stock, bond, and real estate market in billions of euros for the end of 2012.
Table 1. Market size in billions of euros as of the end of 2012.
We use the national MSCI Equity Indices and Thomson Reuters Bond Indices as proxies for stock and bond market investments. Because we adopt the perspective of a euro-based investor, the risk-free rate is represented by the three-month Euro Interbank Offered Rate (EURIBOR). For the period prior to the introduction of the EURIBOR (January1996 to December 1998), the EURIBOR calculation is reproduced by a weighted and truncated average of interbank rates among the members of the European Monetary Union.
This study approaches the investment vehicles of real estate derivatives through virtual index-linked notes. Such financial instruments are basket products based on an index. In principle, there are three different index types available: appraisal-based, transaction-based, or indices of stock-quoted real estate companies or REITs. Derivatives based on real estate companies or REITs are quite widespread as a result of the easy access to such indices but, as these indices may also be influenced by non–real estate business of the companies and are highly correlated with stock markets in the short run, it is seriously questionable whether these underlyings can validly serve as real estate proxies (see, e.g., Li and Wang [Citation1995], Karolyi and Sanders [Citation1998], Pagliari et al. [Citation2005], or Hoesli and Camilo [Citation2007]). Other financial instruments use transaction-based indices as the underlying. In the US, the S&P/Case Shiller Index reaches a volume of approximately 1 billion euros with products traded on the Chicago Mercantile Exchange. The trading volume of the Residential Property Index (RPX), as the most active underlying for the residential market, is about 1.5 billion euros. In the UK, the predominant transaction-based index is the Halifax House Price Index of HBOS, a monthly house series for different categories of houses and regions. The index is based on mortgage data, typically covering around 15,000 house purchases per month. However, most real estate derivatives use appraisal-based indices as the underlying. In almost all countries worldwide, the predominant appraisal-based indices are those of Investment Property Databank (IPD; now owned by MSCI). Due to the fact that IPD publishes indices with a consistent method of calculation in all markets, we use the IPD series for the UK, FRA, and GER. In the US, the NCREIF Property Index (NPI) is currently the most actively applied appraisal-based index for commercial real estate derivatives. In the UK, the IPD UK Total Return All Property Index is applied for most real estate derivatives. The most frequently used products are real estate swaps against a fixed rate. Because of their comparably large lot size, the holders are usually institutional investors.
shows the size of all derivative products on IPD Indices until Q2 2010. The volume of the OTC shares of these markets is not usually published but can be estimated by indicators such as license fees of the banks for the use of the indices. For the US market, the information is even more limited, as licensing agreements are more restrictive. Consequently, no reliable size of the real estate derivatives is published in the USA.
Table 2. Real estate derivatives market in millions of euros as of Q2 2010.
An alternative to swaps for retail customers are ETNs, such as the similarly constructed IPD UK Annual Total Return All Property Index tracker of Goldman Sachs. The lot size is as small as 10 GBP and annual investor fees are 2.8%. This ETN was quoted on the London Stock Exchange. IPD also publishes a monthly and quarterly index, which acts as an anchor function for the permanent market price-fixing of the note on the London Stock Exchange. Until now, real estate ETNs have not been traded in other countries. Even for the UK, the first note was issued in July 2006 and only for a long position. Therefore, we deploy our own approach to modeling ETN return series. Assuming sufficient price competition, which is usually provided by designated sponsors, the price of the note should match the current IPD Index minus fees. For the USA, we use the quarterly NPI index, and we use the IPD French Property Index and the IPD German Property Index for France and Germany, respectively. The French and German indices are only computed annually, so that we apply a cubic spline interpolation to generate a higher frequency for these countries.Footnote2 Investor fees are implemented using the approach of Goldman Sachs for the UK. They deduct a fee of 2.8% from the annual UK IPD total return, so as to simulate the total annualized cost of buying a UK commercial property unit trust and selling it after 5 years. For all other countries, we follow this approach and calculate the average fee of real estate funds.Footnote3
Descriptive Statistics
The descriptive statistics of the returns are reported in . In all countries, the means of stock market returns are greater than those of real estate ETN markets. These in turn exceed those of bond markets, which have the lowest returns. The German real estate ETN return is an exception, with the lowest return in all countries. Even when taking into account that real estate returns are adjusted by investor fees for the calculation of our modeled ETNs, the level remains low. However, this reflects the normal return characteristic in the German real estate market. Corresponding with normal market conditions, the country-specific standard deviations of bond markets are less than those of real estate markets, which are also less than those of stock markets. These results prevail for all countries. The empirical skewness supports the assumption of asymmetric return distribution. The negative values of all stock markets display left tails. By contrast, bond returns are mostly right-skewed—except for the USA, where the left tail is larger. Real estate returns yield strong left tails for the USA and UK, while for France and Germany, weak left-skewed distributions prevail. The excess kurtosis of the stock yields slightly positive values, with leptokurtic characteristics. On the bond markets, the empirical excess kurtosis is platykurtic, except for the UK which is leptokurtic. The values of real estate ETNs for the USA and UK are remarkably highly leptokurtic, whereas the kurtosis for FRA and GER is marginally platykurtic.Footnote4
Table 3. Descriptive statistics (1996–2009).
The assumption of elliptically distributed returns such as normally distributed returns is necessary for the application of mean-variance analysis. The p values of the Lomnicki-Jarque-Bera test (LJB) and the Kolmogorow-Smirnow-Lilliefors test (KSL) suggest that the null hypothesis of normally distributed returns for the bond market in the UK and the real estate market in the USA and UK, with a significance level of 5%, must be rejected. The low kurtosis values, in combination with low standard deviations for the real estate market in France and Germany, cause a non-rejection of the null hypothesis.
International Asset Allocation in a Shortfall-Risk Framework
The application of modern portfolio theory (MPT) to real estate is often criticized due to the fact that real estate returns are neither independent and identically nor normally distributed. In order to overcome some of the problems of traditional mean-variance analysis, a mean-shortfall concept is adopted in this study. A few studies have applied this concept to real estate, such as Sivitanides (Citation1998), Sing and Ong (Citation2000), and Maurer and Reiner (Citation2002). While the theoretical aspects of the downside risk are well documented in the literature, empirical evidence on which approach produces superior portfolios has not been convincing. Sivitanides (Citation1998) and Sing and Ong (Citation2000) adopted similar approaches to compare the mean-shortfall with the mean-variance analysis. However, as Cheng and Wolverton (Citation2001) pointed out, their comparison methods are logically flawed, because the two approaches use different risk measures and are therefore not directly comparable. Consequently, we focus only on the downside-risk approach. We include an in-sample and an out-of-sample perspective.
Furthermore, we include a short-selling position of 30%. Since Grinold (Citation1989), several researchers, including Johnson et al. (Citation2007), Sorensen et al. (Citation2007), and Clarke et al. (Citation2008), have suggested that traditional long-only portfolios could enhance their performance with limited short-selling strategies. A long-only portfolio limits investor ability to generate performance, because they are constrained in their investment decisions, to one side of the market. By contrast, active extension strategies (i.e. 1X0/X0 long-short portfolioFootnote5) attempt to increase the alpha through active portfolio management, while having the same beta net exposure to the market as the traditional long-only strategy. The leveraged structure of an active extension portfolio figures the properties of any leveraged portfolio. Admittedly, the gross and net exposure differ. Both exposures of a 1X0% leveraged long-only portfolio are 1X0%, whereas for a 1X0/X0 portfolio, the gross exposure is 1X0% and the net exposure only 100. Grinold (Citation1989) demonstrates that the portfolio’s efficiency, measured by the information ratio, increases when the long-only constraint is removed. They reason that a fully leveraged 200/100 portfolio achieves the highest information ratio and efficiency benefit compared to a long-only portfolio. In this context, more leverage is better. In contrast, other studies have shown that an increase in X reduces marginal utility, so that taking transaction costs into account, the utility and costs must be traded off against each other. Clarke et al. (Citation2008) find the marginal benefit of relaxing the assumption of short sales diminishing, which means that the benefit of going from 100/0 (long-only) to 120/20 is larger than that of going from 120/20 to 140/40. Even with a 130/30 portfolio, 90% of the improvement in transfer coefficient, relative to a 200/100 portfolio, is achieved. Johnson et al. (Citation2007) find further evidence that a 130/30 constrained long-short strategy can add substantial value to traditional long-only strategies, without adding much incremental risk. Although the percentage that can be sold short typically ranges from 20% to 50%, 30% seems to be emerging as the most widely used in practice. Consequently, we adopt the 130/30 variation.Footnote6
Currency risk represents a fundamental drawback for internationally diversified investments. Hedging the currency exposure could minimize this problem, although this approach is not free of charges, which in turn influences the diversification potential. For example, Eaker et al. (Citation1991), Kaplanis and Schaefer (Citation1991), and Glen and Jorion (Citation1993) have investigated this issue with respect to international bond and stock markets and concluded that there are significant performance differences between hedged and unhedged portfolios. Furthermore, the diversification potential depends on the reference currency of the investor. Several empirical studies (e.g., Liljeblom et al., Citation1997; Stevenson, Citation2000; and Hoesli et al., Citation2004) deal with the extent to which diversification arises from international investments for investors in different currency regions. Thus, we also apply the diversification potential of a currency hedging strategy using the Glen and Jorion (Citation1993) approach with forward contracts and optimal hedge ratios from a euro-area investor perspective.
Consequently, portfolio optimization is conducted for an investor who is risk-averse regarding below-target returns and considers risk as the downside-deviation from the risk-free interest rate; in short for lower partial moment: LPM. In the context of risky investment decisions, a risk-free investment is the intuitive and logical reference point, which can always be earned. The portfolio optimization problem can be specified by minimizing the portfolio variance as follows:
(1)
(1)
subject to the constraints:
where:
T = number of observed periods;
= mean return on asset i;
= portfolio return;
xi = portfolio weight of asset i; and
rf;t = risk-free rate at period t.
The LPM-covariance matrix of the mean-shortfall optimization problem is endogenous, unlike the covariance matrix used in mean-variance optimizations. Hence, optimal portfolios cannot be determined without resorting to numerical algorithms. Many researchers propose different ways of tackling the problem of endogeneity (e.g., see Hogan & Warren, Citation1972; Nawrocki & Staples, Citation1989; Markowitz et al., Citation1993; Grootveld & Hallerbach, Citation1999; Ballestero, Citation2005; or Estrada, Citation2008).
In order to overcome this drawback, Estrada (Citation2008) approximates and confirms the accuracy of the optimization problem as follows:
(2)
(2)
where:
This definition yields a symmetric and exogenous matrix and can be used in the same way as a covariance matrix in mean-variance optimization. The following mean-shortfall optimization is based on this LPM-covariance matrix.
As the third constraint defines, short selling is not excluded. In the meantime, many jurisdictions have been easing the short regulations and, according to the popular 130/30 fund structure, short sales are often limited to 30% of the overall investment volume.
Taking into account that the returns are earned in different currency areas, the return must be converted into euros by using the cross-product of total and exchange rate returns as defined in Equationequation 3(3)
(3) below:
(3)
(3)
where:
= uncertain return on asset i in country a; and
ea = exchange rate return between euro and foreign currency.
The uncertain return R on asset alternative i in the foreign currency area a must be multiplied by the exchange rate return ea to obtain comparable euro measured returns. The exchange rate between the euro and the foreign currency areas in country a in period t is defined as:
(4)
(4)
where:
S = spot rate using the direct quotation.
The approach of Glen and Jorion (Citation1993), who simultaneously determine the optimal portfolio weights and hedge ratios for each asset class, was applied to the optimal currency-hedging strategy using currency forward. Consequently, investors must expand Equationequation 3(3)
(3) by
(5)
(5)
Where forward premium fa between currency a and euro is defined as:
(6)
(6)
where:
= forward price at time t-1 for delivery of the currency at time t from the perspective of the home country; and
hi = hedge ratio.
The hedge ratio hi determines the part of the initial investment budget that is sold forward. Thus, negative forward positions are excluded, the hedge ratio reaches the following values: 0 ≤ hi ≤ 1 with i = 1,2,…,N, where hi = 0 implies an unhedged currency exposure and hi = 1 respectively an unitary hedge ratio of the investment.
In-Sample Diversification
Efficient Mean/LPM Sets
gives an overview of the diversification potential and illustrates the efficient sets with and without real estate ETNs and with and without currency hedging in the LPM/mean space.
Figure 1. Efficient sets in a mean/LPM framework.
Note: This figure shows the efficient frontiers of four different portfolios in a risk-return spectrum. These are (1) stocks and bonds, (2) stocks, bonds, and real estate ETNs, (3) previous assets within a 130/30 long-short portfolio, and (4) previous portfolio in a currency hedged setting. The expected return is represented by the mean per quarter of each portfolio and risk by LPM. The lines are the interpolation of estimated data by a second-degree polynomial.
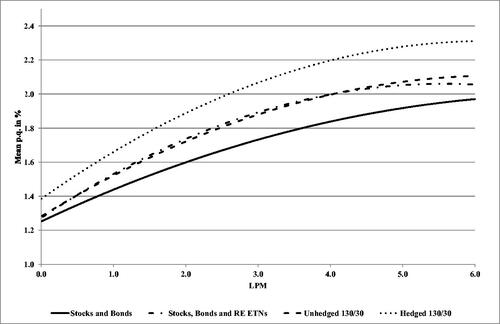
The integration of real estate derivatives to a portfolio results in a shift of the convex efficient frontier; thereby the optimization adjustment is relatively small in the lower LPM space and stronger in the upper space. Also, the 130/30 structure entails only a small improvement in the lower LPM space. The optimal currency hedging enhances the mean/LPM characteristic. Briefly, risk-seeking investors benefit from the integration of derivatives and currency hedging to a larger extent than risk-averse investors. Also, the currency hedging entails the largest improvement.
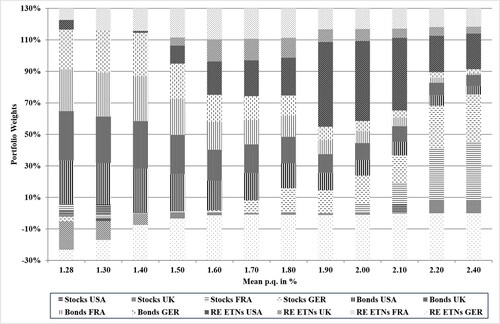
The composition of the efficiently hedged 130/30 long-short portfolio along the frontier is shown exemplarily in . The stock proportion over all countries starts with 7% in the 1.28% return scenario and ends with 47% in the 2.4% return scenario. Initially, bonds are held with 69% and their proportion decreases to 10%. The real estate ETNs share starts with 24% and ends with 43%. also shows the breakdown inside of the single assets. Interestingly, the German real estate ETN investment is consistently shorted because of the low returns—and even negative between 2004 and 2006—in Germany.
Figure 2. Composition of a hedged 130/30 long-short portfolio.
Note: This figure shows the weights of all 12 assets in the efficiently hedged 130/30 long-short portfolios along the efficient frontier. Stocks are shown horizontally, bonds are shown vertically, and real estate exchange traded notes (ETNs) are in the dotted areas.
Portfolio Strategies
For a detailed consideration of the diversification potential, three different portfolio types are analyzed: the equally weighted portfolio (EWP), the minimum-risk portfolio (MRP), and the tangency portfolio (TP). The simplest approach is the EWP, which is composed in equal shares of all investment alternatives. Although this diversification strategy could be optimized from the viewpoint of an in-sample analysis, it represents an easy possibility to diversify. Second, the MRP is the particular combination of all investment alternatives with the lowest possible risk. Finally, the TP is characterized as the combination of all investment alternatives that maximizes the risk-adjusted returns. Consequently, there is no other portfolio with higher returns per unit of risk. The portfolio with the highest Sortino ratio is the TP. The Sortino ratio is a modification of the Sharpe ratio which replaces the standard deviation by a user-specified downside risk.
Return/Risk Characteristics of the Selected Portfolios
shows the mean returns, LPMrf1 and the Sortino ratios of the international portfolios. According to the Sortino ratio, the extension of the investment alternatives to the real estate derivatives entails significant performance improvements for all observed unhedged, 130/30, and hedged portfolios. The improvements of the performance measures result from a risk reduction, measured according to the LPMrf1.
Table 4. Return/risk characteristics for the in-sample optimization.
The currency hedging strategy shows high Sortino ratios mainly due to substantial risk reductions. Also, the 130/30 strategy causes in both cases—with and without real estate derivatives—a risk-adjusted performance improvement of the MRP and TP, which has already been observed in the analysis of the efficient sets. This improvement is caused by an increase in the mean returns and especially by a reduction in the LPMrf1.
Portfolio Structures
provides the investment weights of the in-sample optimal portfolios. The integration of real estate derivatives into the portfolios increases the share of real estate for the 130/30 structure and hedged 130/30 structure. The aggregated real estate investment weight starts—using the 130/30 strategy—with 0.6% for the MRP and TP. By the additional application of the currency hedging strategy, derivatives’ absolute weights grow to 23.8% for the MRP and 25.3% for the TP. The results attest to the positive contribution of real estate for the asset allocation in terms of risk reduction and partly for performance increase—taking and into account.
Table 5. Optimal weights for the in-sample optimization.
Out-of-Sample Diversification
Research Configuration
The improvement in in-sample portfolio performance should also be corroborated for out-of-sample observations. In order to test the integration of real estate ETNs into the portfolio construction with respect to performance improvements, the same portfolios that were already analyzed in the in-sample study—EWP, MRP, and TP—are applied. The performance of the different strategies is evaluated by a back-testing procedure. The research design is separated into two parts: the estimation and the holding period. The estimation period includes 16 quarters and the holding period of two quarters follows immediately. During the estimation period, the optimal portfolio weights of the MRP and TP strategies are determined and subsequently applied to the holding period. The estimation and the holding period are then shifted two quarters forward and the optimization approach is repeated. The estimation period commences in 1996 and the holding period in 2000. Altogether, 40 independent out-of-sample returns are observed. In addition, the total holding period was divided into two back-testing subperiods of 20 quarters—from Q1 2000 to Q4 2004 and from Q1 2005 to Q4 2009—in order to check the stability of the results.
Performance of the Strategies
Using the out-of-sample perspective, summarizes the mean returns, LPMrf1, and the Sortino ratios of the international portfolios. In all total out-of-sample periods, remarkable increases in return or decreases of risk can be observed for all strategies after adding real estate ETNs. Even if this is not observed for all strategies and for all sample periods, an increase in the Sortino ratio is predominant, with the exception of the unhedged 130/30 structure strategy. In the cases of hedged 130/30 structure, real estate ETNs improve the situation for investors. The general observations above are confirmed for both subperiods. The portfolios entail average performance improvements or risk deductions after adding real estate derivatives and after implementing the unhedged 130/30 structure or hedged 130/30 structure.
Table 6. Return/risk characteristics for the out-of-sample optimization.
Conclusion
The purpose of this paper is to identify the application potential of real estate derivatives and to evaluate the diversification possibilities of real estate derivatives in internationally diversified portfolios. The potential of real estate ETNs was attested in a mean/LPM framework from the perspective of a euro investor. For this purpose, the stock, bond, and real estate derivative returns for the USA, UK, France, and Germany were examined from 1996 to 2009 and subjected to an in-sample and out-of-sample performance analysis. Despite the theoretical evidence of ETN performance, based on adjusted real estate index returns, the advantages of derivative application are prevailing in the examined period. The results of different asset allocation strategies provide evidence for the diversification potential of ETNs. From the in-sample perspective, significant diversification benefits emerged for investors through the consideration of real estate ETNs in all portfolio strategies—EWP, MRP, and TP. The main source of these diversification gains was risk reduction. The additional application of the optimal currency hedging also yielded improvements on average, based on risk reduction.
For the out-of-sample perspective, the integration of real estate ETNs entails, in almost all portfolio strategies, a risk reduction relative to the corresponding stock and bond strategies. In the context of the risk-adjusted performance measure, considerable efficiency increases could be identified for almost all portfolio strategies. The analysis of the two equal out-of-sample subperiods suggests that the consideration of real estate derivatives and exchange risk hedging become eminently attractive in a tight economic situation. The diversification potential of derivatives mainly takes the form of risk reduction.
Acknowledgment
We would like to thank the anonymous referees for the very helpful suggestions, and we are also grateful for the comments by editor Simon Stevenson and the other participants at the “Real Estate Investment in a Changing World” Conference in May 2016 in London.
Notes
1 Although the base date for the French index is December 1997, an index based on office and residential returns can be calculated since 1986.
2 The interpolation technique allows us to compute the optimizations on a quarterly basis. The interpolation has no relevant influence on the mean. The deviation for the volatility and serial correlation is within an acceptable range compared to deviation between the original and interpolated data for the USA and the UK.
3 The fees are based on the published data of Morningstar in 2009.
4 By applying the spline interpolation for the real estate markets in France and Germany, the returns are smoothed. Under the assumption of unsmoothed returns, the standard deviations, skewness, and kurtosis were higher. However, the moments yield an acceptable deviation in the USA and the UK. We compare the original and interpolated data for these countries.
5 We use the simplified expression 1X0/X0 for each possible long-short portfolio with a varying short position from 0 to 100 and a corresponding long position from 100 to 200.
6 In the US, for example, the short portion of funds is limited to 50 percent according to the Federal Reserve Board Regulation T (Title 12, Part 220.12 of the Code of Federal Regulations).
References
- Ballestero, E. (2005). Mean-semivariance efficient frontier: A downside risk model for portfolio selection. Applied Mathematical Finance, 12(1), 1–15. https://doi.org/https://doi.org/10.1080/1350486042000254015
- Baroni, M., Barth´el´Emy, F., & Mokrane, M. (2008). Is it possible to construct derivatives for the Paris residential market? The Journal of Real Estate Finance and Economics, 37(3), 233–264. https://doi.org/https://doi.org/10.1007/s11146-008-9114-6
- Björk, T., & Clapham, E. (2002). On the pricing of real estate index linked swaps. Journal of Housing Economics, 11(4), 418–432. https://doi.org/https://doi.org/10.1016/S1051-1377(02)00121-3
- Buttimer, R. J., Kau, J. B., & Slawson, V. (1997). A model for pricing securities dependent upon a real estate index. Journal of Housing Economics, 6(1), 16–30. https://doi.org/https://doi.org/10.1006/jhec.1997.0202
- Cheng, P., & Wolverton, M. (2001). MPT and the downside risk framework: A comment on two recent studies. Journal of Real Estate Portfolio Management, 7(2), 125–131. https://doi.org/https://doi.org/10.1080/10835547.2001.12089636
- Clarke, R., de Silva, H., Sapra, S. G., & Thorley, S. (2008). Long-short extensions: How much is enough? Financial Analysts Journal, 64(1), 16–30. https://doi.org/https://doi.org/10.2469/faj.v64.n1.4
- Deng, Y., & Quigley, J. (2008). Index revision, house price risk, and the market for house price derivatives. The Journal of Real Estate Finance and Economics, 37(3), 191–209. https://doi.org/https://doi.org/10.1007/s11146-008-9113-7
- Eaker, M., Grant, D. M., & Woodard, N. (1991). International diversification and hedging: A Japanese and U.S. perspective. Journal of Economics and Business, 43(4), 363–374. https://doi.org/https://doi.org/10.1016/0148-6195(91)90032-R
- Estrada, J. (2008). Mean-semivariance optimization: A heuristic approach. Journal of Applied Finance, 18(1), 57–72.
- Geltner, D., & Fisher, J. (2007). Pricing and index considerations in commercial real estate derivatives. The Journal of Portfolio Management, 33(5), 99–118. https://doi.org/https://doi.org/10.3905/jpm.2007.698910
- Glen, J., & Jorion, P. (1993). Currency hedging for international portfolios. The Journal of Finance, 48(5), 1865–1886. https://doi.org/https://doi.org/10.1111/j.1540-6261.1993.tb05131.x
- Grinold, R. C. (1989). The fundamental law of active management. The Journal of Portfolio Management, 15(3), 30–37. https://doi.org/https://doi.org/10.3905/jpm.1989.409211
- Grootveld, H., & Hallerbach, W. (1999). Variance vs downside risk: Is there really that much difference? European Journal of Operational Research, 114(2), 304–319. https://doi.org/https://doi.org/10.1016/S0377-2217(98)00258-6
- Haugh, M. B., & Lo, A. W. (2001). Asset allocation and derivatives. Quantitative Finance, 1(1), 45–72. https://doi.org/https://doi.org/10.1080/713665551
- Hoesli, M., & Camilo, S. M. (2007). Securitized real estate and its link with financial assets and real estate: An international analysis. Journal of Real Estate Literature, 15(1), 59–84. https://doi.org/https://doi.org/10.1080/10835547.2006.12090193
- Hoesli, M., Lekander, J., & Witkiewicz, W. (2004). International evidence on real estate as a portfolio diversifier. Journal of Real Estate Research, 26(2), 161–206. https://doi.org/https://doi.org/10.1080/10835547.2004.12091136
- Hogan, W. W., & Warren, J. M. (1972). Computation of the efficient boundary in the E-S portfolio selection model. The Journal of Financial and Quantitative Analysis, 7(4), 1881–1896. https://doi.org/https://doi.org/10.2307/2329623
- Hsuku, Y.-H. (2007). Dynamic consumption and asset allocation with derivative securities. Quantitative Finance, 7(2), 137–149. https://doi.org/https://doi.org/10.1080/14697680601077959
- Iacoviello, M., & Ortalo-Magné, F. (2003). Hedging housing risk in London. Journal of Real Estate Finance and Economics, 27(2), 194–209.
- Johnson, G., Ericson, S., & Srimurthy, V. (2007). An empirical analysis of 130/30 strategies domestic and international 130/30 strategies add value over long-only strategies. The Journal of Alternative Investments, 10(2), 31–42. https://doi.org/https://doi.org/10.3905/jai.2007.695265
- Kaplanis, E. C., & Schaefer, S. M. (1991). Exchange risk and international diversification in bond and equity portfolios. Journal of Economics and Business, 43(4), 287–307. https://doi.org/https://doi.org/10.1016/0148-6195(91)90027-T
- Karolyi, G. A., & Sanders, A. B. (1998). The variation of economic risk premiums in real estate returns. The Journal of Real Estate Finance and Economics, 17(3), 245–262. https://doi.org/https://doi.org/10.1023/A:1007776907309
- Li, Y., & Wang, K. (1995). The predictability of REIT returns and market segmentation. Journal of Real Estate Research, 10(4), 471–482. https://doi.org/https://doi.org/10.1080/10835547.1995.12090800
- Liljeblom, E., Löflund, A., & Krokfors, S. (1997). The benefits from international diversification for Nordic investors. Journal of Banking & Finance, 21(4), 469–490. https://doi.org/https://doi.org/10.1016/S0378-4266(96)00053-2
- Lizieri, C., Marcato, G., Ogden, P., & Baum, A. (2012). Pricing inefficiencies in private real estate markets using total return swaps. The Journal of Real Estate Finance and Economics, 45(3), 774–803. https://doi.org/https://doi.org/10.1007/s11146-010-9268-x
- Markowitz, H. M., Todd, P., Xu, G. L., & Yamane, Y. (1993). Computation of mean-semivariance efficient sets by the critical line algorithm. Annals of Operations Research, 45(1), 307–317. https://doi.org/https://doi.org/10.1007/BF02282055
- Maurer, R., & Reiner, F. (2002). International asset allocation with real estate securities in a shortfall risk framework: The viewpoint of German and U.S. investors. Journal of Real Estate Portfolio Management, 8(1), 27–43. https://doi.org/https://doi.org/10.1080/10835547.2002.12089656
- Nawrocki, D., & Staples, K. (1989). A customized LPM risk measure for portfolio analysis. Applied Economics, 21(2), 205–218. https://doi.org/https://doi.org/10.1080/759368544
- Pagliari, J. L., Scherer, K. A., & Monopoli, R. T. (2005). Public versus private real estate equities: A more refined, long-term comparison. Real Estate Economics, 33(1), 147–187. https://doi.org/https://doi.org/10.1111/j.1080-8620.2005.00115.x
- Rehring, C., & Steininger, B. (2011). An empirical evaluation of normative commercial real estate swap pricing. The Journal of Portfolio Management, 37(5), 154–169. https://doi.org/https://doi.org/10.3905/jpm.2011.37.5.154
- Shiller, R. J., & Weiss, A. N. (1999). Home equity insurance. The Journal of Real Estate Finance and Economics, 19(1), 21–47. https://doi.org/https://doi.org/10.1023/A:1007779229387
- Sing, T. F., & Ong, S. E. (2000). Asset allocation in a downside risk framework. Journal of Real Estate Portfolio Management, 6(3), 213–223.
- Sivitanides, P. S. (1998). A downside-risk approach to real estate portfolio structuring. Journal of Real Estate Portfolio Management, 4(2), 159–168. https://doi.org/https://doi.org/10.1080/10835547.1998.12089561
- Sorensen, H., Hua, R., & Qian, B. (2007). Aspects of constrained long-short equity portfolios. The Journal of Portfolio Management, 33(2), 12–20. https://doi.org/https://doi.org/10.3905/jpm.2007.674790
- Stevenson, S. (2000). International real estate diversification: Empirical tests using hedged indices. Journal of Real Estate Research, 19(1), 105–131. https://doi.org/https://doi.org/10.1080/10835547.2000.12091009