
ABSTRACT
Spatial information is limited for artisanal fisheries management and almost entirely absent for migrant fishers. Here, we addressed this data gap for East African migrant fishers via participatory mapping methods. We worked with 14 migrant fishing vessels operating from four fish landing sites in Kenya. We monitored individual vessels using GPS tracking to produce fishing ground intensity maps. We then generated fishing preference maps via focus group discussions. The fishing intensity maps provided high-resolution spatial information on fishing activities, whereas the fishing preference maps identified preferred fishing grounds. These two techniques generally showed high agreement. By further integrating these two fisher coproduced maps with supplemental vessel logbook data, it is clear that any spatial management measures would most affect migrant fishers using ringnets, hook and line, and cast nets gear. Our successful application of low-technology participatory mapping techniques to provide geospatial fisheries data have broad application to data poor fisheries worldwide.
Introduction
Artisanal fisheries are typically data poor. People participating in these fisheries usually operate on a small-scale, via low-technology methods, using small and/or traditional fishing vessels and gear, and are limited in range. In Kenya, for example, artisanal fishers tend to fish adjacent to their home landing site at inshore shallow reefs and lagoons, fishing for local consumption, and sale (Obura & Wanyonyi, Citation2001). Even less information is available on migrant fishers, which is a type of artisanal fisher that travels to fish away from their home fishing areas for periods ranging from a few weeks to few months (Wanyonyi, Wamukota, Tuda, Mwakha, & Nguti, Citation2016). Migrant fishers are flexible in their fishing practices and often operate in remote locations less accessible to fisheries management authorities (Binet, Failler, & Thorpe, Citation2012; Islam & Herbeck, Citation2013; Rosendo, Jiddawi, Joubert, Mechisso, & Brown, Citation2008). Consequently, fishing activities of migrant artisanal fishers, as in the case of Kenya, are particularly difficult to monitor and manage.
Migrant fishers in East Africa, mainly from Pemba and Zanzibar, arrive in large numbers along the Kenyan coast and are a common component of small-scale fisheries of this region. The importance of these fishing grounds to migrant fishers is evident as they often equal or outnumber local fishers at many fish landing sites (Wanyonyi, Wamukota, Mesaki, Guissamulo, & Ochiewo, Citation2016). The sources and destinations, as well migration patterns of migrant fishers are well documented (Fulanda et al., Citation2009; Wanyonyi et al., Citation2016), but the location of their main fishing grounds are not well understood (Scholz, Steinback, Kruse, Mertens, & Silverman, Citation2011). The lack of understanding the spatial extent and fishing patterns of migrant fishers prevents their integration into local resource management processes (Campbell, Stehfest, Votier, & Hall-Spencer, Citation2014). There is an urgent need to fill this information gap due to the fast growing numbers of artisanal fishers in the region (Ochiewo, Citation2004).
Typically, artisanal fisheries are assessed via catch estimates from fish landings sites, whereas the intensity of resource extraction is assessed separately through ecological surveys that are seldom spatially explicit or linked to specific fishing grounds (McClanahan, Glaesel, Rubens, & Kiambo, Citation1997; McClanahan & Mangi, Citation2004). In industrial fisheries, the spatial distribution of fishing activity can be determined using surveillance data from observer vessels and electronic logbook catch data (e.g., Bastardie, Nielsen, Ulrich, Egekvist, & Degel, Citation2010; Forcada, Valle, Sánchez-Lizaso, Bayle-Sempere, & Corsi, Citation2010; St. Martin, Citation2006). In artisanal fisheries, however, small vessel size and the small-scale nature of the fisheries operations limit the application of such techniques. Data collection, therefore, employs methodologies based on self-sampling, logbooks, interviews, and direct observation (Cinner, McClanahan, & Wamukota, Citation2010; Kimani & Obura, Citation2007; Lokrantz, Nyström, Norström, Folke, & Cinner, Citation2009; Malleret-King et al., Citation2003; Mangi, Smith, & Catchpole, Citation2016). Spatial data collection in these fisheries has focused on the use of participatory methods such as sketch maps and diagrams drawn by fishers to document their spatial access and fishery resource uses (Kimani & Obura, Citation2007; Obura & Wanyonyi, Citation2001). The application of real time tracking to generate high-resolution human related spatial data in artisanal fisheries is more recent. Studies have assessed the fishing behavior of small-scale fishers following innovations such as the introduction of fish-aggregating devices to the fishery (Alvard, McGaffey, & Carlson, Citation2015).
The application of precise and cost-effective tools for objectively quantifying spatial aspects in artisanal fisheries remain limited (Cassels, Curran, & Kramer, Citation2005). In particular, the application of real time tracking technology has not yet been rolled-out in most artisanal fisheries. A geographic information system (GIS) offers a potential solution for collecting spatially explicit data on artisanal fisheries. GIS is defined as “a computing application capable of creating, storing, manipulating, visualizing, and analysing geographic information” (Dunn, Citation2007, pp. 616–617). A GIS consists of a complex interconnection of three essential components: computer hardware, GIS software, and trained human personnel that can be applied in a particular situation. It is not cheap to setup a GIS, as a modern computer capable of running this system costs about US$2,100, the ArcGIS software is US$1,700, and personnel require specialized GIS training to run the analysis and produce useful final map outputs. In addition, a GIS requires large and accurate datasets to run. The application of GIS technology in many other spheres of developing country settings faces similar issues and challenges (Sipe & Dale, Citation2003). The application of GIS to artisanal fisheries, particularly the collection of spatially explicit data on human related aspects of the fisheries, is also a challenge.
One potential solution is through participatory GIS (PGIS). PGIS is a data collection method that gives greater privilege and legitimacy to local or indigenous spatial knowledge and emphasizes community involvement in the production and/or use of geographical information (Dunn, Citation2007, pp. 616–617). PGIS involves the resource users in research (in this case, fishers), enabling the prioritization of the collection of information that is most relevant to them. It includes intermediate outputs in the form of maps that can be immediately useful and the final outputs are processed from a centralized GIS, limiting the costs.
Study Objectives
The main goal of our multi-method study was to characterize the migrant fishing fleet operating off the Kenyan coast. Specifically, our objectives were to: (a) document the spatial fishing patterns of migrant fishers using fishing preference mapping and GPS tracking, (b) compare fishing preference maps generated by fishers with the GPS-tracking data, and (c) integrate the GPS-tracking data with fishing vessel logbook data to generate scores of importance for fishing grounds per landing site. We achieve this via an interdisciplinary approach to demonstrate the utility of PGIS to collect and map high-resolution and reliable information on fishing behavior and target resources of artisanal fishers. By following migrant fishers at four sites in Kenya to identify the fishing areas they frequently use and getting fishers to map their preferred fishing grounds, we present a novel way of gathering much needed data that could be applied to migratory fishers elsewhere around the world.
Methods
Study Location
Nearshore coastal fisheries in Kenya are governed at the local level by a beach management authority (BMU). The BMU controls access to fishing grounds and landings via the local fish landing site. Migrant fishers seek permission from this authority to fish in the local community’s waters. Typically, permission is sought upon arrival into an area to fish these waters and to land catch at the particular landing site for the duration of their migration (Wanyonyi et al., Citation2016). Migrant fishers who arrive at the destination together and belong to the same fishing crew would return home together, usually after 1–7 months (Wanyonyi et al., Citation2016). The main destination landing sites and places of origin of migrant fishers in East Africa have been identified (Fulanda et al., Citation2009; Wanyonyi et al., Citation2016). Our study focuses on four of the most common destinations for migrant fishers originating from Pemba ().
Figure 1. Map of study locations.
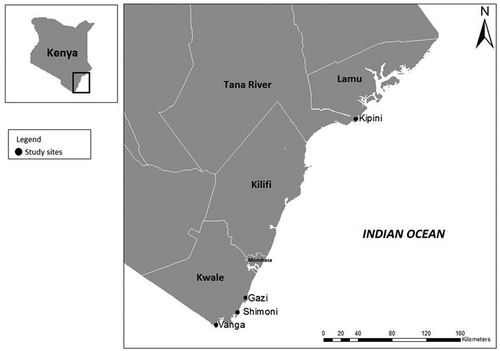
The study sites compromised of the Kipini, Gazi, and Shimoni villages, and the associated fish landing site and fishing grounds. The villages of Vanga and Jimbo were grouped and treated as one additional site (called Vanga-Jimbo here) due to the small size of Jimbo. These two villages are in close proximity to each other and are ethnically homogenous, so we deemed this grouping to be appropriate.
Data Collection
Data were collected from October 2010 to March 2011, to coincide with the annual arrival of migrant fishers in the largest numbers (Wanyonyi et al., Citation2016). We used two main participatory methods to collect data and map fishing activities. We obtained information on fishing activities using self-reported information via fishing vessel logbooks to supplement the GPS-tracking data.
Mapping Fishing Activity via GPS Tracking
At the start of the migrant season, six migrant fisher vessels were randomly selected at each study site. Vessel crew members were invited to be trained in how to use and handle the GPS units (Garmin etrex). We then selected three of the vessels at each site (except at Gazi where two vessels were selected due to availability of GPS units) to participate in the study for the remaining duration of their migrant trip. Vessels were selected on the basis of being representative of the main fishing vessel-gear types used by migrant fishers operating from each village landing site. A crew member on each of the monitored vessels was designated as a data collector. At the onset of each fishing excursion, the data collector switched on the GPS unit and switched it off upon return to the landing site. The GPS units were programmed to mark location every 2 min, thus tracking the location of the vessel throughout the fishing trip. The GPS tracks were retrieved from the data collector every 8–10 days and downloaded via EasyGPS software (TopoGrafix, Citation2016). Our method was adopted from Van der Spek, Van Schaick, De Bois, and De Haan (Citation2009).
At the start of the study, 11 vessels were equipped with the GPS-tracking units. During the study, three vessels moved away from their original landing site (Shimoni, Gazi, and Vanga-Jimbo). We replaced these with alternative vessels. In addition, one vessel departed the area with the GPS unit leading to a loss of eight tracking days in Shimoni in the analysis. In total, we tracked 14 crews during the fisher migration season. After accounting for these losses, the total number of tracking days was 80, 83, 73, and 98 in Kipini, Gazi, Shimoni, and Vanga-Jimbo, respectively. Here, we present the GPS-tracking maps and fishing preference maps for the vessels with the longest tracking duration per site. Prior to collecting data on the location of individual fishing areas, we obtained permission from the vessel captains and the officials from each BMU.
Mapping Fishing Activity via Area Preference Maps
The second participatory mapping component of the study involved mapping coastal and marine resources at each study site (i.e., fish landing sites, beaches, fishing grounds, reef areas). We conducted 11 focus group discussions with 2–5 migrant fishers representing each participating vessel. Fishers annotated a previously prepared and geo-referenced base map, adding details on the community’s fishing grounds with names and main reefs, channels, and beaches. They identified different landmarks on the map including the coastline, fish landing sites, roads, villages, and rivers. The information was mapped by GPS and digitized to produce participatory resource maps for each study site (e.g., Aswani & Lauer, Citation2006; Léopold, Guillemot, Rocklin, & Chen, Citation2014). The fishing areas were marked on the maps and categorized into main, least fished, and reserved areas (e.g., Furletti, Cintia, Renso, & Spinsanti, Citation2013). Reserve fishing areas refer to areas where respective fisher’s crew left free from fishing for a certain period. Fishers identified reserve areas including fish spawning aggregation sites and deep channels that are only fished under certain circumstances such as during the Northeast Monsoon season (Pers. Comm., migrant fisher, Kipini).
Characterizing Fishing Activity via Fishers Log Books
Crewmembers of the GPS tracked vessels were trained to record their daily fishing trip information using a logbook. This included noting the following information for each fishing trip: catch size (kg) and the main composition (kind) and value of catch landed. Logbook information was merged with vessel details including number of fishers on board, vessel, and fishing gear type, and the physical characteristics of vessels (length, engine size, main gear, fish landing site). All activities by the vessel during fishing were captured including zero catch dates and non-fishing days (e.g., Bastardie et al., Citation2010). Results, including mean and standard errors, are presented for all vessels.
Data Analysis
GPS Tracking
As GPS devices are usually continuously recording the vessel position as calibrated, the unprocessed track log data were checked for validity and integrity, and filtered. Each position was tested for polygon inclusion and all inland positions except the last position before leaving the fish landing site were removed before analysis. Each consecutive position outside the fish landing site, termed here as the point of commencement, constitutes part of a fishing trip (i.e., from point of departure to arrival back at the fish landing site). Valid trajectories were converted into point shape files, using Esri ArcCatalog, and imported into Esri ArcGIS version 10. Layers containing trajectories for each GPS unit at each fish landing site were spatially merged into single point layers. Fishnets made up of square polygons measuring 1 km by 1 km draping over the resource base for each site were created as a basis for analysis. Each square polygon had a unique identifier code. We used a ‘points to polygon’ analysis approach to calculate the number of points (i.e., density) in each square polygon.
During a fishing trip, the vessel exhibits sequences of stops and moves. When the vessel spends more time per unit area, this appears as high intensity on the map, whereas travel movements are faster and appear as low intensity. High intensity suggests fishing activity at a point of interest (POI) (e.g., Furletti et al., Citation2013; Van der Spek et al., Citation2009; Wall, Wittemyer, Klinkenberg, LeMay, & Douglas-Hamilton, Citation2013). To determine the amount of time spent by each fishing boat at a particular location (represented by the square polygons), we multiplied the number of points by two. This correction value was used since the GPS was programmed to mark points at a frequency of 2 min. Later, we converted the polygons into raster layers at 1 km spatial resolution and applied a majority filter to create final raster surfaces. The total area for actual resource bases for each vessel in each site was obtained by digitizing polygons around pixels that had greater than zero, and we used Esri ArcGIS 10 to estimate total areas in square kilometers (km2).
Fishing Area Preference
Following Yates and Schoeman (Citation2013), we used spatial access priority mapping (SAPM) to get fishers to document their fishing ground preferences in a manner that can be used for creating quantitative maps. The advantage of SAPM is that it relies only on simple formulas available in standard spreadsheets and GIS software to capture fisher preferences. Specifically, in the focus group discussions, the groups of migrant fishers categorized their fishing grounds into ‘main,’ ‘least,’ and ‘reserve’ fishing grounds by assigning them importance values of 80%, 15%, and 5%, respectively.
We calculated spatial access priority (SAP) for vessels that produced their fishing preference maps (). The SAP is a weighted measure of how important a fishing area is, relative to the number of fishers who operate on vessels and the size of the area. The SAP was determined for each fishing area by multiplying the number of full-time crew on the vessel by the area’s importance value, and then dividing by the area covered (number of square kilometers):
Table 1. Estimated number of migrant fisher vessels at landing sites during the period, October 2010 to March 2011, and description of fishing areas for 14 participating vessels.
Table 2. Aggregated catch and income for selected migrant vessels.
Table 3. Estimated fishing priority (SAP) for active vessels at four fish landing sites.
We identified the types of vessels and gear used by migrant fishers at each fish landing site, and estimated average vessel lengths using information from the BMU, local leaders, and observation. There were 133 active migrant fisher vessels, which were disaggregated according to fish landing site, gear type, and vessel type and length. We then calculated the average crew for each category (vessel type – vessel length – gear type), yielding 12 categories (hereafter referred to as vessel-length-gear) (). This number of categories is higher than available types of vessels and gear combinations because the size of crew varies depending on the type of gear used even where the vessels are the same in size.
Figure 2. GPS tracking (i) and Fishing Suitability (ii) maps for migrant fishers (A) at Kipini using wooden plank boat with scoop net and harpoon, (B) at Gazi using dugout canoe and Cast net.
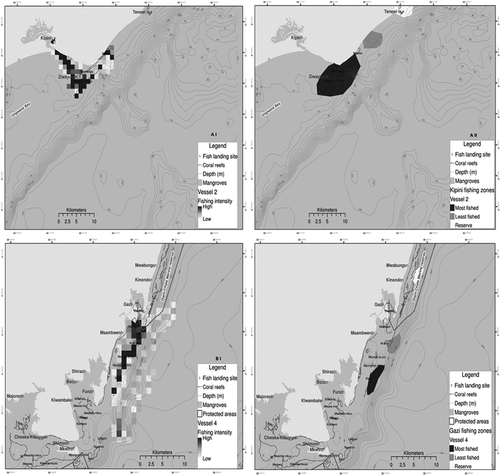
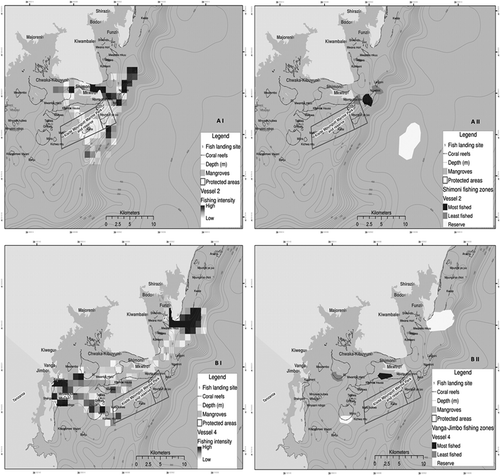
Figure 3. GPS tracking (i) and Fishing Suitability (ii) maps for migrant fishers (A) at Shimoni using outrigger canoe and Hook and Line and (B) at Vanga-Jimbo using dugout canoe and shark net.
We employed a simple approach by making tables using basic cell formulae and calculations in Excel. We estimated crew size for each vessel-length-gear category for all active migrant vessels and the average crew per vessel. We created a final weighting scheme for each length-gear combination, by dividing the estimated number of crew with the actual number sampled:
This weighting was used to scale-up the sampled vessels to make estimates for the fishery. Priorities for each area were multiplied by their corresponding weights to obtain a final weighted priority score per fish landing site by fishery (). Weighting by the number of crew assigns higher total priority for vessels with more crew. This method highlights the relevance of size of a vessel and type, gear type, and fish landing site in influencing access to fishing grounds.
Fisher Logs
We assigned a common identifier for each GPS trip to a logbook trip so that the GPS tracks and logbook trip data could be integrated. The logbook maintained by each vessel served to supplement information from the GPS tracking. Logbook data were coded and entered into spreadsheets. Summary data were then generated for each vessel by aggregating and analyzing trip level metrics on the main gear type in use, the catch composition (kg) identified to the family level, and the average daily income per vessel and per fisher on each vessel.
Results
Migrant Fishing Fleet Characteristics
In total, 14 migrant fishing vessels operating from four landing sites were tracked during the migrant fishing season of 2010–2011. These vessels included 126 individual crew members, approximately 20% of the total number of migrant fishers operating across all sites during the study. The main fishing vessel types at the four landing sites were large dugout, outrigger canoes, and wooden plank boats (). Main gear types were sharknet, hook and line, long line, and ringnets, as well as cast nets, drift nets, scoop nets, harpoon, and basket traps. The vessel in Shimoni covered the shortest average distance (15 km) to fishing grounds, whereas that of Kipini covered the longest distance (28 km) and utilized the largest fishing area (271.8 km). Shimoni had deepest average depth of fishing grounds (420 m) compared to other sites including Vanga-Jimbo (77.5 m) ().
Analysis of logbook data provided further detail on characteristics of the migrant fleet and individual fisher returns. Specifically, wooden plank boats, operating with scoop nets and harpoons with an average of 18–20 fishers per day, had the highest average daily catch (72.4 kg), whereas the dugout canoes using shark nets with three fishers per day had the lowest (17.6 kg) (). The foreign exchange rate at the time of this study was US$1 for KSh 85. Dugout canoes targeting sharks had the lowest vessel daily income (KSh 1,224.21), whereas the dugout canoes operating cast nests with 17–18 fishers per day had the highest (KSh 5,557.18). Individually, fishers working on outrigger canoes using hook and line gear with three fishers per day had the highest daily income (KSh 600.11), whereas those fishing on wooden plank boats using scoop nets and harpoons had the lowest (KSh 249.10). The difference in individual versus vessel level incomes is attributable to the higher number of fishers working on the wooden plank boats (). As expected, given the gear types in use, the wooden plank boats and dugout canoes using scoop nets, harpoons, and shark nets, respectively, were more specific in their target catch (namely octopus and sharks and rays). In contrast, dugout canoes using cast nets and outrigger canoes using hook and line were less selective, targeting more than four main types of catch ().
Spatial Fishing Patterns and Comparison of Mapping Methods
The GPS-tracking data identified areas of high intensity use by wooden plank boats operating from Kipini as clusters of patch reef adjacent to Ziwayuu Island and two northerly reefs in shallow water (<10 m deep) habitat (). From the logbook data, we know that these vessels use scoop net gear to fish for octopus and lobsters.
Fishing area preference mapping identified Mwamba Mwakamanga, Mwamba Punju, and Mwamba Ziwayuu as preferred fishing grounds, corresponding to areas of high-fishing intensity from GPS tracking (). The reserve-fishing area at Ras Tenewi corresponded to no fishing activity on the GPS-tracking map. However, Mwamba Matewe identified as least fished, but was a POI with intensive use according to GPS tracking.
GPS tracking showed the POIs for dugout canoes using a cast net in Gazi were spread out along the steady slopes of the fringing reef adjacent to Gazi Bay, southward to Funzi Island (). Fishing areas were mostly in shallow habitat in waters of 10 m depth. The areas of high intensity identified by the GPS-tracking data corresponded to main fishing areas identified by fisher preference maps at Kwale and Mpungani (). As expected, fishers did not use reserve sites identified on the preference map. However, an intensive use area off Msambweni was marked on the preference map as least fished at Arusha and Mekka.
POIs for outrigger canoe fishers using hook and line in Shimoni were clustered within a small area of patch reef within shallow areas up to 20 m deep (). These fishers identified Nyuli as most fished in their preference mapping, and an offshore area over 400 m deep as reserve-fishing grounds. Both areas on fishing preference maps corresponded to POI and no fishing activity, respectively, on their GPS map. However, Mpunguti ya chini, Ngushini, and Langoni identified as least fished were intensive use areas according to GPS tracking.
For the dugout canoes using shark nets in Vanga, intensive use areas were concentrated off Funzi Island, on the boundary of Kisite-Mpunguti marine protected area (MPA), and at Sii Island (). Fishing areas in the north were up to 50 m deep and less than 10 m in the south. However, GPS tracking showed high-fishing intensity at areas identified as reserve-fishing grounds. These included Funzi Island, Mijira, and to the southern boundary of the Kisite-Mpunguti MPA. Sii Island identified as least fished was shown to be an intensive use area by GPS maps.
Priority Fishing Grounds for Each Landing Site
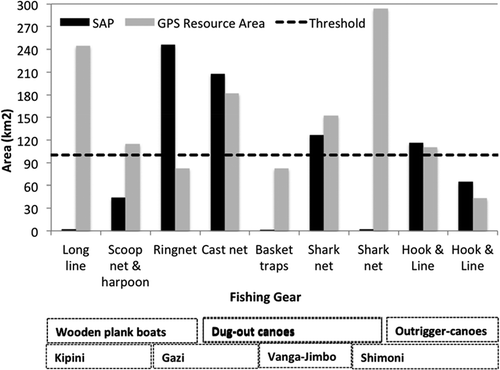
Gear-vessel combinations of ringnets-wooden plank boats, cast net-dugout canoes, and hook and line-outrigger canoes had larger SAP than dugout canoes and wooden plank boats using basket traps and long lines, respectively (). In general, Gazi had the highest estimated SAP followed by ringnets at Shimoni and Gazi, and hook and line at Shimoni (). Gazi had the highest total combined SAP followed by Shimoni, whereas Vanga-Jimbo and Kipini had the least. Total resource areas from GPS tracking and SAPs for cast net, hook and line, and shark net were comparable, but varied remarkably for long line, scoop-harpoon, and basket trap ().
Figure 4. Migrant fishers’ Suitability Area Priority (SAP) from fishing preference mapping and Resource Area from GPS tracking by type of gear, vessel and landing site.
Discussion
Determining how migrant fishers use space, their fishing operations, and overlap with local community fisher activities are critical for their integration into fisheries management. Collecting information on this notoriously data poor component of the artisanal fishery system is challenging when the capacity and resources available to do so are severely limited. Without this information, the impact of migrant fishers on the wider socio-ecological system will remain unknown (Cassels et al., Citation2005; Curran, Citation2002). Here, we adopted a multi-method, participatory approach using GPS tracking, fishing area preference mapping, and fisher logbooks to gain insight into this often neglected component of fishery systems. By doing so, we demonstrated the utility of low-tech solutions to understand migrant fisher behavior. Our study aim was to characterize migrant fishing by: (a) documenting their spatial fishing patterns, (b) identifying fishing ground preferences and the level of catch from different fishing grounds, and (c) generating scores of importance for fishing grounds for particular fishers and landing sites.
Spatial Assessment of Migrant Fishers and the Complementarity of PGIS Tools
The areas of intense fishing activity as identified by GPS tracking and the fishing areas shown by the preference mapping exercise were generally in high agreement. In addition, these two methods yielded complementary types of information. GPS tracking provides fine-scale spatial and seasonal mapping of fishing activity and spatial allocation of fishing effort, whereas preference mapping identifies the important fishing areas to fishers and facilitates analysis of access priorities by different fisheries. The spatial data on fisher movement was further supplemented by logbook data, which was used for estimating spatially explicit catch landings values and fishing efforts. There is a clear spatial differentiation of fishing activity that is determined by migrant fisher gear and vessel type.
Unsurprisingly, some mismatches in the categorization of fishing grounds by GPS tracking and fishing suitability mapping were apparent. These discrepancies between actual fished areas from GPS tracking and self-reported main fishing grounds from suitability mapping do not necessarily indicate unreliability of self-reported information by fishers. For instance, a regular fishing route may appear as high-intensity use, whereas a reserve-fishing ground may fall under high-intensity use due to a difference in interpretation of terms used by the fisher and scientist. Reserve-fishing grounds are areas a particular fisher’s crew left free from fishing for certain periods and they can fish these areas only at specific times. These include known fish spawning areas and areas of strong currents (Pers. com, migrant fisher, Kipini). Fisher knowledge of important fish aggregation and spawning areas and their awareness of the community conservation areas (CCAs) may contribute to unwillingness to discuss such areas if they spend more fishing effort in these areas. The fishing mapping preference approach has the advantage of documenting the fishing ‘seascape’ that is unique to the migrant fishing community from the perspective of its members (Silvano & Begossi, Citation2012; St. Martin, Citation2001). This information, which is essential to fisheries governance, has until now been obscured by the assumption that community members, such as fish traders and local community fishers, represent the interests of the entire fishing community (Nielson et al., Citation2004).
Using Low-Tech PGIS Methods to Engage Fishers in Data Sparse Fisheries
Migrant fishers are typically excluded from fisheries management consultations. Both GPS tracking and fishing area preference mapping can engage otherwise underrepresented or ignored migrant fishers. However, preference mapping using suitability mapping allows fishers to consciously contribute knowledge-based quantitative information, whereas GPS tracking uses direct automated mapping aided by a GPS unit. The SAPM approach employs a simple method suitable for engaging resource users in fisheries research. It documents fishers’ actual access priorities to provide insight into their most important parts of the sea, based on their expertise in fishing areas. As a result, SAPM is a useful technique to map resource use patterns when GPS tracking may be prohibitively costly (due to the need for GPS units).
This cost-effective PGIS approach also has the advantage of harnessing fisher knowledge, which because it is aggregated overtime, can provide a better understanding of local fisheries resource use patterns (Cassels et al., Citation2005). Experienced fishers possess cumulative and detailed spatial knowledge about fishing areas and their environment (St. Martin, Citation2001). They rely on this personal knowledge to determine their fishing success, often repeatedly visiting choice fishing locations with higher probability of encountering their target fish (Pet-Soede, Van Densen, Hiddink, Kuyl, & Machiels, Citation2001). Migrant fishers use such knowledge to target rich fishing grounds with available fish stocks, which are likely to have large concentrations of fish or are off-limits to most local fishers, including fishing in close proximity to conservation areas, coralline islands, and offshore reefs. Migrant fishers, therefore, can provide unique information on the offshore locations where they operate. PGIS can capture this knowledge gained by fishers during their daily interactions with their environment (Cassels et al., Citation2005; St. Martin & Hall-Arber, Citation2008). PGIS documents fisher place names for key fishing grounds, revealing otherwise unknown seascapes (Silvano & Begossi, Citation2012; St. Martin, Citation2001). Without the engagement of migrant fishers, these remote parts of the fishery system would otherwise be largely absent from fisheries assessments and management (Binet et al., Citation2012), and knowledge of the local geography of the fishery system would remain limited to local fishers who mainly operate inshore and close to their home fish landing sites (Obura & Wanyonyi, Citation2001).
Relevance of Participatory Approaches in Artisanal Fisheries Management
In Kenya, BMUs are responsible for recording landings and enforcing fisheries regulations along the coastline and ‘inshore waters’ (Government of Kenya, Citation2007, Citation2012). This responsibility includes receiving migrant fishers at their respective landing sites (Wanyonyi et al., Citation2016). The limited spatial jurisdiction of a BMU affects their ability to manage migrant fishers because migrant fishing grounds can extend beyond the inshore waters and into adjacent areas that are under the jurisdiction of neighboring BMUs. As a result, local fisheries management initiatives are based on ad hoc decision-making without data on the fishing operations of migrant fishers. This omission has resulted in the varied acceptance of migrant fishers, stifling gains made in artisanal fisheries management (Wanyonyi et al., Citation2016).
The sharing of fishing grounds between migrant fishers and fishers from neighboring landings sites are met with mixed tolerance of migrant fishers. Mkunguni, Mwaembe, and Mwandamo landing sites were among the BMUs in Kwale County that did not allow migrant fishers. These BMUs share fishing grounds with Gazi, Shimoni, and Vanga-Jimbo landing sites, which are important destinations for migrant fishers. The presence of migrant fishers, therefore, accentuates possibilities of resource related conflicts. Indeed, increased migrant fisher activities within the traditional fishing zones used by local communities have previously resulted in violent conflicts (Binet et al., Citation2012; Glaesel, Citation1997; Ochiewo, Citation2004).
The overlap in migrant fishing grounds between BMUs that do and do not accept migrant fishes that we identified is particularly relevant to the increasing regional interest in fisheries comanagement including CCAs. CCAs are a form of MPA led by the local community (McClanahan, Muthiga, & Abunge, Citation2016). The spatial characterization that we have provided of the migrant fisher communities working in the area, which includes their landing sites and fishing gear used, can help anticipate future conflict and inform collaborative planning for future CCAs. Furthermore, we are able to identify: (a) important fishing areas for fishers targeting different target resources and (b) the most vulnerable fishers who stand to lose the largest fishing area due the implementation of a conservation area. As a result, we find this PGIS approach to be a viable planning or zoning tool for supporting selection or creation of local protected area sites with minimal potential conflicts among stakeholders.
Novelty of this Approach
Artisanal fisheries research has traditionally collected data using surveys, interviews, activity logs maintained by fishers, ecological surveys, and catch monitoring at fish landing sites (Samoilys, Osuka, Maina, & Obura, Citation2017). However, these methods are not spatially explicit, nor do they differentiate between migrant and local fishers. A spatially explicit assessment of fisher resource use patterns requires high resolution and reliable information about spatial and temporal patterns and allocation of fishing effort for informed decision-making (Bastardie et al., Citation2010; Campbell et al., Citation2014; Pet-Soede et al., Citation2001). In addition, research methods typically employed for studying artisanal fisheries are often criticized for distortions related to recall, reliability, reproducibility, behavioral change, and privacy issues, especially when used in isolation (Gonzalez, Hidalgo, & Barabasi, Citation2008; Malleret-King, Glass, Wanyonyi, & Pomeroy, Citation2006; Ron, Muhando, & Francis, Citation1998; Stone & Shiffman, Citation2002).
We addressed these concerns through the novel application of GPS tracking and area suitability mapping methods to collect spatial information on migrant fisher operations. These methods have been widely used in wildlife tracking (Rodgers, Citation2001; Wall et al., Citation2013), participatory forest ecology, and tourism use mapping (Brown, Schebella, & Weber, Citation2014), and here we successfully integrated them via a PGIS approach. summarizes the key features of the three PGIS methods discussed in this article. By combining these three methods, we take advantage of the strengths associated with each method individually. For improved accuracy of the information gathered, we suggest these methods should be used together to complement, confirm, and validate the inferences made.
Table 4. Key features of the three PGIS methods applied in the artisanal fisheries research.
Challenges, Limitations, and Recommendations for Future Application
A major challenge to the adoption of new technologies in resource-poor settings is cost. GPS tracking is a relatively cheap alternative to Vessel Monitoring Systems, which are typically applied to commercial fisheries. The total project cost was less than US$910 per landing site. Core costs included three GPS units (US$250 each), 12 rechargeable batteries (4 for each vessel at US$35), and a shared battery charger per landing site at US$20. We limited costs by using rechargeable batteries and asking participating fishers to activate their units at the start of fishing and switch them off on arrival back to the fish landing site to save battery power. Batteries can increase expenditures given that dry alkaline cells have limited battery life.
An additional cost that should be considered when assessing the suitability of our approach for use elsewhere is the time and resources required for training the participating fishers for quality assurance and harmonization of data collection. This cost links directly to the risk that fishers could abandon the study at any time. We replaced four participating vessels after they left the study area (leading to a loss of data and equipment). The uncertainty and unpredictability of migrant fisher operations (Wanyonyi et al., Citation2016), will generally remain outside of the influence of the research or implementation team. A viable alternate that could overcome this challenge is the use of automatic identification system (AIS) technology. AIS has only recently become available for artisanal fishing vessels use (e.g., Proud, Browning, & Kocak, Citation2016). The advantages of AIS over GPS tracking are that the device can be installed on any boat regardless of size and it uses an autonomous tracking system for two-way exchange of navigational informational between vessels or AIS-equipped stations along the coast within range of VHF radio, normally up to about 20 nautical miles (nm). AIS provides the boat’s identity and GPS data (location, course, speed) (Gezelius, Citation2007). AIS can not only be applied for the participatory mapping of fishing grounds, but also for mapping of sensitive ecosystems such as spawning areas for conservation purposes, and navigational hazards can also be mapped for safety. AIS can, therefore, produce additional benefits and is more efficient for recording fishing operations. These wider benefits are more likely to incentivize fisher participation in studies relative to data collected purely for research.
Conclusion
We have spatially assessed the resource use and fishing patterns of migrant fishers by mapping the location and boundaries of their target fish grounds and activities. This information fills a critical gap for artisanal fisheries management in Kenya that is particularly useful for future CCA planning. Our study advances migrant fisher research through the application of PGIS tools and demonstrates the viability of low-cost and low-technology approaches for collecting data on tropical fisheries and integrating migrant fishers into management decision-making processes.
Acknowledgments
The authors sincerely thank the migrant and local fishers involved in this study for their selflessness and dedicating time without which the study could not have been a success. Thanks to the personnel at CORDIO, Fisheries Department, and COMRED among other institutions for facilitation.
Additional information
Funding
References
- Alvard, M., McGaffey, E., & Carlson, D. (2015). A method for measuring fishing effort by small-scale Fish Aggregating Device (FAD) Fishers from the commonwealth of Dominica [-2015/08//]. Field Methods, 27(3), 300–315. doi:10.1177/1525822X14552221
- Aswani, S., & Lauer, M. (2006). Incorporating fishermen’s local knowledge and behavior into geographical information systems (GIS) for designing marine protected areas in Oceania. Human Organization, 65(1), 81–102. doi:10.17730/humo.65.1.4y2q0vhe4l30n0uj
- Bastardie, F., Nielsen, J. R., Ulrich, C., Egekvist, J., & Degel, H. (2010). Detailed mapping of fishing effort and landings by coupling fishing logbooks with satellite-recorded vessel geo-location. Fisheries Research, 106(1), 41–53. doi:10.1016/j.fishres.2010.06.016
- Binet, T., Failler, P., & Thorpe, A. (2012). Migration of Senegalese fishers: A case for regional approach to management. Maritime Studies, 11(1), 1–14. doi:10.1186/2212-9790-11-1
- Brown, G., Schebella, M. F., & Weber, D. (2014). Using participatory GIS to measure physical activity and urban park benefits. Landscape and Urban Planning, 121, 34–44. doi:10.1016/j.landurbplan.2013.09.006
- Campbell, M. S., Stehfest, K. M., Votier, S. C., & Hall-Spencer, J. M. (2014). Mapping fisheries for marine spatial planning: Gear-specific vessel monitoring system (VMS), marine conservation and offshore renewable energy. Marine Policy, 45, 293–300. doi:10.1016/j.marpol.2013.09.015
- Cassels, S., Curran, S. R., & Kramer, R. (2005). Do migrants degrade coastal environments? Migration, natural resource extraction and poverty in North Sulawesi, Indonesia. Human Ecology, 33(3), 329–363. doi:10.1007/s10745-005-4142-9
- Cinner, J. E., McClanahan, T. R., & Wamukota, A. (2010). Differences in livelihoods, socioeconomic characteristics, and knowledge about the sea between fishers and non-fishers living near and far from marine parks on the Kenyan coast. Marine Policy, 34(1), 22–28. doi:10.1016/j.marpol.2009.04.003
- Curran, S. (2002). Migration, social capital, and the environment: Considering migrant selectivity and networks in relation to coastal ecosystems. Population and Development Review, 28, 89–125.
- Dunn, C. E. (2007). Participatory GIS — A people’s GIS? Progress in Human Geography, 31(5), 616–637. doi:10.1177/0309132507081493
- Forcada, A., Valle, C., Sánchez-Lizaso, J. L., Bayle-Sempere, J. T., & Corsi, F. (2010). Structure and spatio-temporal dynamics of artisanal fisheries around a Mediterranean marine protected area. ICES Journal of Marine Science: Journal Du Conseil, 67(2), 191–203. doi:10.1093/icesjms/fsp234
- Fulanda, B., Munga, C., Ohtomi, J., Osore, M., Mugo, R., & Hossain, M. Y. (2009). The structure and evolution of the coastal migrant fishery of Kenya. Ocean & Coastal Management, 52(9), 459–466. doi:10.1016/j.ocecoaman.2009.07.001
- Furletti, B., Cintia, P., Renso, C., & Spinsanti, L. (2013). Inferring human activities from GPS tracks. Paper presented at the 2nd ACM SIGKDD International Workshop on Urban Computing.
- Gezelius, S. S. (2007). The social aspects of fishing effort. Human Ecology, 35(5), 587–599. doi:10.1007/s10745-006-9096-z
- Glaesel, H. (1997). Fishers, Parks and Power: The Socio-environmental dimensions of marine resource decline and protection on the Kenya coast. ( PhD), University of Wisconsin, Madison, WI.
- Gonzalez, M. C., Hidalgo, C. A., & Barabasi, A.-L. (2008). Understanding individual human mobility patterns. Nature, 453(7196), 779–782. doi:10.1038/nature06958
- Government of Kenya. (2007). The Fisheries (Beach Management Unit) Regulations (under The Fisheries Act Cap 378) (Revised 2007).
- Government of Kenya. (2012). The Fisheries Act Cap 378 1999 (Revised 2012).
- Islam, M. M., & Herbeck, J. (2013). Migration and translocal livelihoods of coastal small-scale fishers in Bangladesh. Journal of Development Studies, 49(6), 832–845. doi:10.1080/00220388.2013.766719
- Kimani, P., & Obura, D. O. (2007). Participatory mapping of terrestrial fishery resources in Kwale District, Kenya. Western Indian Ocean Journal of Marine Science, 3(2), 209–220. doi:10.4314/wiojms.v3i2.28462
- Léopold, M., Guillemot, N., Rocklin, D., & Chen, C. (2014). A framework for mapping small-scale coastal fisheries using fishers’ knowledge. ICES Journal of Marine Science: Journal Du Conseil, 71(7), 1781–1792. doi:10.1093/icesjms/fst204
- Lokrantz, J., Nyström, M., Norström, A. V., Folke, C., & Cinner, J. E. (2009). Impacts of artisanal fishing on key functional groups and the potential vulnerability of coral reefs. Environmental Conservation, 36(04), 327–337. doi:10.1017/S0376892910000147
- Malleret-King, D., Glass, A., Wanyonyi, I., & Pomeroy, B. (2006). Socio-economic monitoring guidelines for coastal managers of the Western Indian Ocean (Vol. 1). Mombasa, Kenya: CORDIO East Africa.
- Malleret-King, D., Manghubhai, S., Tunje, J., Muturi, J., Mueni, E., & On’ganda, H. (2003). Understanding fisheries associated livelihoods and the constraints to their development in Kenya and Tanzania – Annex 4: Livelihood Appraisal (FANRM/MKK/MRAG), London, UK.
- Mangi, S. C., Smith, S., & Catchpole, T. L. (2016). Assessing the capability and willingness of skippers towards fishing industry-led data collection. Ocean & Coastal Management, 134(SupplementC), 11–19. doi:10.1016/j.ocecoaman.2016.09.027
- McClanahan, T. R., Glaesel, H., Rubens, J., & Kiambo, R. (1997). The effects of traditional fisheries management on fisheries yields and the coral-reef ecosystems of southern Kenya. Environmental Conservation, 24(2), 105–120. doi:10.1017/S0376892997000179
- McClanahan, T. R., & Mangi, S. C. (2004). Gear-based management of a tropical artisanal fishery based on species selectivity and capture size. Fisheries Management and Ecology, 11(1), 51–60. doi:10.1111/j.1365-2400.2004.00358.x
- McClanahan, T. R., Muthiga, N., & Abunge, C. (2016). Establishment of community managed fisheries’ closures in Kenya: Early evolution of the Tengefu movement. Coastal Management, 44(1), 1–20. doi:10.1080/08920753.2016.1116667
- Nielsen, J. R., Degnbol, P., Viswanathan, K. K., Ahmed, M., Hara, M., & Abdullah, N. M. R. (2004). Fisheries co-managementan institutional innovation? Lessons from South East Asia and Southern Africa. Marine Policy, 28(2), 151–160.
- Obura, D. O., & Wanyonyi, I. (2001). The local geography of an artisanal fishery and its relevance to fisheries management. Paper presented at the regional fisheries information system project workshop on the use of information in Tanzanian co-management projects, Tanga.
- Ochiewo, J. (2004). Changing fisheries practices and their socioeconomic implications in South Coast Kenya. Ocean & Coastal Management, 47, 389–408. doi:10.1016/j.ocecoaman.2004.07.006
- Pet-Soede, C., Van Densen, W. L. T., Hiddink, J. G., Kuyl, S., & Machiels, M. A. M. (2001). Can fishermen allocate their fishing effort in space and time on the basis of their catch rates? An example from Spermonde Archipelago, SW Sulawesi, Indonesia. Fisheries Management and Ecology, 8(1), 15–36. doi:10.1046/j.1365-2400.2001.00215.x
- Proud, R., Browning, P., & Kocak, D. M. (2016, 19-23 September). AIS-based mobile satellite service expands opportunities for affordable global ocean observing and monitoring. Paper presented at the OCEANS 2016 MTS/IEEE Monterey.
- Rodgers, A. R. (2001). Tracking animals with GPS. Macaulay Land Use Research Institute, Aberdeen. Retrieved from http://www.invasive.org/gist/networks/western/resources/GPS1.pdf
- Ron, W. J., Muhando, C. A., & Francis, J. (1998). The status of the coral reefs of Zanzibar: One example of a regional predicament. Ambio, 27(8), 700–707. doi:10.2307/4314818
- Rosendo, S., Jiddawi, N., Joubert, A., Mechisso, M., & Brown, K. (2008). Stakeholder needs, perceptions and priorities in relation to use and conservation of natural resources. Lisbon, Portugal: TRANSMAP.
- Samoilys, M. A., Osuka, K., Maina, G. W., & Obura, D. O. (2017). Artisanal fisheries on Kenya’s coral reefs: Decadal trends reveal management needs. Fisheries Research, 186(Part 1), 177–191. doi:10.1016/j.fishres.2016.07.025
- Scholz, A. J., Steinback, C., Kruse, S. A., Mertens, M., & Silverman, H. (2011). Incorporation of spatial and economic analyses of human‐use data in the design of marine protected areas. Conservation Biology, 25(3), 485–492. doi:10.1111/j.1523-1739.2010.01626.x
- Silvano, R. A., & Begossi, A. (2012). Fishermen’s local ecological knowledge on Southeastern Brazilian coastal fishes: Contributions to research, conservation, and management. Neotropical Ichthyology, 10(1), 133–147. doi:10.1590/S1679-62252012000100013
- Sipe, N., & Dale, P. (2003). Challenges in using geographic information systems (GIS) to understand and control malaria in Indonesia. Malaria Journal, 2. doi:10.1186/1475-2875-2-36
- St. Martin, K. (2001). Making space for community resource management in fisheries. Annals of the Association of American Geographers, 91(1), 122–142. doi:10.1111/0004-5608.00236
- St. Martin, K. (2006). Charting fishing communities at sea: Revealing new potentials for participation in fisheries science and management. Paper presented at the ICES 2006, Fishing Technology in the 21st Century, Boston, MA. http://scholar.googleusercontent.com/scholar?q=cache:c4kowf9UDA0J:scholar.google.com/+Charting+Fishing+Communities+at+Sea:+Revealing+New+Potentials+for+Participation+in+Fisheries+Science+and+Management+Kevin+St.+Martin&hl=en≈sdt=0,5
- St. Martin, K., & Hall-Arber, M. (2008). The missing Layer: Geo-technologies, communities, and implications for marine spatial planning. Marine Policy, 32(5), 779–786. doi:10.1016/j.marpol.2008.03.015
- Stone, A. A., & Shiffman, S. (2002). Capturing momentary, self-report data: A proposal for reporting guidelines. Annals of Behavioral Medicine, 24(3), 236–243. doi:10.1207/s15324796abm2403_09
- TopoGrafix. (2016). Easy GPS.
- Van der Spek, S., Van Schaick, J., De Bois, P., & De Haan, R. (2009). Sensing human activity: GPS tracking. Sensors, 9(4), 3033–3055. doi:10.3390/s90403033
- Wall, J., Wittemyer, G., Klinkenberg, B., LeMay, V., & Douglas-Hamilton, I. (2013). Characterizing properties and drivers of long distance movements by elephants (Loxodonta africana) in the Gourma, Mali. Biological Conservation, 157, 60–68. doi:10.1016/j.biocon.2012.07.019
- Wanyonyi, I. N., Wamukota, A., Mesaki, S., Guissamulo, A. T., & Ochiewo, J. (2016). Artisanal fisher migration patterns in coastal East Africa. Ocean and Coastal Management, 119, 93–108. doi:10.1016/j.ocecoaman.2015.09.006
- Wanyonyi, I. N., Wamukota, A., Tuda, P., Mwakha, V. A., & Nguti, L. M. (2016). Migrant fishers of Pemba: Drivers, impacts and mediating factors. Marine Policy, 71, 242–255. doi:10.1016/j.marpol.2016.06.009
- Yates, K. L., & Schoeman, D. S. (2013). Spatial Access Priority Mapping (SAPM) with fishers: A quantitative GIS method for participatory planning. PLoS ONE, 8(7), 1–14. doi:10.1371/journal.pone.0068424