
 ?Mathematical formulae have been encoded as MathML and are displayed in this HTML version using MathJax in order to improve their display. Uncheck the box to turn MathJax off. This feature requires Javascript. Click on a formula to zoom.
ABSTRACT
Although research indicates deer management cooperatives (DMCs) provide the needed means to influence large-scale resource management changes, research has yet to identify which conservation initiatives DMC members find important and would likely implement. Therefore, we performed an Importance-Likelihood Analysis to ascertain which conservation initiatives DMC members find important and their likelihood of carrying out these initiatives. Results from our survey of 459 DMC members across 5 U.S. states found that the conservation initiatives of “increasing days spent on habitat management” and “managing habitat for species other than white-tailed deer” fell within the “Keep up the Good Work” quadrant. The conservation behavior of “enrolling in government cost-share programs” fell in the “Hard Sell” quadrant, and the initiatives of “becoming members of conservation NGOs,” and “increasing money spent on habitat management” fell in the “Communicate Value/Importance” quadrant. Thus, managers gain insight to improve the likelihood of users implementing a given conservation behavior.
Introduction and Literature Review
Utilizing private landowners for conservation delivery has been identified as a viable wildlife conservation strategy worldwide (Burger Jr. et al. 2019; Wilson & Hart, Citation2000). Reliance on private landowners to achieve conservation goals is especially important in areas such as the eastern United States (U.S.) where most of the land is owned and managed by private landowners with varying and competing goals (Vincent et al., Citation2017). Federal and state conservation planners routinely aim to utilize the enthusiasm of private landowners to achieve federal and state conservation goals but struggle to identify viable dissemination channels to overcome competing objectives without consistent financial incentives (Dayer et al., Citation2018).
One success story over the last four decades has been the formation of hundreds of deer management cooperatives (DMCs) across millions of private acres to collectively manage land for white-tailed deer, specifically under Quality Deer Management (QDM) guidelines (Adams & Ross, Citation2017; Murphy, Citation2011; Quality Deer Management Association (QDMA), Citation2005). DMCs are defined as groups of “landowners and hunters voluntarily working together to improve the quality of wildlife (white-tailed deer), habitat, and hunting experiences on their collective acreage” (Adams & Ross, Citation2017; Murphy, Citation2011). Hence, DMCs serve as a viable vector for conservation delivery, occupying the crucial nexus of private land management and conservation planner initiatives (Pruitt et al., Citation2021). Thus, identifying the likelihood of cooperative members to implement conservation objectives is both cost-effective and critical to federal and state agencies to achieve conservation goals on a landscape level.
Previous research highlights the utility of DMCs in creating landscape-level changes in member–resource interactions (Kramer et al., Citation2016; Mitterling, Citation2013; Stout et al., Citation2013). For example, Mitterling (Citation2013) and Kramer et al. (Citation2016) found a modification in DMC member harvest of female deer based on social networks present in co-ops, and Stout et al. (Citation2013) found single co-ops to have the ability to reduce deer densities by 50% within a decade. These large-scale impacts to lower deer populations resulted in fewer browse impacts on woody regeneration and improved growth of herbaceous indicator plants (Stout et al., Citation2013). Engaged co-op members have the ability to serve as a catalyst for other members to positively affect deer populations and their surrounding habitat through a coordinated effort (Stout et al., Citation2013).
Although previous research indicates these social-networks provide a means to influence large-scale resource management changes, it does not directly indicate that DMC members would implement desired conservation initiatives. Knowledge gaps include whether DMC members would be willing to increase days or dollars spent on habitat management, manage habitats specifically for wildlife species other than white-tailed deer, join a wildlife conservation organization (e.g., Quality Deer Management Association, National Wild Turkey Federation, Ducks Unlimited), or apply for government habitat cost-share programs (e.g., Conservation Reserve Program, Environmental Quality Incentive Program). Prior scholarship suggests that DMCs can provide benefits to their members such as engagement, hunter satisfaction, and ability to achieve deer management goals (Grado et al., Citation2010; Mitterling, Citation2013; Pruitt et al., Citation2021; Stout et al., Citation2013); however, successful utilization of DMCs by state and federal conservation planners hinge on their members’ willingness and planned actions to carry out conservation objectives. Although current literature describes benefits of DMCs to their members, translating habitat management success from a conceptual model to tangible implementation relies on private-landowner willingness to act on tasks they deem as important.
With this gap in mind, the purpose of this paper is to gauge which conservation initiatives DMC members find important and which conservation initiatives DMC members are likely to implement using a modified Importance Performance Analysis (IPA). Rather than using the traditional IPA or Importance Satisfaction Analysis (ISA), we implement an Importance Likelihood Analysis (ILA). Formatted like an IPA (Martilla & James, Citation1977; Oh, Citation2001), an Importance-Likelihood Analysis (ILA) simultaneously examines participant-assigned importance values for a set of relevant activities, while jointly measuring likelihood of future implementation for each activity. Variations of IPA are widely used within tourism and marketing literature as a framework to concurrently identify attributes that are important to quality client experiences (Boley et al., Citation2017). Their popularity is also growing within the natural resources literature to better understand stakeholders’ perceptions toward hunting (Rosenberger, Citation2020), fishing (TenHarmsel et al., Citation2019), and DMC satisfaction (Pruitt et al., Citation2021). In an ILA, likelihood and importance ratings are graphed on an x-y axis, respectively () providing four managerially relevant ILA quadrants: Quadrant 1: “Keep Up The Good Work” where the conservation behavior is of high importance and likely to be performed, Quadrant 2: “Easy Sell” where the conservation behavior has above average importance but is not likely to be implemented, Quadrant 3: “Hard Sell” where the behavior has below average importance and it is unlikely to be performed, and Quadrant 4: “Communicate Value/Importance” where there is high likelihood the conservation initiative will be performed but DMC members do not find it important. Thus, managers gain insight to where resources should be directed to improve the likelihood of users to implement a given conservation behavior.
Figure 1. Example layout of importance-likelihood analysis graph. importance ratings are graphed on an x-y axis, providing four managerially relevant ILA quadrants: Quadrant 1: “Keep up the good work” where action is of high importance and likely to be performed, Quadrant 2: “Easy sell” where the action has above average importance but is not likely to be implemented, Quadrant 3: “Hard sell” where the action has below average importance and it is unlikely to be performed, and Quadrant 4: “Communicate value/importance” where there is high likelihood the action will be performed but respondents do not find it important.
While an overall ILA would provide federal and state agencies with general information on which conservation initiatives DMCs are likely to engage in and which ones they need to be persuaded to implement, it would not account for the heterogeneity in DMCs and their various motivations for forming cooperatives. Individual co-op member likelihood to implement conservation initiatives may differ based on member characteristics such as motivation, region, or even co-op size (Brown et al., Citation2005; Pruitt et al., Citation2021). Pruitt et al. (Citation2021) found that DMCs are comprised of individuals with varying motivations such as wanting to disconnect (Disconnect), harvest local and sustainable meat (Locavore), socialize with other hunters (Social Inclusion) and harvest quality bucks (Quality Harvest). These four primary motivational orientations are derived from the previous hunting motivational literature and hunter-development phases (Applegate et al., Citation1982; Decker & Connelly, Citation1989; Jackson & Norton, Citation1980). Therefore, we expect these varying motivational clusters to be present among DMC members resulting in the need to run ILA analyses by motivational clusters. Differences in motivation of DMC membership are documented (Pruitt et al., Citation2021) and may result in varying degrees of likelihood of conservation implementation or willingness to facilitate partnerships with local or federal entities on DMC lands. If DMCs are to be utilized as a practical conservation planning tool, research into their ability to affect tangible conservation initiatives across the national landscape is warranted.
Methods
QDMA Deer Management Cooperative Member Survey
Survey methodology and descriptions are previously described in Pruitt et al. (Citation2021). We identified 45 deer management cooperatives (DMCs) using QDMA employees, their personal or professional connections, and an e-mail to all QDMA members within each of the cooperating states. Once this list of DMCs was compiled, we contacted DMC leaders to obtain basic cooperative information: name, county, town, total DMC acres, start year, total membership, total landowners, DMC map, and DMC leader contact information. Through contacting DMC leaders, a sample of 2,817 DMC members were identified across five states within representative regions of the white-tailed deer’s range even though total DMC membership for the 45 DMCs was estimated at 6,217 members (~45% of DMC members). These DMCs were distributed across Georgia (Southeast US, n = 8 DMCs), Michigan (Upper Midwest US, n = 10 DMCs), Missouri (Midwest US, n = 7 DMCs), New York (Northeastern US, n = 10 DMCs), and Texas (Southwestern US n = 10 DMCs). The DMCs we surveyed totaled over 650,000 acres, with 452,000 of those acres in Texas alone. In the other four states, the surveyed DMCs totaled 200,478 acres (Georgia, 70,955 acres, Michigan, 50,414 acres, Missouri, 27,449 acres, and New York, 51,660 acres).
Working with QDMA staff, we distributed the “2017 Deer Management Cooperative Survey” to DMC leaders in August 2017 using electronic survey platform SurveyMonkey® (surveymonkey.com). Following Dillman’s Tailored-Designed Method, we contacted each DMC leader four times reminding them to send the survey link to their respective members (Dillman et al., Citation2014). Three New York DMCs received hard copy surveys due to religious practices that prohibited their use of technology (e.g., internet). Paper surveys were sent to a single contact representing all three DMCs who then personally distributed the survey throughout their membership (n = 115). Across all DMCs, we relied upon DMC leaders to administer the survey to their members via an e-mail with an embedded Survey Monkey link or by hard copy as in the New York case described above. By depending on DMC leaders to administer the survey to their members, the representativeness of the sample cannot be assessed.
We received 481 total responses out of 2,817 surveys distributed over the 5-month period. We deemed 459 responses usable, with respondents finishing at least 75% of the survey and providing answers to the motivational questions. The overall response rate was 16.3%, with state response rates ranging from 5.0% (Texas) to 36.5% (Michigan). Of the total usable responses, 60 were from Georgia (13.1%), 57 from Missouri (12.4%), 161 from Michigan (35.1%), 112 from New York (24.4%), and 69 from Texas (15.0%). The survey was administered by QDMA, and therefore, the University of Georgia’s Institutional Review Board (IRB) decided that a formal review of the study was not needed even though an initial IRB application was submitted (IRB Study: STUDY00004633).
Construct Measurement
Our survey collected information on the following: member demographic characteristics, deer management type, perception of DMC success, DMC habitat management preferences, rating of current and previous deer hunting quality, importance-performance analysis on various DMC attributes, along with DMC member importance and likelihood for potential DMC conservation and habitat management activities.
For ILA questions, we asked respondents to rate their perceived importance level of 5 different DMC conservation actions using a 7-point Likert-type scale (Likert, Citation1932). The five conservation actions were: 1) enrolling in government cost-share programs (e.g., Conservation Reserve Program, Environmental Quality Incentive Program), 2) becoming a member of a conservation NGO (e.g., Quality Deer Management Association, National Wild Turkey Federation, Ducks Unlimited), 3) increasing days per year spent on habitat management (e.g., food plots, timber stand improvement, prescribed fire), 4) increasing money per year spent on habitat management, and 5) specifically managing habitat for species other than white-tailed deer. Next, using a 7-point Likert-type scale, we asked DMC members to indicate the likelihood of implementing the same 5 conservation actions. The 7-point importance Likert-type scale ranged from 1 = “Not at All Important” to 7 = “Very Important,” and the 7-point likelihood scale range from 1 = “Very Unlikely” to 7 = “Very Likely.” Having the importance and likelihood of implementing each conservation action measured on a 7-point Likert scale provided the ability to conduct the ILA and plot which managerially relevant quadrant each conservation action was assigned.
Following Kramer et al. (Citation2016) and Pruitt et al. (Citation2021), who described varying member motivations for DMC membership, we assessed hunter motivational-orientations using 19 questions modified from the existing literature (Applegate et al., Citation1982; Jackson et al., Citation1979; Miller et al., Citation2013). We based multiple questions on hunting attributes that were indicative of varying hunter-motivational stages (e.g., harvest a mature buck, harvest as many white-tailed deer as possible, make memories, be close to nature, harvest deer for eating; Applegate et al., Citation1982; Jackson et al., Citation1979).
Data Analysis
Principal Component Factor Analysis using varimax rotation reduced the number of motivations from 19 to 14 and identified four unique hunter motivations for joining DMCs: “Disconnecting,” “Locavore,” “Social Inclusion,” and “Harvest Quality” (). “Disconnecting” motivations are characterized by getting away from people, the regular routine, or technology. “Locavore” motivations are characterized by local and sustainable meat procurement. “Social Fabric” motivations include enjoying hunting with others and family. “Quality Harvest” motivations include targeting mature or trophy bucks. All four motivation latent constructs consist of three to four motivation questions with factor loadings above 0.6 and Cronbach’s alpha ranging from 0.74 to 0.88, indicating that they were reliable and valid measures of hunter motivation (Nunnally, Citation1978; Santos, Citation1999; ).
Table 1. Result from exploratory factor analysis of DMC members’ motivation for white-tailed deer hunting from question 17 of the 2017 deer management cooperative member survey.
Following PCA, we performed a K-means cluster analysis using the four motivational constructs to segment DMC members by primary motivations for DMC membership (MacQueen, Citation1967). Guidelines for determining specific cluster numbers do not exist in the literature, and it is recommended that the number of clusters be useful to resource managers (Payne & Payne, Citation1993). We initially explored K-means cluster analysis using 2, 3, 4, and 5 clusters. However, four clusters were ultimately chosen based upon adequate cluster membership with managerial appropriate implications (). Cluster centers (e.g., motivational influence means) from K-means cluster analysis were used to determine overall motivational-orientation, resulting in cluster membership labels: Cluster 1: Solitude Member, Cluster 2: Social Member, Cluster 3: Representative Member, and Cluster 4: Quality Harvest Member. Solitude members are those who were least motivated by social inclusion and who had an above average motivation to disconnect. Social members were those who were primarily motivated by the desire for social inclusion and who had below average motivations for harvest quality. The Representative member cluster constitutes DMC members who were jointly motivated by disconnecting, harvesting local meat, having a social outlet, and harvest of quality bucks. In essence, Representative members see DMCs as providing multiple benefits that cover all motivations categories. Lastly, Quality Harvest members are those who are primarily motivated by the potential for DMCs to increase hunting quality. Clusters were analyzed with univariate analysis of variance (ANOVA) and ILAs to understand the association between hunter motivation and how DMC member perceived importance and subsequent likelihood of conservation behavior implementation.
Table 2. Hunter motivation final cluster centers from a 2017 DMC member survey study of deer management cooperative management attributes. Positive values indicate above-average positive responses on that given motivation and negative values represent below-average response on that motivation. Degree of influence (positive or negative) is indicated by larger values above or below zero (neutral = 0).
We illustrated ILA results using a two-dimensional graph in the first quadrant (positive,
positive) of the Cartesian system. The first quadrant was subsequently split into four sub-quadrants to aid visual assessment of management priorities. The axes display likelihood of attribute implementation (x-axis) and attribute importance (y-axis) values, both ranging from low to high based on Likert-type scale responses. We determined management priorities of given attributes by the discrepancy in mean behavior importance and mean behavior likelihood attribute. Each sub-quadrant area depicts a different management action based on the relationship between importance and likelihood scores for each attribute. The first sub-quadrant (Q1) depicts high behavior importance and high attribute likelihood (“Keep Up the Good Work”). The second
sub-quadrant (Q2) depicts high behavior importance and low behavior likelihood (“Easy Sell”). The third sub-quadrant (Q3) displays low behavior importance and low behavior likelihood (“Hard Sell”), while the fourth sub-quadrant (Q4) displays low behavior importance and high behavior likelihood (“Communicate Value/Importance”). Traditional Cartesian-quadrant labels were used (i.e., Q1 – Q4), while traditional management-action nomenclature (e.g.,“Keep Up the Good Work”) for each quadrant was followed (; Martilla & James, Citation1977).
With IPA/ISA/ILA, researchers have the important but subjective decision of where to place the crosshairs that create the four managerially relevant quadrants (Boley et al., Citation2017; Oh, Citation2001). The most transparent way to set crosshairs is the scale-centered method, which sets crosshairs at the middle point of the Likert scale responses. While transparent, Taplin (Citation2012, p. 29) criticizes the scale-centered method because most attributes end up falling in the “Keep Up the Good Work” quadrant as respondents are prone to give high performance and importance ratings. Oh (Citation2001, p. 622) refers to this as the “ceiling effect” because researchers “tend to use a selected set of key – therefore, ‘important’ already in its own right – attributes to measure importance.” A solution many researchers implement to combat the “ceiling effect” is data-centered crosshairs (Boley et al., Citation2017; Sever, Citation2015). The data-centered crosshair placement controls for inflated importance and performance/satisfaction/likelihood ratings by using crosshairs representing mean importance and performance/satisfaction/likelihood values to provide a comparison of attributes relative to others within the analysis. Another helpful discriminating threshold is an iso-rating line – a 45° diagonal line that separates the first quadrant into two regions. The two regions created depict where likelihood exceeds importance (i.e., above the line), and where likelihood falls below importance (i.e., below the line).
Our results focused on the data-centered method; however, both scale-centered crosshairs and an iso-rating line are provided on ILA figures to provide transparency and address any concerns about limitations for either approach (Boley et al., Citation2017; Sever, Citation2015; ). We calculated mean importance and likelihood values for all respondents and by motivation-based clusters (). We also conducted 5 separate ANOVAs to compare means of the four DMC member motivational orientation clusters for behavior importance and likelihood scores (). We evaluated differences between clusters at the attribute level using α ≤ 0.05 and conducted Bonferroni Post Hoc Tests to determine differences between clusters.
Figure 2. Important-likelihood analysis (ILA) of member motivation-orientation cluster solitude member from a 2017 QDMA deer management cooperative survey respondents in Georgia, Missouri, Michigan, New York, and Texas, USA. Data-centered crosshairs (dotted lines) are centered to the mean responses for all cluster members. Scale‐centered crosshairs (solid line) are centered to the mean of the measurement scale. The dashed line is a 1:1 reference line. Attributes are A) Enroll in government cost-share programs (e.g., conservation reserve program, environmental quality incentive program, etc.), B) Become a member of a conservation NGO (e.g., quality deer management association, national wild turkey federation, ducks unlimited, etc.), C) Increase days per year spent on habitat management (e.g., food plots, timber stand improvement, prescribed fire, etc.), D) Increase money per year spent on habitat management, E) Specifically manage habitat for species other than white-tailed deer.
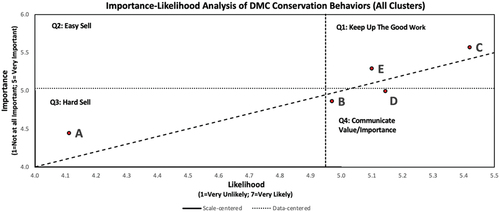
Figure 3. Important-likelihood analysis (ILA) of member motivation-orientation cluster social member from a 2017 QDMA deer management cooperative survey respondents in Georgia, Missouri, Michigan, New York, and Texas, USA. Data-centered crosshairs (dotted lines) are centered to the mean responses for all cluster members. Scale‐centered crosshairs (solid line) are centered to the mean of the measurement scale. The dashed line is a 1:1 reference line. Attributes are A) Enroll in government cost-share programs (e.g., conservation reserve program, environmental quality incentive program, etc.), B) Become a member of a conservation NGO (e.g., quality deer management association, national wild turkey federation, ducks unlimited, etc.), C) Increase days per year spent on habitat management (e.g., food plots, timber stand improvement, prescribed fire, etc.), D) Increase money per year spent on habitat management, E) Specifically manage habitat for species other than white-tailed deer.
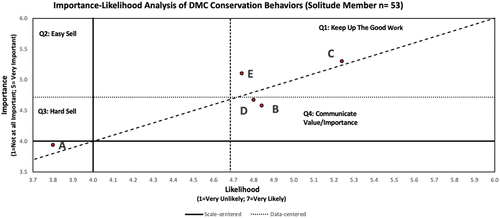
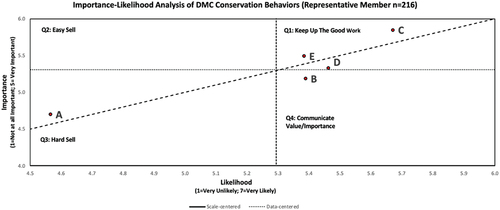
Figure 4. Important-likelihood analysis (ILA) of member motivation-orientation cluster representative member from a 2017 QDMA deer management cooperative survey respondents in Georgia, Missouri, Michigan, New York, and Texas, USA. Data-centered crosshairs (dotted lines) are centered to the mean responses for all cluster members. Scale‐centered crosshairs (solid line) are centered to the mean of the measurement scale. The dashed line is a 1:1 reference line. Attributes are A) Enroll in government cost-share programs (e.g., conservation reserve program, environmental quality incentive program), B) Become a member of a conservation NGO (e.g., quality deer management association, national wild turkey federation, ducks unlimited), C) Increase days per year spent on habitat management (e.g., food plots, timber stand improvement, prescribed fire), D) Increase money per year spent on habitat management, E) Specifically manage habitat for species other than white-tailed deer.
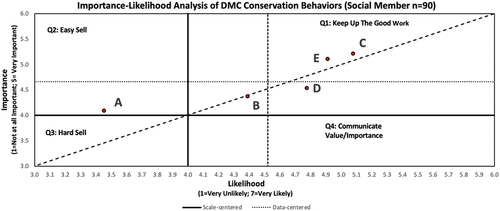
Figure 5. Important-likelihood analysis (ILA) of member motivation-orientation cluster quality harvest member from a 2017 QDMA deer management cooperative survey respondents in Georgia, Missouri, Michigan, New York, and Texas, USA. Data-centered crosshairs (dotted lines) are centered to the mean responses for all cluster members. Scale‐centered crosshairs (solid line) are centered to the mean of the measurement scale. The dashed line is a 1:1 reference line. Attributes are A) Enroll in government cost-share programs (e.g., conservation reserve program, environmental quality incentive program), B) Become a member of a conservation NGO (e.g., quality deer management association, national wild turkey federation, ducks unlimited), C) Increase days per year spent on habitat management (e.g., food plots, timber stand improvement, prescribed fire), D) Increase money per year spent on habitat management, E) Specifically manage habitat for species other than white-tailed deer.
Results
Survey Demographics
Respondents were primarily male (94.7%) with an average age of 50 years old (SD ± 14.2, range = 18–86) (). The sample was predominantly Caucasian (95.3%) with most household incomes between $50,000 and $99,999 and a median household income level between $100,000 and $150,000 (). The most common level of education was a bachelor’s degree (34%). Most respondents had hunting access as private landowners (67.7%), whereas the remaining respondents either belonged to a hunting club (14.4%), were granted hunting rights from a landowner (13%), or leased hunting rights from an individual (4.9%).
Table 3. Gender, approximated age, ethnicity, education, household income, hunting rights type, and occupation for all respondents and clusters of the 2017 QDMA DMC member survey.
Cluster Motivations
The cluster motivation analysis utilized for this ILA analysis was previously produced as part of Pruitt et al. (Citation2021). Deer management cooperative members’ motivations for deer hunting varied with socializing with other hunters as the primary motivation (social = 5.89, SD ± 0.26) followed by escaping from the regular routine of life (disconnect
= 5.64 ± 0.31), harvesting sustainable locally sourced meat (locavore
= 5.12 ± 0.41), and harvesting mature bucks (quality harvest
= 4.94 ± 0.69). K-means cluster analysis resulted in 4 clusters: Solitude member (n = 53), Social member (n = 91), Representative member (n = 224), Quality harvest member (n = 91). The Solitude member cluster was the smallest cluster, characterized by an extremely strong negative cluster center for social inclusion (−2.01), whereas the escape motivation was the only positive motivation (0.06). The Social member cluster was characterized by positive cluster centers for both escape (0.13) and social inclusion (0.21), with a strong negative motivation toward harvest quality (−1.38). The Representative member cluster, the largest cluster, was characterized by positive cluster centers for all four motivations: escape (0.47), locavore (0.05), social inclusion (0.33), and harvest quality (0.44). Finally, the Quality harvest member cluster was characterized by a strong positive motivation for harvest quality (0.41) coupled with a strong negative motivation for the escape motivation (−1.33).
Overall Importance-Likelihood Analysis
DMC members reported that C) Increasing days per year spent on habitat management (e.g., food plots, timber stand improvement, prescribed fire), and E) Specifically managing habitat for species other than white-tailed deer were the most important conservation actions to them out of the five conservation actions provided ( ≥ 5 on a 1–7 scale (). The conservation actions with the highest likelihood of being implemented by DMC members (
≥ 5.0) were: C) Increasing days per year spent on habitat management (e.g., food plots, timber stand improvement, prescribed fire), D) increasing money per year spent on habitat management, and E) Specifically manage habitat for species other than white-tailed deer (). Conservation behaviors least likely to be implemented were A) Enrolling in government cost-share programs, and B) Becoming a member of a conservation NGO (e.g., Quality Deer Management Association, National Wild Turkey Federation, Ducks Unlimited). It should be noted that B) Becoming a member of a conservation NGO (
= 4.97 ± 1.77) measured slightly above the overall mean likelihood estimate (
= 4.95) but had the second lowest likelihood of the five conservation behaviors to be implemented. DMC members were more likely to implement conservation behaviors that centered around personal/private allocations of time or money vs. those that requiring a version of government or non-governmental (NGO) affiliation, such as A) Enrolling in government cost-share programs (
= 4.15 ± 1.88) or B) Becoming a member of a conservation NGO (
= 4.97 ± 1.77).
Figure 6. Important-likelihood analysis (ILA) for all 2017 QDMA deer management cooperative survey respondents in Georgia, Missouri, Michigan, New York, and Texas, USA. Data-centered crosshairs (dotted lines) are centered to the mean responses for all cluster members. Scale‐centered crosshairs (solid line, axis) are centered to the mean of the measurement scale. The dashed line is a 1:1 reference line. Attributes are A) Enroll in government cost-share programs (e.g., Conservation reserve program, environmental quality incentive program), B) Become a member of a conservation NGO (e.g., Quality deer management association, national wild turkey federation, ducks unlimited), C) Increase days per year spent on habitat management (e.g., food plots, timber stand improvement, prescribed fire), D) Increase money per year spent on habitat management, E) Specifically manage habitat for species other than white-tailed deer.
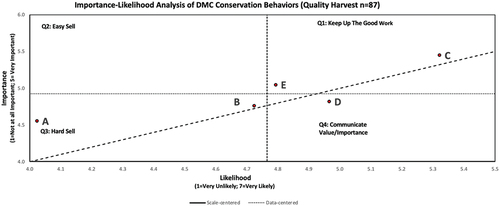
Table 4. ANOVAs results of mean importance-likelihood scores by cluster membership used for 5 deer management cooperative member conservation actions measured in a 2017 deer management cooperative survey. Bonferroni post hoc test was used to determine statistically significant differences in means, which are labeled with different letters correlated by cluster name (a,b,c,d).
When the mean importance and likelihood of implementing these conservation actions were graphed within the ILA, the two conservation actions that fell within Q1 (Keep up the good work) included: C) Increasing days per year spent on habitat management, and E) Specifically managing habitat for species other than white-tailed deer (). No conservation actions fell within Q2 (Easy Sell). Conservation actions that fell into in Q3 (Hard Sell) were limited to just A) Enrolling in a government cost-share program. Finally, the two conservation actions that fell within Q4 (Communicate Value/Importance) include B) becoming a member of a conservation NGO and D) increasing money per year spent on habitat management.
Motivation Cluster Importance-Likelihood Analysis
The ILAs by motivational cluster demonstrated broad agreement for three of the five conservation actions (). All clusters agreed that C) increasing days per year spent on habitat management and E) specifically managing habitat for species other than white-tailed deer fell within sub-quadrant Q1 (Keep Up the Good Work) highlighting an underlying commitment to conservation implementation despite motivational differences. All clusters also agreed that A) enrolling in government cost-share programs (e.g., Conservation Reserve Program, Environmental Quality Incentive Program, etc.) was a Hard Sell (Q3). The differences were on the conservation actions B) Becoming a member of a conservation NGO, and D) Increasing money per year spent on habitat. 3 of 4 clusters had conservation action D) Increasing money per year on habitat management within sub-quadrant Q4 (Communicate Value/Importance) with the outlier being the Representative Member cluster who had it within the Q1: Keep up the Good Work (). Behavior B) becoming a member of a conservation NGO, fell within Q3 (Hard Sell) and Q4 (Communicate Value/Importance) for 2 clusters each. For example, the Social and Quality Harvest clusters rate B) become a member of a conservation NGO as less important (= 4.37, SD ± 1.62 and 4.76 ± 1.42, respectively (), whereas Solitude and Representative cluster rate membership in an NGO as more important (
= 4.58 ± 1.68 and 5.19 ± 1.36, respectively) and more likely to engage in (
= 4.84 ± 1.83 and 5.39 ± 1.52, respectively), resulting in subsequent differences ().
ANOVA
Statistical differences among clusters for the importance and likelihood of implementing all five conservation actions are presented in . The Representative cluster placed the highest importance scores ( = 5.31 ± 1.25) and likelihood scores (
= 5.29 ± 1.41) on all 5 behaviors (, ); consistently rating conservation behaviors higher than the other three clusters. For example, the Representative cluster was the only cluster to rate both importance and likelihood for behavior B) become a member of a conservation NGO, above a 5.0 (
= 5.18 ± 1.36,
= 5.39 ± 1.52; 1.0–7.0 Likert-type scale). Social members assigned the lowest importance (
= 4.66 ± 1.40) and likelihood scores (
= 4.52 ± 1.74; ). The mean score for all importance scores was 5.04 (± 1.33) on a 7-point scale, falling squarely on the slightly important category. Mean importance scores for each of the four clusters, calculated using all 5 behaviors fell between 4.5 and 5.5 on the 7-point scale: Solitude member (4.72 ± 1.40), Social member (4.66 ± 1.40), Representative member (5.31 ± 1.25), and Quality harvest member (4.93 ± 1.29).
Analysis of variance models also quantified significant differences between cluster likelihood values for all 5 conservation actions (). Corresponding to importance results, Representative members also indicated the highest likelihood values for all five conservation behaviors. Behaviors that involve a direct increase in days or money spent per year on habitat management resulted in higher than average likelihood scores across all clusters. For example, only C) increasing days per year spent on habitat management received a likelihood of implementation score above 5.0 from all DMC member clusters. The mean score for overall likelihood was 4.95 (± 1.58) on a 7-point scale (just below the somewhat likely category). Mean likelihood scores for each of the four clusters, calculated using all five attributes, were as follows: Solitude member 4.68 (± 1.63), Social member 4.52 (± 1.74), Quality harvest member 4.77 (± 1.60), and Representative member 5.29 (± 1.41).
Discussion
Utilizing private-land deer management cooperatives to achieve desired conservation action has been described theoretically, yet DMC member intent was not quantified prior to our study (Pruitt et al., Citation2021). Even though we had a relatively low response rate of 16.3%, our research is novel in the sense that the findings from 459 DMC members across five states point to the potential of DMCs to be used as conduits to facilitate connections among motivated individuals or landowners, with the capacity to carry out conservation actions on a scale desired by state and federal conservation planners. Our results indicate that DMC members are most likely ( ≥ 5.0) to: C) Increase days per year spent on habitat management (e.g., food plots, timber stand improvement, prescribed fire, etc.), D) Increase money per year spent on habitat management, and E) Specifically manage habitat for species other than white-tailed deer (). All three of these conservation actions are desired by the broader conservation community and are sufficiently important to DMC members to produce action on their own accord. Previous research indicates that federal and state conservation planners struggle to identify practical dissemination channels to overcome competing objectives without consistent financial incentives (Dayer et al., Citation2018). However, our results indicate that utilizing enthusiasm of private landowner deer management cooperatives is a viable channel to achieve conservation goals without any requisite financial incentive from federal cost-share programs (Conservation Reserve Program, Environmental Quality Incentive Program, etc.). In fact, government cost-share programs were the least likely conservation action to be implemented across the four clusters consistently falling into the “Hard Sell” quadrant for all responding DMC members. The likelihood of DMC members implementing conservation actions, without government payment, indicates that member decisions may not be as financially driven as those of agricultural producers. Agricultural producers often require adequate financial incentives to convert land from crops to conservation (Sweikert & Gigliotti, Citation2019).
Although local DMC frameworks lend themselves to efficient conservation distribution for conservation planners, widespread utilization could experience social hurdles. In some instances, partnerships with DMCs could be challenged by a general lack of trust or confidence in state or federal authorities. Hesitancy to align with regulatory authorities with perceived differences in management goals is seen across other areas of hunter–government relations and in many surveys of hunters (Riley et al., Citation2018; Schroeder et al., Citation2017; Vaske et al., Citation2004). Specifically, DMCs lack of confidence likely stems from voluntarily implementing more restrictive buck harvest regulations than current state game laws to accomplish locally desired deer management goals (Mitterling et al., Citation2021). Our results suggest that the least important and least likely conservation action to be achieved by co-ops is A) Enrollment in government cost-share programs (Conservation Reserve Program, Environmental Quality Incentive Program). DMC members rated this action (A) as a “Hard Sell,” while conservation action B) Becoming a member of a conservation NGO, measured slightly above the mean likelihood ( = 4.97 ± 1.77). NGO membership elicited the second lowest importance score of the five conservation actions, further indicating the potential hurdles for nationwide DMC utilization by government or NGO personnel. This suggests that hurdles in DMC utilization could potentially be addressed with a private network like agricultural cooperatives that provide supplies and information directly to farmers, separate from NGO or governmental agencies (Cook, Citation1995).
Concurrently, our results suggest that DMC members favored conservation actions that centered around personal/private allocations of time and money versus those requiring government or NGO association. Previously described in the literature by Sorice et al. (Citation2011), a large segment of central Texas private landowners indicated willingness to participate in large-scale land cover management for non-game species management with a “strong positive attitude, perceived social pressure to participate, and willing to participate with relatively few incentives.” In line with these findings, we describe the highest importance and likelihood scores for all hunter motivational clusters as C) Increasing days per year spent on habitat management, and E) Specifically managing habitat for species other than white-tailed deer (). These two conservation actions rated as the highest overall likelihood and importance score for all co-op members. Conservation utility of DMCs to achieve tangible implementation of wildlife habitat management goals, by leveraging enthusiasm for America’s most widely distributed and hunted game animal (i.e., white-tailed deer), hinges on this voluntary desire to manage landscape-scale wildlife habitat and land cover in a manner beneficial to a large suite of game and non-games species.
Governments around the world use a variety of voluntary, financially incentivized conservation enrollment opportunities in agriculturally dominated landscapes (Mills et al., Citation2018). These different payment approaches often suffer from inefficient implementation without a targeted approach (Lankoski, Citation2016; McConnell & Burger, Citation2017). In the United States, two of the most common programs that apply to agriculture and forest management are the Conservation Reserve Program (CRP) and Environmental Qualities Incentive Program (EQIP). Both are financial-incentive-based programs offered through the federal government’s Farm Bill, with cost-share payments made to the landowners over a fixed length of time. In Europe, Agri-environmental Schemes (AES) facilitate continued farm connections across rural landscapes, facilitating subsidized farm-payment opportunities along with a considerable amount of unsubsidized environmental activity. In most previously documented partnerships between private landowners and governments around the world, financial incentives serve as a dominant factor for enrollment or continued participation in these programs (Dayer et al., Citation2018; Mills et al., Citation2018).
DMCs are voluntary partnerships, driven by local “buy-in,” with the experience-based incentive structures such as: increased hunter satisfaction, accomplishment of large-scale deer management goals, and increased engagement with surrounding social networks (Grado et al., Citation2010; Mitterling, Citation2013; Pruitt et al., Citation2021; Stout et al., Citation2013). The general advantage of DMCs lies in their likelihood to implement conservation objectives through this voluntary, yet intentional, willingness to carry out wildlife and habitat management activities (i.e., food plots, timber stand improvement, prescribed fire, etc.), in line with regional and national wildlife conservation goals at minimal expense to conservation planners. Much like European AES, we see that DMC motivations allow for unsubsidized environmental activity by private landowners. These conservation actions are not bound by overarching deer management goals but extend to the periphery of holistic land management for game and non-game species. DMC members explicitly expressed their willingness to engage in likely conservation action to “specifically manage habitat for species other than white-tailed deer” (E). When this sentiment is coupled with a desire to increase both time and money (C, D), the conservation community is offered an improbable opportunity to leverage private landowner enthusiasm for white-tailed deer management without a continual financial investment.
Utilizing DMCs to increase available habitat resources is a novel approach to mitigating wildlife habitat loss under the current “Abrahamic concept of land” framework that has plagued privately held land management of the previous century (Leopold, Citation1989). DMCs reside at the confluence of private landowner wildlife management and federal/state landscape-level wildlife conservation objectives. Our research indicates that DMCs operate at this convergence between theoretically conflicting principles (e.g., private land management v. public goods), facilitating the delivery of valuable landscape and wildlife conservation tactics to vast private landscapes. Understanding DMC member motivations, and their impact on unsubsidized conservation activity, can inform messaging and private-landowner program design that encourages widespread voluntary partnerships. Future research should investigate viable incentive and technical assistance structures to increase DMC utilization, and how DMCs can impact resource management through citizen science opportunities. With vast networks of actively managed private lands, agency personnel can utilize co-op programs in some of the same manners that they already utilize private-land deer management assistance programs (DMAP) to collect wildlife harvest, observational, or trail camera data, offering large-scale collection opportunities (Miller & Marchinton, Citation1995). Citizen-science has increasingly grown in popularity as a conservation tool in urban and residential ecosystems (Cooper et al., Citation2007), and DMCs offer a viable social network to influence citizen science in rural settings (Mitterling, Citation2013). The likelihood of DMC membership to implement conservation actions should also be defined by region and landscape, allowing conservation planners to understand DMC utility within differing landscapes and historical attitudes toward agency partnership. Finally, a full assessment of underlying economic incentive structures that may influence DMC attribute importance and subsequent likelihood to create actionable conservation value should be completed.
Our results indicate that achievement of local deer management goals currently serve as an appropriate and effective incentive structure to promote landscape conservation by private landowners at the scales needed nationally, aligning private management priorities with widespread public expectations for resource management. Managerially, DMCs can facilitate desired enhancement of habitat for game and non-game species on private lands by landowners with direct land access and decision-making authority. If DMCs, or private landowner cooperatives in general, are to be utilized as a landscape planning tool, then collaborations should center around voluntary, private, or non-regulatory opportunities.
Disclosure Statement
No potential conflict of interest was reported by the authors.
Additional information
Funding
References
- Adams, K., & Ross, M. (2017). QDMA’s whitetail report 20171. Quality Deer Management Association (QDMA) (pp. 27–29). https://deerassociation.com/wp-content/uploads/2017/03/WR-2017.pdf
- Applegate, J. E., Otto, R. A., & Buttitta, J. A. (1982). A cluster analysis of appreciative wildlife users. Wildlife Society Bulletin (1973-2006), 10(1), 65–70. https://www.jstor.org/stable/3781807
- Boley, B. B., McGehee, N. G., & Hammett, A. L. T. (2017). Importance-performance analysis (IPA) of sustainable tourism initiatives: The resident perspective. Tourism Management, 58(1), 66–77. https://doi.org/10.1016/j.tourman.2016.10.002
- Brown, D. G., Johnson, K. M., Loveland, T. R., & Theobald, D. M. (2005). Rural land-use trends in the conterminous United States, 1950-2000. Ecological Applications, 15(6), 1851–1863. https://doi.org/10.1890/03-5220
- Cook, M. L. (1995). The future of U.S. agricultural cooperatives: a neo-institutional approach. American Journal of Agricultural Economics, 77(5), 1153–1159. https://doi.org/10.2307/1243338
- Cooper, C. B., Dickinson, J., Phillips, T., & Bonney, R. (2007). Citizen science as a tool for conservation in residential ecosystems. Ecology and Society, 12(2), 1-11. https://doi.org/10.5751/ES-02197-120211
- Dayer, A. A., Lutter, S. H., Sesser, K. A., Hickey, C. M., & Gardali, T. (2018). Private landowner conservation behavior following participation in voluntary incentive programs: Recommendations to facilitate behavioral persistence. Conservation Letters, 11(2), e12394. https://doi.org/10.1111/conl.12394
- Decker, D. J., & Connelly, N. A. (1989). Motivations for deer hunting: Implications for antlerless deer harvest as a management tool. Wildlife Society Bulletin, 17(4), 455–463. https://www.jstor.org/stable/3782713
- Dillman, D. A., Smyth, J. D., & Christian, L. M. (2014). Internet, phone, mail, and mixed-mode surveys: The tailored design method (4th ed.). John Wiley & Sons.
- Grado, S. C., Measells, M. K., & Miller, D. A. (2010). Hunter attitudes toward hunting club cooperatives and quality deer management on forest industry lands. Proc. Annu. Conf. Southeast. Assoc. Fish Wildlife Agencies, 64(1), 68–74 https://seafwa.org/sites/default/files/journal-articles/12%252520Grado%252520et%252520al%25252068-74.pdf.
- Jackson, R. M., Norton, R. C., & Ray, A. (1979). Improving ethical behavior in hunters. US Department of the Interior, Fish and Wildlife Service.
- Jackson, R., & Norton, R. (1980). Phases: The personal evolution of the sport hunter. Wisconsin Sportsman, 9(6), 17–20.
- Kramer, D. B., Mitterling, A., & Frank, K. A. (2016). Understanding peer influence in hunter harvest decisions using social network theory and analysis. Human Dimensions of Wildlife, 21(5), 414–426. https://doi.org/10.1080/10871209.2016.1183243
- Lankoski, J. (2016). Alternative payment approaches for biodiversity conservation in agriculture. https://doi.org/10.1787/18156797
- Leopold, A. (1989). A sand county almanac, and sketches here and there. Oxford University Press.
- Likert, R. (1932). A technique for the measurement of attitudes. Archives of Psychology, 22(140), 55.
- MacQueen, J. (1967, June). Some methods for classification and analysis of multivariate observations. In Proceedings of the Fifth Berkeley Symposium on Mathematical Statistics and Probability Vol. 1, No. 14, (pp. 281–297).
- Martilla, J. A., & James, J. C. (1977). Importance-performance analysis. Journal of Marketing, 41(1), 77–79. https://doi.org/10.1177/002224297704100112
- McConnell, M. D., & Burger, L. W., Jr. (2017). Precision conservation to enhance wildlife benefits in agricultural landscapes. Precision Conservation: Geospatial Techniques for Agricultural and Natural Resources Conservation, 59, 285–312. https://doi.org/10.2134/agronmonogr59.2013.0031
- Miller, K. V., & Marchinton, R. L. (1995). Quality whitetails: The why and how of quality deer management. Stackpole Books.
- Miller, C. A., McCleary, M. E., Stephenson, A. L., Harper, E. E., & Campbell, L. K. (2013). Assessment of Illinois Dove hunter satisfaction, retention, and attitudes toward non-toxic shot. Illinois Natural History Survey. http://hdl.handle.net/2142/47528
- Mills, J., Gaskell, P., Ingram, J., & Chaplin, S. (2018). Understanding farmers’ motivations for providing unsubsidized environmental benefits. Land Use Policy, 76(July), 697–707 doi:10.1016/j.landusepol.2018.02.053.
- Mitterling, A. M. (2013). Private land deer cooperatives harvest and satisfaction analysis in southern lower Michigan. Michigan State University. Fisheries and Wildlife. https://d.lib.msu.edu/islandora/object/etd:703/datastream/OBJ/download/PRIVATE_LAND_DEER_COOPERATIVES_HARVEST_AND_SATISFACTION_ANALYSIS_IN_SOUTHERN_LOWER_MICHIGAN.pdf
- Mitterling, A. M., Rudolph, B. A., & Kramer, D. B. (2021). The influence of private land deer management cooperatives on harvest outcomes and hunter satisfaction. Wildlife Society Bulletin, 45(3), 456–464. https://doi.org/10.1002/wsb.1209
- Murphy, B. P. (2011). Deer management trends. In D. G. Hewitt Ed., Biology and management of white-tailed deer (1st ed., pp. 624–627). CRC Press. https://doi.org/10.1201/9781482295986
- Nunnally, J. C. (1978). Psychometric Theory (2nd ed.). Mcgraw Hill.
- Oh, H. (2001). Revisiting importance-performance analysis. Tourism Management, 22(6), 617–627. https://doi.org/10.1016/S0261-5177(01)00036-X
- Payne, A., & Payne, A. (1993). The essence of services marketing. Prentice Hall.
- Pruitt, H. P., Boley, B. B., D’angelo, G. J., Murphy, B. P., & Mcconnell, M. D. (2021). Importance—satisfaction analysis of deer management cooperative members. Wildlife Society Bulletin, 45(1), 85–96. https://doi.org/10.1002/wsb.1158
- Quality Deer Management Association (QDMA). (2005). Developing successful quality deer management cooperatives. Brochure. pp.1–10.
- Riley, S. J., Ford, J. K., Triezenberg, H. A., & Lederle, P. E. (2018). Stakeholder trust in a state wildlife agency. The Journal of Wildlife Management, 82(7), 1528–1535. https://doi.org/10.1002/jwmg.21501
- Rosenberger, J. P. (2020). Movements of Public Land White-tailed Deer Hunters and Adult Female Deer and an Evaluation of Hunter Satisfaction, Motivations, and Preferences in the Mountains of Northern Georgia [ Doctoral dissertation], University of Georgia. https://www.proquest.com/openview/a8a0ded3fdf26f4cad393f9ff42b833e/1.pdf?pq-origsite=gscholar&cbl=18750&diss=y#page=87
- Santos, J. R. A. (1999). Cronbach’s alpha: A tool for assessing the reliability of scales. Journal of Extension, 37(2), 1–5 doi:10.4135/9781483381411.n492.
- Schroeder, S. A., Fulton, D. C., Lawrence, J. S., & Cordts, S. D. (2017). How hunter perceptions of wildlife regulations, agency trust, and satisfaction affect attitudes about duck bag limits. Human Dimensions of Wildlife, 22(5), 454–475. https://doi.org/10.1080/10871209.2017.1345021
- Sever, I. (2015). Importance-performance analysis: A valid management tool? Tourism Management, 48(June), 43–53. https://doi.org/10.1016/j.tourman.2014.10.022
- Sorice, M. G., Haider, W., Conner, J. R., & Ditton, R. B. (2011). Incentive structure of and private landowner participation in an endangered species conservation program. Conservation Biology, 25(3), 587–596. https://doi.org/10.1111/j.1523-1739.2011.01673.x
- Stout, S. L., Royo, A. A., Decalesta, D. S., McAleese, K., & Finley, J. C. (2013). The Kinzua Quality Deer Cooperative: Can adaptive management and local stakeholder engagement sustain reduced impact of ungulate browsers in forest systems? Boreal Environment Research, 18(suppl A), 50–64. https://helda.helsinki.fi/bitstream/handle/10138/229525/ber18A-50.pdf?sequence=1
- Sweikert, L. A., & Gigliotti, L. M. (2019). Evaluating the role of Farm Bill conservation program participation in conserving America’s grasslands. Land Use Policy, 81(February), 392–399. https://doi.org/10.1016/j.landusepol.2018.10.023
- Taplin, R. H. (2012). Competitive importance-performance analysis of an Australian wildlife park. Tourism Management, 33(1), 29–37. https://doi.org/10.1016/j.tourman.2011.01.020
- TenHarmsel, H. J., Boley, B. B., Irwin, B. J., & Jennings, C. A. (2019). An importance–satisfaction analysis of trout license holders in Georgia. North American Journal of Fisheries Management, 39(6), 1227–1241. https://doi.org/10.1002/nafm.10353
- Vaske, J. J., Timmons, N. R., Beaman, J., & Petchenik, J. (2004). Chronic wasting disease in Wisconsin: Hunter behavior, perceived risk, and agency trust. Human Dimensions of Wildlife, 9(3), 193–209. https://doi.org/10.1080/10871200490479981
- Vincent, C. H., Hanson, L. A., & Bjelopera, J. P. (2017). Federal land ownership: Overview and data (pp. 7–5700). Congressional Research Service. https://aquadoc.typepad.com/files/crs_fed_land_3march2017.pdf
- Wilson, G. A., & Hart, K. (2000). Financial imperative or conservation concern? EU farmers’ motivations for participation in voluntary agri-environmental schemes. Environment and Planning A: Economy and Space, 32(12), 2161–2185. https://doi.org/10.1068/a3311