
Abstract
Objectives: Emergency ambulance services do not transport all patients to hospital. International literature reports non-transport rates ranging from 3.7–93.7%. In 2017, 38% of the 11 million calls received by ambulance services in England were attended by ambulance but not transported to an Emergency Department (ED). A further 10% received clinical advice over the telephone. Little is known about what happens to patients following a non-transport decision. We aimed to investigate what happens to patients following an emergency ambulance telephone call that resulted in a non-transport decision, using a linked routine data-set. Methods: Six-months individual patient level data from one ambulance service in England, linked with Hospital Episode Statistics and national mortality data, were used to identify subsequent health events (ambulance re-contact, ED attendance, hospital admission, death) within 3 days (primary analysis) and 7 days (secondary analysis) of an ambulance call ending in non-transport to hospital. Non-clinical staff used a priority dispatch system e.g. Medical Priority Dispatch System to prioritize calls for ambulance dispatch. Non-transport to ED was determined by ambulance crew members at scene or clinicians at the emergency operating center when an ambulance was not dispatched (telephone advice). Results: The data linkage rate was 85% for patients who were discharged at scene (43,108/50,894). After removal of deaths associated with end of life care (N = 312), 9% (3,861/42,796) re-contacted the ambulance service, 12.6% (5,412/42,796) attended ED, 6.3% (2,694/42,796) were admitted to hospital, and 0.3% (129/42,796) died within 3 days of the call. Rates were higher for events occurring within 7 days. For example, 12% re-contacted the ambulance service, 16.1% attended ED, 9.3% were admitted to hospital, and 0.5% died. The linkage rate for telephone advice calls was low because ambulance services record less information about these patients (24% 2,514/10,634). A sensitivity analysis identified a range of subsequent event rates: 2.5–10.5% of patients were admitted to hospital and 0.06–0.24% of patient died within 3 days of the call. Conclusions: Most non-transported patients did not have subsequent health events. Deaths after non-transport are an infrequent event that could be selected for more detailed review of individual cases, to facilitate learning and improvement.
Background
Not all patients who contact the emergency ambulance service are taken to an emergency department. Patients with lower urgency health problems are discharged at scene or provided with clinical advice over the telephone and this can reduce pressure on key services within the emergency and urgent care system. Ambulance non-transport rates vary by country and has been recently shown to range between 4 and 94% in services from countries as diverse as North America, Europe, Australia, Asia, and Africa, with vulnerable groups such as children and the elderly often over represented (Citation1). In April 2016 to March 2017 in England in the United Kingdom (UK), the ambulance service responded to 6,247,259 emergency calls: in 48% of these calls, the patient was not transported to a hospital with an Emergency Department (ED); 38% of patients received an ambulance and were treated and discharged on scene and 10% of patients received clinical advice over the telephone (Citation2).
Research into cases where patients are sent an ambulance but not transported to hospital, also known as discharge at scene, has yielded variable results. Gratton et al. reports that 11% of non-transported patients are under-triaged, but conversely 30% of transports to the ED are unnecessary (Citation3). A recent systematic review found that within 24–48 hours of non-transport decisions, between 2.5 and 6.1% of patients re-contacted the ambulance service, 4.6–19% attended ED and mortality rates were between 0.2–3.5% (Citation1). However, this review identified problems with the evidence base as most studies could not control for confounding, reporting of estimate of variance was poor, and many studies used different classification systems to describe complaints. The review did identify that some non-transported patients are seeking further emergency healthcare with one or 2 days after the non-transport decision and that further research is required to identify what happens to this patient group (Citation1). Comparison between studies is challenging because individual studies tend to focus on specific decision makers or patient groups, for example, skill-level of attending paramedics, elderly people, falls, or children (Citation4). A systematic review, which identified and mapped evidence about ambulance service patient safety, found few adequately powered studies that addressed ambulance service patient safety (Citation4). Concern was expressed about use of inconsistent methods, definitions, and outcome measures and much of the research base was classed as poor quality.
Evidence relating to clinical advice over the telephone focusses mainly on the feasibility of telephone advice provided by ambulance services rather than assessment of its safety (Citation4). A systematic review of telephone advice for low urgency ambulance call found it to be safe in terms of unexpected deaths (Citation5) and a U.S. study of telephone advice for non-urgent 9-1-1 calls did not detect any adverse outcomes (Citation6). However, some studies have identified problems with safety in that a large proportion of patients subsequently accessed the ED or were admitted to hospital (Citation7) or there were concerns about the under-triage of more serious problems (Citation8).
Importance
The most common causes of litigation against ambulance services are attributable to non-transport decisions, such as failed or delayed treatment (18.4%), failed or delayed admission to hospital (12%), and failed or delayed diagnosis (12%). An expert group has also identified non-transport decision-making as one of the areas that could most improve patient safety in ambulance services (Citation4).
Research into the safety of non-transport decisions has been hindered by the lack of routinely available ambulance service data, and ambulance data linked to hospital or other outcome data sets (Citation9). For example, services in England do not routinely receive information about what happens to patients following discharge from ambulance service care. This lack of information and understanding about subsequent calls and post discharge health contacts has a detrimental impact on the ability of ambulance services to assess, evaluate and audit the safety of triage and transport decisions.
Goals of this Investigation
The aim of this research was to identify the rate of subsequent health events (ambulance re-contact, ED attendance, hospital admission, and death), following a non-transport decision.
Methods
Study Design and Setting
This research was a data linkage study between the national routine health and mortality data-sets to ambulance routine data-sets for a single ambulance service in England serving 4.8 million people.
Setting and Context
Emergency Medical Services are provided by 11 ambulance services within the National Health Service (NHS) to the population of 53 million people in England, UK. Ten of these ambulance services deal with over 99% of emergency ambulance calls from the population of England. Most calls are from patients calling 999 to request an ambulance—approximately 4 in 5 calls—with the remaining calls being passed directly through from patients calling a telephone helpline for urgent care called “NHS 1-1-1,” or through direct referral from a health professional requesting an emergency ambulance. Calls are taken by non-clinical staffs that use software to identify the priority of each call. The 10 ambulance services use 2 different priority dispatch systems: the Medical Priority Dispatch System (version 12.1 at the time of the study) and NHS Pathways. A small percentage of calls that are categorized as low priority are passed to clinicians in Emergency Operating Centers within each ambulance service for secondary triage. The clinicians in these Emergency Operating Centers use decision support software to determine whether the patient needs an ambulance or can be offered telephone advice only. This advice includes self-care advice or referral to a service such as primary care; an ambulance is not dispatched. For calls not sent for secondary triage, an ambulance is dispatched and patients may be attended by paramedics, paramedics with extended skills, or emergency care technicians with basic emergency training. The ambulance crew assesses and treats patients at scene and can discharge people at scene, transport them to a hospital-based emergency department, or transport them to another health facility such as a walk-in center. Decisions are made by paramedics in conjunction with patients and their families. Protocols exist for making decisions relating to transport of patients with some health conditions. Sometimes non-transport occurs due to patient refusal to travel. Non-transport rates in England at the time of data collection for this study were around 9% for telephone advice only and 37% for discharge at scene.
Ethics Approval
Ethical approval was obtained from North West Research Ethics Committee (REC reference; 14/NW/1388).Confidential Advisory Group (CAG) approval was obtained to use patient identifiable data to create the linked dataset (CAG reference: EEC 3-03 (d)/2012)
Obtaining and Linking Data
A patient level dataset for 6 months (January–June 2013) ambulance service call and clinical activity was linked with national datasets on health service use and mortality. A single ambulance service in England provided patient level information required for linkage to a national data service NHS Digital. NHS Digital undertook linkage of ambulance calls to Hospital Episode Statistics (HES) hospital admissions and ED attendance data and Office of National Statistics mortality data, using their standard data linking algorithm (Citation10). The data linking algorithm used the following variables for linkage: date of birth; postcode; NHS number; gender.
Overall, 83% (154,927/187,287) of patients in the sample were successfully linked by NHS Digital. Non-linkage occurred due to missing or incomplete patient identifying data held in the ambulance record, in particular date of birth. No date of birth data was available for patients receiving telephone advice only from a clinician, which initially resulted in no linkages for this group of patients. An information analyst at the ambulance service searched previous and subsequent ambulance clinical information to identify dates of birth, meaning that only patients who had previously contacted the ambulance service and received a face to face ambulance response had date of birth data necessary for successful linking.
The data-set was originally created to develop and test new ambulance service quality and performance measures (Citation11). We obtained permission from NHS Digital to reuse this dataset to identify the rate of subsequent events for patients who are not transported to hospital (Study code: DARS-NIC-315175-P8X6Z-v2 MR1357). Using the unique HES identifier generated for each patient in the study sample, it was possible to identify if individual patients had subsequent re-contacts with the ambulance service or contacts with other services (ED, hospital admission) or had died, following their original ambulance contact.
Inclusion and Exclusion Criteria
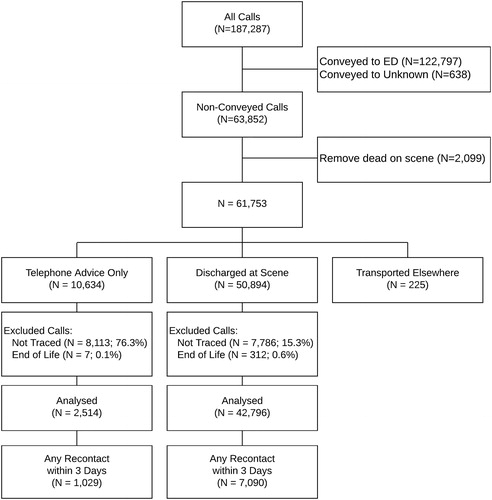
All patients that called the ambulance service were included in the ambulance data set ready for linkage with the following exceptions: attendances with no electronic patient report form (this is the record of the clinical consultation for calls attended by an ambulance crew; it was not practicable to include consultations recorded using paper forms); inter-hospital transfers (these calls do not require ambulance crews to make decisions about patient transports); calls passed to other ambulance services; and duplicate calls for the same incident. Those that were not matched by NHS Digital were excluded from the analysis. See for a flow diagram of exclusions.
Figure 1. Linked calls included in the analysis.
Following linkage, patients who died before the ambulance crew left the scene and deaths related to end of life care were excluded. For the latter exclusion, a medical practitioner author of this paper (NS) identified ICD-10 codes associated with end-of-life care and deaths recorded with these ICD10 codes were removed prior to analysis.
A patient report form is never available for calls ending in telephone advice so these calls were included using information from the ambulance call data only (Computer Aided Dispatch record). Only calls ending in telephone advice that received input from a clinician were included. Calls that were dealt with by a non-clinical call handler were excluded. This accounted for approximately 5,000 calls.
The proportion of non-transported calls available to our study was approximately 56% of those included in publically published monthly Ambulance Quality Indicators (AQIs) for the same time period (62000/110000). This was due to the exclusions previously listed and, also, due to the fact that our database was patient-based whereas the published AQIs were call-based. Patients included in our data-set included patients who had called the ambulance and were not transported for a variety of reasons including refusal to travel, ambulance crew members lifting a patient after a fall, and ambulance crew members or clinicians making decisions not to transport.
Outcomes
Four types of subsequent events were identified: ambulance service re-contacts, ED attendances, hospital admissions, and death. Previous studies have used a range of time points and definitions for measuring subsequent events, with subsequent events being calculated within hours or months of the original event (Citation12, Citation13). A shorter events time period ensures that events are more likely to be attributable to ambulance service care. However, if an event period is too short, some events attributable to the non-transport decision may be missed. A 3-day time frame was selected for the primary analysis and a 7 day time frame for a secondary analysis. National hospital admission’s data collects date of admission but not time; therefore, all times have been reported in days.
Analysis
Statistical analysis was undertaken using R. (new reference). The characteristics of patients who were matched by NHS Digital with those who were not matched were compared. A descriptive analysis was undertaken by calculating the frequency of different types of subsequent events. Due to the low match rate for calls receiving telephone advice only, a sensitivity analysis was conducted using 100% of the telephone advice only calls as the denominator to calculate minimum hospital admission and death rates; the primary telephone advice analysis was based on patients that were matched by NHS Digital, indicating maximum hospital admission and death rates. Further sensitivity analysis involved excluding patients aged >90 years, as these patients can be expected to have subsequent events, and excluding frequent callers (defined as people who contacted the service >6 times in a 6-month period) because these patients may be more likely to seek subsequent care for non-urgent health problems. We also looked at the number of subsequent events occurring within 7 days and compare this to our primary analysis of 3 days. Small numbers have been suppressed in tables to conform to NHS Digital’s data reporting policy (>5 are suppressed).
Results
Characteristics of Study Subjects
Whilst the overall data linkage rate was high (83%), this varied by types of non-transport decision. Eighty-four percent (43108/50894) of cases where patients were discharged at scene were matched to ambulance, HES and national mortality data. There was minimal overall difference between patient characteristics of the 84% of patients who were linked and the 16% who were not linked (see : Characteristics of linked and non-linked calls). Baseline characteristics were similar with regards to gender, whether the call was made in or out of hours (in hours defined as 08:00 to 18:00, Monday to Friday), and the urban/rural geography from which the call was made. There were small differences in some, but not all, of the reasons for making a call, some of the deprivation subgroups (using Index of Multiple Deprivation (IMD) quintiles) and some of the age groups.
Table 1. Characteristics of linked and non-linked calls
The data linkage rate for patients who received advice from a clinician over the telephone was much lower, which was only 24% (2521/10634). There was evidence of bias in this sample as patients with linked data are older than patients with unlinked data, with differences across all age groups. Because of this, event rates for the telephone advice group are reported as a minimum and maximum range based on a sensitivity analysis.
Subsequent Event Rates and Sensitivity Analysis
Subsequent event rates for each type of ambulance service decision are shown in . All results show re-contacts within 3 days of the original ambulance contact. Subsequent event rates for the discharge at scene group were as follows: re-contacts with the ambulance service, 9.0%; ED attendance rate, 12.6%; hospital admission rate 6.8%; and mortality rate 0.30%. A large proportion of patients who subsequently died within 3 days of the original call were aged 81–90 years old (42% (54/129)) or over 90 (12% (16/129)). Sensitivity analysis () shows that when accounting for age (>90), frequent callers and non-linked calls, there was little variation in results for discharged at scene patients. Subsequent event rates rose by approximately 3% (or 0.24% for deaths) when the event window was increased to 7 days (re-contacts with the ambulance service, 12.0% (5151/42796); ED attendance rate, 16.1% (6876/42796); hospital admission rate 9.3% (3968/42796); and mortality rate 0.54% (229/42796).
Table 2. Subsequent event rates within 3 days by patient and call characteristics
Table 3. Sensitivity analysis
Due to the low data linkage rate for the telephone advice only group, the results from the sensitivity analysis are reported in . The minimum re-contact rate with the ambulance service was 7.6%; the minimum ED attendance rate was 6.2%; the minimum hospital admission rate was 2.6%; and the minimum mortality rate was 0.06% (6/10 627). Results were less stable for the telephone advice group when we conducted the sensitivity analysis. For example, ambulance re-contacts decreased from 32.4% to 19% when we removed frequent callers and there was a large effect on all health event rates when we included non-linked calls within the denominator. This was due to the low linkage rate for this group. Events within 7 days were approximately 5% higher than those which occurred within 3 days, except for deaths, which were 0.16% higher at 7 days
Patient and Call Characteristics
reports rates of subsequent contacts by patient and call characteristics. Most of the deaths in the discharge at scene group occurred in older age groups, with no deaths occurring for patients under age 20. Hospital admissions and ambulance service re-contact rates were also higher for older age groups. ED attendance was highest for the 0–2 year’s age group and this was also true for the telephone advice only patients. There was little difference in rates of subsequent re-contacts by gender, urban or rural call location, deprivation subgroup and time of call. The reason for call that resulted in the highest rate of ED attendance was “seizure” (for example, epileptic seizure), for both discharge at scene and telephone advice.
Timing of Re-contacts with the Ambulance Service
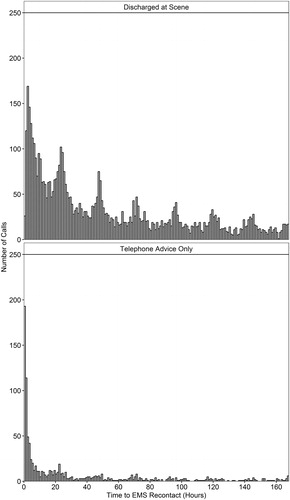
It was possible to calculate the exact timing of subsequent calls to the ambulance service (re-contacts) by plotting time by hour after the original call (see ). For calls where the patient was discharged at scene, re-contacts were usually made within 4 hours of the original call. Where calls ended in telephone advice, re-contacts were usually made within 2 hours of the original call.
Figure 2. Time to ambulance recontact.
Event Pathway
Some patients had multiple types of subsequent health event (see and ). For example, 192 people who received telephone advice, subsequently re-contacted the ambulance service, attended an ED and were admitted to hospital, all within a 3-day period. For discharged at scene patients, 1,508 (3%) patients re-contacted the ambulance service, attended an ED and were admitted to hospital within 3 days and a further 1,142 (2.2%) attended ED and were admitted to hospital within 3 days. The majority of discharged at scene patients had no subsequent health contacts within 3 days (35,706/50,894 (70.1%).
Table 4. Telephone advice: Pathway analysis (recontacts on day 0–3)
Table 5. Discharged at scene - Pathway Analysis (recontacts on day 0–3)
Discussion
Main Findings
The majority of patients who were not transported did not have a subsequent event within 3 days or 7 days, although the event rate was higher within 7 days. However, a small proportion of patients had contacts with multiple emergency and urgent care health services within 3 days of the non-transport decision. Further qualitative research and analysis required to identify and evaluate the factors involved in non-transport decision making for these cases and to assess the safety and appropriateness of these decisions.
Events may have been related to appropriateness of decision making, changing circumstances or patient preference for transport. Work by O’Hara and colleagues identified that non-transport decisions are complex decisions based on multiple factors (Citation14). For example, long standing conditions, preferences of families or the patient, availability of other referral options and risks associated with hospital admissions are all taken into consideration during decision making.
Direct comparison of the findings from this study with those reported by other studies is not straight forward. Researchers take different approaches to data collection, focus on specific types of paramedics or patients, or use varying time periods for studying subsequent events. A scoping review of outcomes reported following non-transport identified that similar outcomes are often reported in different ways, making comparison challenging (Citation15). Despite differences in condition, study type and time intervals used for reporting data, subsequent event rates reported by other studies for patients discharged at scene are comparable to the findings reported here. Death rates reported by other studies were comparably low (Citation13, Citation16–19) and ranged from 0% to 2.3%. The lower event rate of 0 was measured at 1 day (Citation20), whereas the upper event rate of 2.3% was measured at 2 weeks (Citation18). ED and hospital admission rates were comparably higher for patients discharged at scene (Citation15, Citation18, Citation19, Citation21, Citation22): the lowest ED attendances rate being 12.3% and measured at 72 hours (Citation18) and the upper ED event rate being 24% and measured at 2 weeks, whilst the lowest hospital admission event rate was 6.3% and measured at 2 weeks and the upper event rate was 10% and reported at 72 hours. However, these studies had much smaller sample sizes than the study reported here (<1000) patients, with the exception of the study by Tohira et al. (Citation16), which had a sample size of approximately 10,000 patients. Other studies have focused on specific populations, with a study by Haines and colleagues (Citation23) reporting outcomes for pediatric patients (<22) who were not -transported. They found that 2.4% of non-transported patients were admitted to hospital following a non-transport decision. Our findings show that less than 1% of pediatric patients were not transported and subsequently admitted to hospital, and this may be reflective of national policy guidance around non-transportation of pediatric patients.
A study by Tohira et al. (Citation24) assessed whether it is appropriate for paramedics to discharge patients at scene and compared patients who were discharged at scene to those who were transported to hospital. Patients who were discharged at scene had more subsequent events than those who were transported and older age patients and those with abnormal signs were predictors for subsequent events. They concluded that further consideration is needed to identify those patients who will most benefit from a non-transport decision.
Strengths and Limitations
This is the first large scale assessment of outcomes following non-transport decisions using routine linked patient level data in England. There were 5 limitations for this analysis. The first limitation is generalizability because the analysis is based on one ambulance service for 6 months of 2013. During this time period, this ambulance service had average discharge at scene and telephone advice rates when compared with the other 9 large English ambulance service. Internationally, some countries have different policies around non-transport, for example that only patients can decide not to be transported to hospital. The findings from this study will only be transferable to countries with policies facilitating non-transport decisions by ambulance crews and clinicians (nurses and paramedics). Second, while strength of this research is that the data covers a broad population to assess whole population use and outcomes, the drawback is that the data included different types of non-transport such as those who have refused transport as well a range of reasons for calling for an ambulance. Third, there was a high linkage rate (84%) for patients who were discharged at scene, but a much lower linkage rate (24%) for patients who received telephone advice only. Because of the low linkage rate for the telephone advice group, the results are less likely to be useful. The low linkage rate was due to information about patient’s date of birth not being routinely recorded by that ambulance service at the time of the telephone call and this information was required for the data linking methodology used by NHS Digital. In addition, telephone advice patients with linked data were more likely to be frequent callers or sicker than those with non-linked data, due to the way date of birth data was identified and used for a second linkage attempt. It is likely that these patients were sicker than patients who had no other contacts with the ambulance service and that they would have a higher likelihood of subsequent health events. Due to this we undertook a sensitivity analysis, using the total number of calls and the total number of linked calls to calculate a minimum and maximum subsequent event rate for the different types of events. The true value is likely to lie somewhere between these values. Four, people in end of life care pathways may have formal agreement with care providers that they want to die at home so these deaths were removed so that only unexpected deaths were included in the analysis. It is possible that this approach did not detect all those in end-of-life care. Fifth, subsequent events were calculated using days rather than hours. This was because the hospital admission data-set did not include time of admission. To ensure consistency in reporting days rather than exact times or hours were used in the analysis, despite having this more detailed time information for ED, ambulance and mortality data. While this ensures consistency in the reporting of the results, it introduces some limitations to the analysis as subsequent event rates are calculated in 24 hour periods rather than hours.
Several of the challenges that we encountered in our research were also identified in a recent paper by Newguard et al. (Citation25) who identified key aspects of designing and implementing out-of-hospital electronic health record research and reported lessons learned; for example, missing data, electronic data processing, tracking clinical outcomes across different service providers and phases of care, and the use of data linkage. As identified by Newguard and colleagues, studies using out-of-hospital electronic health records that track clinical outcomes across multiple service interfaces is highly complex and requires thorough planning and feasibility assessment to ensure the success of this type of research. Continued development of data linkage methods to link out-of-hospital care records to ED and hospital records is important and has been described as “a crucial first step to quality improvement” (Citation26).
Implications
A non-transport decision that underestimates the urgency or the severity of the patient’s condition could jeopardize patient safety through delays in treatment, whereas overestimating the urgency of a patient’s condition could lead to inappropriate service use, resulting in overburdening of busy health services or unnecessary attendance at a health service for patients. Whether patients required hospital admission or treatment or died within a short time of the original ambulance contact can be used as an indicator of the safety of non-transport decisions (Citation12). High rates of contacts with other services or deaths may be indicative of low levels of patient safety; whereas, people who died or are admitted to hospital following a non-transport decision could be an indicator of safety failure.
Funding of care has implications for non-transport decisions, as in the United States, many emergency medicine services are not reimbursed if a patient is not transported to an ED. However, new schemes, such as “mobile health care providers” could help to reduce unnecessary transports through a combination of additional training and changes in health insurance policy (Citation27).
This study found that a minority of patients who were discharged at scene in one ambulance service in England in 2013 made re-contact with another service or died within 3 or 7 days. The acceptability of the rates reported here requires subjective assessment. It is important to look at ways of measuring these event rates routinely so that different ambulance services can compare rates between services and within services over time. Audits can also be undertaken to identify reasons for these events. Deaths are a particularly worrying event and a detailed individual case review of significant events such as death or hospital admission could be undertaken and this information fed back to staff to facilitate learning and improvement. Improved data quality and data-linkage methods are recommended to facilitate routine assessment of event rates.
Related Research Data
References
- Ebben R, Vloet L, Speijers R, Tönjes N, Loef J, Pelgrim T, Hoogeveen M, Berben S. A patient-safety and professional perspective on non-conveyance in ambulance care: a systematic review. Scand J Trauma Resusc Emerg Med. 2017;25:71.
- NHS England. Ambulance Quality Indicators https://www.england.nhs.uk/statistics/statistical-work-areas/ambulance-quality-indicators/; https://www.england.nhs.uk/statistics/wp-content/uploads/sites/2/2018/01/AmbSYS-TimeSeries-Interactive-File-December-2017.xlsx Accessed 7th February 2018.NHS England
- Gratton MC, Ellison SR, Hunt J, Ma OJ. Prospective determination of medical necessity for ambulance transport by paramedics. Prehosp Emerg Care. 2003;7:466–9. doi: 10.1080/31270300220X.
- Fisher JD, Freeman K, Clarke A, Spurgeon P, Smyth M, Perkins GD, Sujan MA, Cooke MW. Patient safety in ambulance services: a scoping review. 2015. doi: 10.3310/hsdr03210.
- Eastwood K, Morgans A, Smith K, Stoelwinder J. Secondary triage in prehospital emergency ambulance services: a systematic review. Emerg Med J. 2015;32(6):486–92. doi: 10.1136/emermed-2013-203120.
- Smith WR, Culley L, Plorde M, Murray JA, Hearne T, Goldberg P, Eisenberg M. Emergency medical services telephone referral program: an alternative approach to nonurgent 911 calls. Prehosp Emerg Care. 2001;5(2):174–80. doi: 10.1080/10903120190940092.
- Dale J, Williams S, Foster T, Higgins J, Snooks H, Crouch R, Hartley-Sharpe C, Glucksman E, George S. Safety of telephone consultation for “non-serious” emergency ambulance service patients. Quality Safety Health Care. 2004;13(5):363–73. doi: 10.1136/qshc.2003.008003.
- Giesen P, Smits M, Huibers L, Grol R, Wensing M. Quality of after-hours primary care in the Netherlands: a narrative review.Ann Intern Med. 2011;155(2):108–13. doi: 10.7326/0003-4819-155-2-201107190-00006.
- Coster, J.E, Irving, A.D., Turner, J.K., Phung VH, Siriwardena AN. Prioritising novel and existing ambulance performance measures through expert and lay consensus: A three- stage multimethod consensus study. Health Expect. 2018;21:249–60.
- Gray J. External Tracking and Status for External Users. Leeds, UK: Health and Social Care Information Centre, 2015.
- Turner J, Siriwardena N, Coster J, Crum, A, Jacques R, Irving A, Bell-Gorrod H, Booth A, Nicholl J, Phung V-H, Togher F, Wilson R, O’Cathain A, Booth A, Bradbury D, Goodacre S, Spaight A, Shewan J, Pilberry R, Fall D, Marsh M, Broadway-Parksinson A, Lyons R, Snooks H, Campbell M. Developing new ways of measuring the impact of ambulance service care. Final report to NIHR, 2017. PhOEBE report
- Cain E, Ackroyd-Stolarz S, Alexiadis P, Murray D. Prehospital hypoglycemia: the safety of not transporting treated patients. Prehosp Emerg Care. 2003;7:458–65. doi: 10.1080/312703002193.
- Anderson S, Hogskilde PD, Wetterslev J, Bredgaard M, Møller JT, Dahl JB. Appropriateness of leaving emergency medical service treated hypoglycemic patients at home: a retrospective study. Acta Anaesthesiol Scand. 2002;46:464–8. http://dx.doi.org/10.1034/j.1399-6576.2002.460424.x.
- O’Hara R, Johnson M, Hirst E, Weyman A, Shaw D, Mortimer P, Newman C, Storey M, Turner J, Mason S, Quinn T, Shewan J, Siriwardena AN. A qualitative study of decision-making and safety in ambulance service transitions. Health Services and Delivery Research. 2014;2(56):2014.
- Jensen J.L, Carter J.E., Rose J, Visintini S, Bourdon E, Brown R, McVey J, Travers A.H. Alternatives to traditional EMS dispatch and transport: a scoping review of reported outcomes. CJEM. 2015;17(5):532–550 DOI 10.1017/cem.2014.59.
- Tohira H, Fatovich D, Williams TA, Bremner A, Arendts G, Rogers IR, Celenza A, Mountain D, Cameron P, Sprivulis P, Ahern T, Finn J. Which patients should be transported to the ED? A perpetual prehospital dilemma. Emerg Med Australas. 2016;28(6):647–53. doi: 10.1111/1742-6723.12662.
- Al-Sulaiti M, Snooks H, Porter A. Non-conveyance of 999 callers: early findings related subsequent health services callers. Emerg Med J. 2009;26:8. http://dx.doi.org/10.1136/emj.2009.075416h.
- Kahalé J, Osmond MH, Nesbitt L, Stiell IG. What are the characteristics andoutcomes of nontransported pediatric patients? Prehosp Emerg Care. 2006;10(1):28–34. doi: 10.1080/10903120500373322.
- Snooks HA, Halter M, T Close JC, Cheung WY, Moore F, Roberts SE. Emergency care of older people who fall: a missed opportunity. Qual Saf Health Car. 2006;15:390–2. http://dx.doi.org/10.1136/qshc.2006.018697.
- R Core Team (2017). R: A language and environment for statistical computing. Vienna, Austria: R Foundation for Statistical Computing. https://www.R-project.org/
- Magnussen J, Vrangbaek K, Saltman RB. Nordic health care systems. Recent reforms and current policy challenges. WHO Regional Office for Europe. Copenhagen: WHO; 2010
- Gray JT, Walker A. Avoiding admissions from the ambulance service: a review of elderly patients with falls and patients with breathing difficulties seen by emergency care practitioners in South Yorkshire. Emerg Med J. 2008;25:168–71. http://dx.doi.org/10.1136/emj.2007.050732.
- Haines CJ, Lutes E, Blaser M, Christopher NC. Paramedic initiated non-transport of pediatric patients. Prehospital Emergency Care. 2006:10(2);213–219 doi: 10.1080/10903120500541308.
- Tohira H, Fatovich D, Williams TA, Bremner A.P. Arendts G, Rogers I.R. Celenxa A, Mountain D, Cameron P, Sprivulis P, Ahern T, Finn J. Is it appropriate for patients to be discharged at the scene by paramedics? Prehospital Emergency Care. 2016;20(4):539–549. doi: 10.3109/10903127.2015.1128028.
- Newguard CD, Fu R, Malveau S, Rea T, Griffiths DE, Bulger E, Klotz P, Tirrell A, Zive D. Out-of-hospital research in the era of electronic health records, Prehospital Emergency Care. 2018;22(5):539–550. doi: 10.1080/10903127.2018.1430875.
- Swor R, Qu L, Putman K, Sawyer KN, Domeier R, Fowler J, Fales W. Challenges of using probabilistic linkage methodology to characterize post-cardiac arrest Care in Michigan, Prehospital Emergency Care. 2018;22(2):208–213. doi: 10.1080/10903127.2017.1362086.
- Span P. Going to the Emergency Room Without Leaving the Living Room. [Accessed Nov 07 2018];New York Times. 2016 http://www.nytimes.com/2016/11/08/health/older-patients-community-paramedics.html.