
 ?Mathematical formulae have been encoded as MathML and are displayed in this HTML version using MathJax in order to improve their display. Uncheck the box to turn MathJax off. This feature requires Javascript. Click on a formula to zoom.
ABSTRACT
The spread of the COVID-19 virus has brought forward a global pandemic that has halted many businesses and placed restrictions on daily activities. Vaccination of residents is crucial for a small country like Qatar to contain the spread of the virus. This study will aim to investigate and report the general outlook of Qatari residents toward the vaccine, the points of hesitancies, and how the contact tracing application (Ehteraz) can play a role in promoting vaccination. A questionnaire survey was given, and respondents answered a series of background questions and questions related to vaccine hesitancy and the effectiveness of the Ehteraz application. A broad search strategy was used to identify the main contributors to willingness and hesitancy with the COVID-19 vaccination. Regression models and test-train machine learning techniques were used for analysis. The results showed that dominance analysis was effective in highlighting the main barriers and promoters in taking the vaccine and that respondent’s characteristics can be used to predict vaccination attitude.
Introduction
The SARS-CoV-2, or coronavirus (COVID-19) pandemic has aggressively spread around the world, leading to one of the most serious human pandemic cases in decades. To combat this infectious disease, governments around the world have shut down businesses, quarantine residents, and adopt a ‘work-from-home' approach (Anderson et al., Citation2020; Brooks et al., Citation2020; Sohrabi et al., Citation2020). To overcome super-spreading and spread in urban social areas, the use of contact tracing applications was implemented by some countries to prevent further transmission of the disease. The adoption of contact tracing applications has had much debate surrounding privacy and its effectiveness (Ahmed et al., Citation2020; Jacob & Lawarée, Citation2020; Spears & Padyab, Citation2021; Zhang et al., Citation2020). South Korea adopted rigorous contact tracing and saw significant benefits in minimizing coronavirus waves (Y. Park et al., Citation2020; O. Park et al., Citation2020). Also, Qatar has exercised a mandatory contact tracing application called Ehteraz, which has benefitted in minimizing the spread of the virus in public spaces (EHTERAZ—ACTA, Citationn.d.; Qatar makes COVID-19 app mandatory, experts question efficiency | Coronavirus pandemic News | Al Jazeera, Citationn.d.). By introducing Ehteraz, residents have access to their health status and information posted by the Ministry of Public Health. A green health status (showing no current positive result or recent exposure) is required to be shown upon entering public areas. Recently, a section for the user’s vaccine history has been added, and those that have had received the vaccine do not have to quarantine upon entering the country (Ministry of Public Health, S. of Q, Citationn.d.).
Countries have been rushing to develop and receive governmental approval for the distribution and vaccination of their residents, as it has been shown to limit infections during a pandemic (Germann et al., Citation2006). Qatar has approved the use of three separate vaccines; Pfizer, BioNTech, and Moderna, to further control the spread and reduce the possibility of upcoming waves (Qatar approves emergency use of Moderna’s COVID-19 vaccine, Citationn.d.). The vaccines administered in Qatar have a relatively high efficacy rate of vaccination across different sociodemographic backgrounds (Oliver et al., Citation2020). To date (April 2021) more than 200,000 have been tested positive (Ministry of Public Health, S. of Q, Citation2021; World Health Organization, Citationn.d.). Despite this, there are still some that are hesitant about taking the vaccine (Pullan & Dey, Citation2021). Vaccine hesitancy is a prevalent issue in recent studies in Arab countries, including issues with side effects and safety (Alsuwaidi et al., Citation2020; Sallam et al., Citation2021). Much of the literature identifies psychological, contextual, and sociodemographic influences as the major factors that contribute to hesitancy (Larson et al., Citation2014; Marti et al., Citation2017; Schmid et al., Citation2017). However, equating COVID-19 vaccination attitude to childhood vaccination attitude may present differences in variables. This also explains why the response toward vaccine willingness—whether passive or active—would be different (Lazarus et al., Citation2021). Concerns around contact tracing privacy applications in vaccine attitudes are not yet fully understood (Chan & Saqib, Citation2021). Delay or resistance to vaccination undermines public safety efforts and puts an additional strain on hospitals, businesses, and industries if the spread of symptoms from the disease is not contained.
Identifying, describing, and understanding the major contributors to an individual’s hesitancy or willingness can provide useful information in vaccine distribution. Also, since data in the region are limited, similarities in literature across underlying factors in Europe, the USA, and the UK might not translate identically. Therefore, variables contributing to willingness and hesitancy (W&H) in Qatar must be investigated, which can then be extended to the Middle East. To do this, we have implemented two study objectives.
First, we investigated what proportions of the general adult population in Qatar were willing, hesitant, or feeling a mix of both toward being administered the COVID-19 vaccine.
Second, we sought to classify and profile the responders based on the questionnaire into identifiable categories based on their sociodemographic, political, and social influence. Machine learning is also used to identify the important “dominant” variables that contribute to willingness and hesitancy and can predict future responses. This classification is important for public health officials in determining awareness campaigns and adequately allocating resources for distributing the vaccine.
Methodology
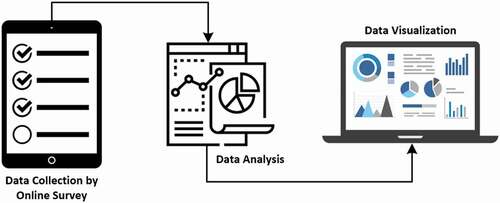
The project tasks can be divided into three major sections viz. local data collection by conducting an online survey, detailed statistical analysis on the collected data, and visualization of the evaluation and the results. The overall process can be visualized in .
Figure 1. Flowchart explaining the complete methodology of the project.
Data collection
Pilot survey
After highlighting the main promoters and barriers to vaccine hesitancy, a small pilot survey was conducted with open-ended questions. Three male participants were asked about their willingness to taking the COVID-19 vaccine with their reasoning explained through open-ended questions. The main findings of the study can be highlighted in below:
Table 1. Pilot survey results on vaccine attitude.
Based on , contextual and individual influences play a big role in vaccine hesitancy. Participant A showed that the rollout of vaccines is important in transitioning from online teaching, which lacks class engagement (Oyedotun, Citation2020). The high-risk health factor played a big role in boosting vaccine willingness. The point of Ehteraz’s privacy and power issues was brought up as an additional point toward willingness. Conversely, Participant B was not willing to take the vaccine because points like side effects were not known, which is a barrier in vaccine willingness in the past. The similarity in working conditions after lockdown means that the engineer is free to work and study from the comfort of their own home. Participant C showed vaccine-willing but hesitant behavior because access and interpretation of the medical information were not readily accessible by the public. Also, seeing leaders take the vaccine aids in willingness as it eases the fear factor when public figures are leading by example.
Survey formation, questionnaire distribution, and data description
An online questionnaire was developed by the authors in Qatar University to collect data from the local population regarding their personal information, experiences about taking a flu vaccine, their usage pattern of using Ehteraz, and their willingness and hesitancy about taking the COVID-19 vaccine judged from various perspectives. The online questionnaire developed using Google Forms was structured carefully so that the authors can receive dependable responses to be used in statistical analysis and provide a reasonable outcome while maintaining the simplicity and shortness to allow users to swiftly finish the survey with ease and without randomly ticking points.
Considering the demand and taste of the local population, the survey was distributed in both English and Arabic versions which boosted the sample size. The questionnaire was mainly divided into three sections. The first section of the survey collected the responder’s information, including their age, biological sex, race, the highest level of education, and whether the responder has been administered the COVID-19 vaccine. The following section of the survey measured the responder’s willingness and hesitancy in taking the vaccine. The last section enquired about the responder’s beliefs and attitudes toward the COVID-19 vaccine based on their previous history with vaccines, religious and social influences, and the usage pattern of Ehteraz through a seven-point Likert scale (Norman, Citation2010).
Surveys were then distributed by a Google Forms link for each language. The method of the online survey was selected for convenience, as social distancing restrictions were in effect and allowed the responders to answer at a convenient time. Informed consent was presented before accessing the survey and answering took approximately 5–10 minutes to complete. The participants that responded acknowledged that they did not previously contract the COVID-19 virus before taking the survey. No identifiable information was collected, and the responder was free to withdraw from participation at any point in the survey. After around 200 samples were collected, data was exported as a Comma-Separated Values (CSV) Text file from Google Forms to be collected and locally stored by the authors and moved into the analysis phase.
One hundred and seventy-five people responded to the survey, and 33.71% (n = 59) of these responders had already taken the COVID-19 Vaccination. illustrates the median response on the Likert scale for each of the questions asked categorized by whether they have been administered the COVID-19 Vaccination. Categorical variables were classified into four separate classes based on their Willingness and Hesitancy (W&H): (0) willing and not hesitant; (1) willing but hesitant; (2) not willing and hesitant; (3) not willing, but not hesitant. and present the sociodemographic data of responders based on a 7-point Likert scale and their W&H classification, respectively. The categorical variables of willingness and hesitancy are shown in Footnote.
Table 2. Survey responses for the vaccinated and non-vaccinated group.
Table 3. Attitudes toward COVID-19 vaccines of survey participants by characteristics.
Data analysis
The Data Analysis section has three sub-sections as depicted in viz. Descriptive Analysis and Statistical Inferences, Classification using Statistical Regression and Machine Learning (ML), and Dominance Analysis.
Figure 2. Flowchart breaking down the data analysis process.
Descriptive analysis and statistical inferences from ANOVA
To perform some high-level, descriptive analysis on the collected dataset, various graphs were plotted using Pivot Charts to visualize (inter and intra) relationships and trends among various combinations of independent and dependent variables. For example, the Gender vs. Willingness and Hesitancy level was plotted in the results section (). These plots can be used for qualitative or descriptive analysis on the dataset to understand some basic patterns in the data. Analysis of variance (ANOVA) was implemented with independent and dependent variables to quantify the descriptive analysis and validate the descriptions through statistical inferences. Two-way ANOVA with replications was used in this study since there were several data points for each combination of factors A (parameters) and B (willingness/hesitancy) with their interactions, as shown in .
Table 4. Two-way ANOVA with replications data array.
There are various types of parameters in factor A, such as gender, age, and history with flu vaccines. For each case, the interaction factor between A and B variables was determined using the sum of squares. The sum of the squares for individual factors and their interaction are to be multiplied by their dimensions to account for all classes. The two-way-with-replication problem presented three hypotheses which can be outlined by:
Table
As shown in . The ANOVA table includes parameters such as Sum of Squares (SS) and Mean of Sum of Squares (MS) for various parameters, F-statistic, and the corresponding Critical F-value from the table of critical values for the two-way ANOVA for comparison and p-value from the p-value table.
Table 5. Sample ANOVA table for a two-way ANOVA with replications.
If the calculated F-statistic value is more than the corresponding F-Critical value, the Null Hypothesis must be rejected for the alternative, otherwise, it is to be concluded that there is no evidence for rejection. Similar conclusions can be reached from the p-values as well. ANOVA has been performed for few cases, such as Gender vs. W&H, Age vs. W&H, or Past Vaccine History vs. W&H.
Classification using statistical regression and machine learning (ML)
In the second part of data analysis, various statistical regression techniques were used to classify their willingness to take the vaccine based on their responses. Out of the 21 questions in the survey, 19 independent variables were used to determine the willingness and hesitancy level. A Data pre-processing and ML pipeline was developed using Python Jupyter Notebooks in the Google COLAB platform. The overall structure of the pipeline is shown in . The CSV file containing the dataset was uploaded into Google Drive which is connected to COLAB. Using Python’s PANDAS Library, a DataFrame was created from the CSV dataset and used for further analysis. NULL values were filled up (not dropped) by “N/A” or Not Answered. For descriptive analysis, categorical data could directly be implemented using PANDAS DataFrame while regression techniques can only work on numerical data. So, dummy variables were created from categorical data for regression analysis. All versions of the processed datasets were saved in Google Drive.
Figure 3. Data pre-processing and machine learning (ML) Pipeline (in Python).
Sixty-eight dummy variables were created from 19 raw categorical (independent) variables. The new DataFrame was converted into a NumPy array (which can only take numerical values) to allow machine learning classification done to it. The dataset of 175 subjects was split into train and test set following a ratio of 80:20 using Python’s Scikit-learn library. The library randomly splits the train-test data and can influence the performance and can introduce bias. To get rid of this bias, 5-Fold Cross-Validation (CV) was performed while training and testing the data where the entire process of splitting dataset and performing ML was run 5 times and the result is the average of the results from these five runs. Twelve regression techniques with supervised machine learning were used in classification. Among the classification techniques used, multiple linear regression is a widely used model to find a relation between the predictors and a target variable, logistic regression uses categorical data from the survey, KNN classifies new data points based on the classes of its nearest neighbor. Other classification techniques were also used to compare its performance including support vector machines (SVM), stochastic gradient descent (SGD), decision trees, ensemble techniques, and multi-layer perceptron (Kotsiantis, Citation2007; Sharpe et al., Citation2019; Veena et al., Citation2018).
Machine Learning can mainly be used for two types for inferential analysis viz. Classification and Regression. Regression is mainly used for predicting and evaluating a continuous signal or data (dependent variable) while classification is used for discrete data like in this case. The classification task for this experiment has been divided into two stages viz.
Severity Classification of Willingness and Hesitancy
Classification of Subjects based on a Combined W&H Categorical Class
First, during the survey, the “Willingness” and “Hesitancy” levels were divided into seven incrementing discrete severity classes using a Likert Scale, from 1 to 7. Machine learning techniques were used to create a model based on the training dataset which can use the independent variables to predict the severity of Willingness and Hesitancy (dependent variables) among people. In the next step, the two variable problems in the previous step were transformed into a one-variable problem by following the process shown in . The condition is that if the Willingness (or Hesitancy) level is less than or equal to 3, the person is unwilling and if it is more than 3, he/she is willing. Four combinations can be formed based on this condition, as shown in .
Table 6. The 4-class classification problem from the W&H categorical class.
Figure 4. Data pre-processing and machine learning (ML) Pipeline (in Python).
Dominance analysis
Dominance analysis meets three important criteria for measuring relative importance; the technique should be robust; it facilitates a direct comparison of parameters contributing to the model’s performance; and the technique should be able to measure the attributes’ direct effect (self-contribution), total effect (influence when considered with other attributes), and partial effect (influence when considered with various combinations of other predictors) (Azen & Budescu, Citation2003). Based on these points, the Dominance Statistics can be divided into four different types of measures, which include:
Individual Dominance: Individual dominance is the R2 of the model between a certain predictor (or independent variable) and the dependent variable. So, the individual dominance, which can be formulated as
for a predictor X1, represents the quantum of impact by the predictor in absence of others.
Average Partial Dominance: The average partial dominance measures the average impact of a predictor when it is tested against all possible combinations formed by other predictors except when all other predictors are available. Statistically speaking, this is just the average of average incremental R2 contribution of the target-independent variable to all subset models except the final model and bi-variate.
Interactional Dominance: Interactional dominance can be expressed as the impact or variability described by a predictor in presence of all other predictors. In other words, the interactional dominance of a certain independent X1ʹ will be the difference between the R2 of the overall model and the R2 of the model with all other predictors except ‘X1ʹ. For example, if X1, X2, X3, and X4 are four independent variables, the interactional dominance can be expressed as,
Total Dominance: It is the average of conditional values from all types of dominance factors for a certain predictor, thus summarizing the contributions of each predictor to all subset models.
In the case of Dominance Analysis, if there are “p” predictors, there will be models, i.e., all possible subset models, and the incremental contribution of each predictor is evaluated with respect to the model(s) created by the combinations of all other predictors. So, if there are four independent variables, there will
= 4 models with only 1 predictor,
= 6 models with two predictors,
= 4 models with three predictors and
= 1 model with all predictors, i.e., total
= 15 models. So, the complexity of the procedure increases geometrically as the number of predictors increase. Since we have 19 independent variables, we will have
subset models to evaluate. The GitHub Library for implementing Dominance Analysis in Python has been used for implementation where the number of top predictors to be accounted for dominance analysis can be varied (the default 15 was used for this experiment).
Data visualization
After the analysis was done and all the outcomes were compiled, various figures were plotted using software like MS Excel and Matplotlib in Python. In MS Excel, Pivot Charts from Pivot Tables were used to aid descriptive analysis of the dataset and fill up . Matplotlib in Python was used to produce ROC plots and Confusion Matrices. Performance results from the machine learning algorithms for various experiments were transferred to Excel for some basic analysis and interactive plotting.
Results and discussion
Results from the three stages of statistical analysis have been presented in this section along with a further discussion on how they are related to each other and can be used to support, validate, reject, or upgrade each other’s outcomes. This section will also show how advanced regression techniques when used through the Machine Learning approach, can perform advanced analysis on the whole dataset and display results containing the magnitudes and ranks of interactions among many predictors and the target variable(s), a task which descriptive analysis or ANOVA cannot robustly perform.
Quantification and validation of the descriptive statistical analysis by inferences from ANOVA
Using Excel’s PivotTable and Pivot Charts features, bar charts were plotted from combinations of various independent variables with “Willingness” and “Hesitancy” target variables, such as Gender, Age, Past Experiences with flu vaccines, Religious Affiliations, etc. Along with the descriptive analysis from the plots, inferences from ANOVA were used to quantify and validate/reject the descriptions based on a 95% Confidence Interval (CI).
From the bar charts in , overall willingness to get the vaccine among both genders was high while hesitancy was low, because of many factors including fatality rates of the pandemic COVID-19, pressure from relatives or peers, laws from the local government. Elaboration of which is out of this study. Performing ANOVA using Excel’s Statistical Analysis Toolbox on the subset of the total dataset containing Gender classes vs. the two dependent variables, the ANOVA table in was generated. It was seen that for Hypothesis 1 and 3, Null Hypothesis () could not be rejected (based on the current dataset) meaning that there is no significant relationship between gender classes and there is no significant interaction between gender classes (factor A) and dependent variables (factor B).
was rejected for Hypothesis 2 meaning that there is a significant relationship among the columns i.e., the willingness and hesitancy parameters in factor B. Its F-value is significantly higher than the critical value, signifying the magnitude of the relation.
Table 7. ANOVA table for gender classes (Factor A) vs. W&H (Factor B).
Figure 5. (a) Willingness and (b) Hesitancy levels between gender classes.
From the descriptive analysis for the Age Classes shown in , no relation could be derived except that young people were most willing to take the vaccine and least hesitant. But from ANOVA, it was found that except for hypothesis 1, both hypotheses 2 and 3 were rejected.
Figure 6. (a) Willingness and (b) Hesitancy levels between age classes.
F-value for the columns crossed the F-Critical value by a significant amount while F-value for the interaction basely crossed the limit highlighted in . Once again, it signifies that there is a significant relation between Willingness and Hesitancy while there could be some interactions between the age groups and the dependent variables.
Table 8. ANOVA table for age classes (Factor A) vs. W&H (Factor B).
To further explore the effect of comorbidities present among elderly people on their willingness and hesitancy in taking COVID-19 vaccine, we divided the entire age range into 2 classes viz. (18–44) years old people as “Young and Middle-Aged” and 45+ years old people in the “Old and Elderly” group and performed t-test (alpha = 0.05). From the one-tail and two-tail P-values, as shown in , willingness to take the vaccine varies significantly between the two classes. But no significant relation could be seen in terms of hesitancy.
Table 9. T-test tables showing the effect on willingness and hesitancy based on two age classes.
Additionally, it was shown that there is no significant interaction between experience with flu vaccines and taking COVID-19 vaccines due to the factors discussed previously, as shown in . So, the Null hypothesis for hypothesis 3 could not be rejected.
Figure 7. (a) Willingness and (b) Hesitancy levels based on past experience.
In this case, the Null Hypothesis for hypotheses 1 and 3 could not be rejected while hypothesis 2 was rejected proving again the relation between willingness and hesitancy. The results for the ANOVA test are shown in .
Table 10. ANOVA table for past experiences with flu vaccines (Factor A) vs. W&H (Factor B).
This study also tried to discover whether there is any relation between religious affiliations and hesitancy levels among people for taking the vaccine as discussed worldwide (Larson et al., Citation2014). The answer was found to be negative among Qatari nationals and residents, as shown in .
Figure 8. Hesitancy levels based on religious affiliations.
The shortcoming of this analysis is its failure to test the contributions of the independent variables in predicting the dependent variables and rank them. Even though the relationship might not seem significant through ANOVA with 95% CI, there can be a stratification of significance even in that insignificant level, which has been analyzed in the Machine Learning and Dominance Analysis sections.
Evaluation of the machine learning (ML) techniques
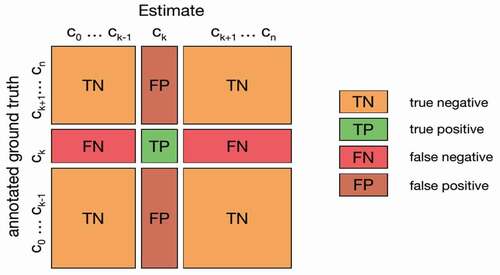
The evaluation of the ML models was performed by measuring the errors, creating the Confusion Matrix, and extracting other parameters, such as Accuracy, Precision, Recall (or Sensitivity), and f1-Score from the Confusion Matrix. Their formulae are shown in Equations 1 to 4. Here, TP = True Positive (equivalent with Hit), TN = True Negative (equivalent with Correct Rejection), FP = False Positive (false alarm, type I error, or underestimation), and FN = False Negative (equivalent with miss, type II error, or overestimation) are the four main parameters of the Confusion Matrix. The confusion matrix for summarizing the performance of the classification algorithm is shown in .
Figure 9. Confusion matrix in general format.
The Receiver Operating Characteristic (ROC) curves were plotted on the same window for all classes of the dependent variable for the 4-Class problem. The ROC curve is created by plotting the True Positive Rate (TPR, also known as Sensitivity or Recall) against the False Positive Rate (FPR, also known as the Probability of False Alarm) at various thresholds settings to discover the optimal model. The formulae for TPR and FPR are shown in Equations 5 and 6, respectively. Area Under the ROC Curve, commonly known as AUC, was calculated for each ROC curve. AUC can be found by integrating the ROC curve over the whole interval. AUC, as a scale-invariant measure, can measure how well the predictions are ranked among classes, regardless of their respective magnitudes. It can also measure the quality of the model’s prediction irrespective of the classification threshold.
There are various types of error calculating metrics such as Root Mean Square Error (RMSE), Mean Absolute Error (MAE), Median Absolute Deviation (MAD), MAE was chosen since it is one of the most common ways errors measurement among the ML researcher community. The formula for MAE is shown in Equation 18 where the predicted values are being compared to the true/actual labels from the test data.
4-Class W&H Classification: If individual regression techniques were judged, K-Nearest Neighbors (KNN) performed well being a comparatively simpler regression technique even though its training model was not robust, i.e., its performance might vary with iterations or change with new data. Ensemble or Boosting methods performed best while maintaining their robustness, tree-based techniques being the second. The (overall) least Mean Absolute Error (MAE) from 5-Fold Cross Validation was found to be 0.2057 from the Random Forest classifier. Comparing the error plot in and Training Score from , the worst training models are producing more errors on the test set with KNN being an exception.
Figure 10. 5-Fold CV result of (a) MAE (lower is better); (b) Score (higher is better, maximum 1) from the training model from various regression techniques for the 4-class classification problem.
To better understand the best-performing regression algorithm and an insight into the dataset, the team calculated the testing accuracy, precision, recall, and f1-score from the ground truths and predictions using Equations 1 to 4, and the plots are shown in . It can be observed that even though the accuracy and precision scores are good for many algorithms (KNN, XgBoost, Random Forest, and Extra Trees being the best(s)), most of the algorithms fall in “Recall” performance, except KNN, MLP and simple algorithms like Linear and Logistic Regression. The f1-score trend is the same as accuracy and precision since it is calculated from them. KNN displayed the best average performance in terms of four evaluation metrics. So, various parameters of KNN, such as the number of neighbors, weight function, solver algorithm, leaf size, etc. were varied to visualize the change in the performance. Among them, the “number of neighbors” parameter (the most significant parameter for KNN, termed as “n” here) displayed the most conspicuous but important trend as shown in . KNN performs best when the number of neighbors, n = 2. The performance decreases as more neighboring data points are taken into consideration, implying that the data points are not forming large clusters inside the dataset.
Figure 11. 5-Fold CV result of testing (a) Accuracy; (b) Precision; (c) Recall; (d) f1-Score.
Figure 12. Performance of KNN for variable number of neighbors (n = 1 to 11).
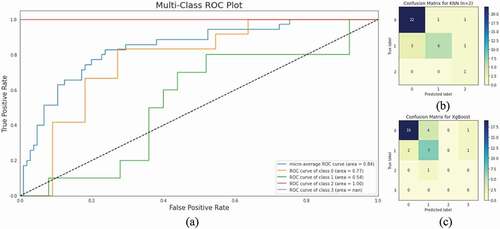
ROC Curves for all four classes (0 to 3) of the dependent variable for KNN have been plotted in . The plot shows the area under the respective ROC curves or AUROC. More area under the curve represents more usefulness of the test (maximum is one). According to the AUROC performance scale, the performance of KNN for predicting class 1 is “Fair,” for class 2, it is “Very Poor” while for class 3, it is “Excellent.” There is no result for the 4th class since in the randomly created test set, there was no ground truth or prediction for the 4th class (Since “Not Willing but Not Hesitant” people are rare). Looking at the Confusion Matrix for KNN and XgBoost in , their difference in performance for the “Recall” parameter can be understood. XgBoost not only predicted four responders belonging to class 2 as class 1, but it also wrongly predicted one class 1 and one class 2 as class 4, which was not done by KNN (that is why the Confusion Matrix for KNN is 3 × 3). This increased the False Negatives (FN) among the predictions, thus decreasing the “Recall” performance.
Figure 13. (a) Multi-Class ROC Plots (Class 0 to 3) for KNN; (b) Confusion Matrix for KNN (n =2); (c) Confusion Matrix for XgBoost (for comparison with the best performing KNN).
7-Class Severity Classification: The independent variables in the training set were trained to build models to predict the severity of the “Willingness” and “Hesitancy” responses and evaluate its prediction performance based on the labeled test data. The goal of this analysis was to compare which parameter was harder to predict from the available independent variables.
As seen in , the answer is “Hesitancy” since the error for hesitancy is more than willingness for all cases. This is also matching with common understanding since hesitancy ( unwillingness) is a more confusing attribute to perceive (and rank) than willingness (which is rather a certain opinion), it is not strongly related to the available independent variables. Best Performance was from the Random Forest Classifier as before (MAE = 0.35 (W), 0.71(H)). The overall performance is worse than the 4-Class problem even with the same independent variables because of this problem having more classes in the dependent variables.
Figure 14. 5-Fold CV result of MAE for the 7-class severity classification problem.
Feature ranking using dominance analysis
As discussed previously, to determine the most dominant independent parameters in predicting the dependent variables, dominance analysis was performed for the two original dependent variables, separately shown in and . It was found that among the top 15 predictors ranked under this process, people’s willingness to take the vaccine was most affected by their chance of avoiding quarantine, lockdown restrictions, special color codes for vaccinated people in Ehteraz, and the feedback from public figures.
Table 11. Top 15 contributing factors behind willingness—Ranked from dominance analysis.
Table 12. Top 15 contributing factors behind hesitancy—ranked from dominance analysis.
On the other hand, peoples’ hesitancy was swayed by examples from public figures, gender type, the matter of asking a direct question about vaccine intake during the survey, and some people’s opinion on the vaccine being a choice, i.e., not to be imposed by the authority. It is to be noted that during ANOVA in the previous section, no significant interaction could be observed between independent variables taken one at a time and the dependent variables. But dominance analysis can rank the strength of the interactions comprehensively, regardless of the true magnitude of that relation. It is intriguing since despite having many predictors in the survey, only a very few of them can significantly influence people’s decision in vaccine willingness and hesitancy.
In both cases, it was seen that the dominance analysis results match our practical experiences. For example, people’s willingness to take the vaccine gets boosted because by doing this they can resume their normal lifestyle by avoiding restrictions or lockdown or can travel abroad by passing the quarantine. On the contrary, watching public figures or someone from the authority take the vaccine willingly and safely, removes the hesitancy and superstitions present among people regarding the vaccine.
Now, taking only the top 10 ranked features from both cases, subsets of the whole dataset was formed and trained with ML (keeping all parameters the same as the previous experiment) to test the difference in error performance (which indirectly relates to other performance matrices). The results are shown in .
Figure 15. Error performance for all vs. top 10 features for (a) Willingness; (b) Hesitancy.
In this case, for both Willingness and Hesitancy, the subset data comprising the top 10 features provides a similar result as the whole dataset. It proves that some of the independent variables were unnecessary for the analysis and can be avoided during similar experiments in the future. There might exist some correlation among some of the low-performing predictors which might lower their performance. Dominance Analysis through its detailed analytical approach could reject these variables.
Conclusion and future work
In conclusion, the inferential analysis using ANOVA proved that there is a significant correlation between peoples’ hesitancy and willingness, thus rejecting the first hypothesis. But no significant similarity was found between the classes of the independent variables or interactions between the dependent and independent variables. It proves that peoples’ hesitancy gets affected by their willingness. Applying Machine Learning with 5-Fold Cross-Validation, K-Nearest Neighbor (KNN) performed best with a testing Accuracy, Precision, and Recall of 83%, 86%, and 84%, respectively. It implies that with the currently available questionnaire, the training model (using KNN, n = 2) can determine the class (out of 4) of a new subject with 83% accuracy. From the Dominance Analysis, it was found that people were most motivated to take the vaccine due to their chance of avoiding quarantine, lockdown restrictions, and special color code for vaccinated people in Ehteraz (i.e., avoiding local restrictions because of lockdown by using the official application as a certificate). Peoples’ hesitancy was affected by the actions and opinions from influential public figures in taking the vaccine and gender type (females were more hesitant as seen from the descriptive analysis). The top-ranked features from the dominance analysis and their high or similar error performance as the whole dataset after trained in ML showed the most important questions to be asked for similar cases which can act as a reference for future surveyors.
Some future works might comprise increasing the number of samples by collecting more data with the questionnaire and expanding the work to neighboring countries. Additionally, more parameters could further be investigated that are unique to the culture of the Middle East. Almost all Machine Learning algorithms in this study were used with default parameters, except for KNN, for which some variability was tested. Various parameters (e.g., Loss Function, Solver, Optimizer, etc.) for other algorithms can be tested for any improvement in the performance. If the dataset gets much larger, the trained model will also be increased in size, and using a large model in a mobile device will challenge because of limited memory. Apart from the results shown in the Dominance Analysis section, various feature reduction techniques, such as Principal Component Analysis (PCA) or Auto-encoders can be used to represent the dataset with a much smaller number of dense parameters while maintaining the performance. Such training models can be used in mobile devices and tried by organizations to check the willingness and hesitancy levels of their employees/members regarding the COVID-19 vaccine based on the same questionnaire.
CRediT authorship contribution statement
Muhammad Hafizh: Conceptualization, Methodology, Writing – Original Draft. Yousif Badri: Conceptualization, Methodology, Investigation, Writing – Review & Editing. Sakib Mahmud: Software, Formal Analysis, Writing – Original Draft. Amir Hafez: Investigation, Writing – Review & Editing. Pilsung Choe: Validation, Supervision, Project administration.
Acknowledgements
Open Access funding has been provided by the Qatar National Library, Qatar.
Data Availability
The datasets collected for this experiment along with codes and other relevant documents used to complete this work have been provided in the following GitHub repository named “COVID-19-Vaccine-Willingness-and-Hesitancy-among-Residents-in-Qatar” mentioned in the references section.
Disclosure statement
The authors declare that they have no known competing financial interests or personal relationships that could have appeared to influence the work reported in this paper.
References
- Ahmed, N., Michelin, R. A., Xue, W., Ruj, S., Malaney, R., Kanhere, S. S., Seneviratne, A., Hu, W., Janicke, H., & Jha, S. K. (2020). A survey of COVID-19 contact tracing apps. IEEE Access, 8, 134577–134601. Institute of Electrical and Electronics Engineers Inc. https://doi.org/10.1109/ACCESS.2020.3010226.
- Alsuwaidi, A. R., Elbarazi, I., Al-Hamad, S., Aldhaheri, R., Sheek-Hussein, M., & Narchi, H. (2020). Vaccine hesitancy and its determinants among Arab parents: A cross-sectional survey in the United Arab Emirates. Human Vaccines and Immunotherapeutics, 16(12), 3163–3169. https://doi.org/10.1080/21645515.2020.1753439
- Anderson, R. M., Heesterbeek, H., Klinkenberg, D., & Hollingsworth, T. D. (2020). How will country-based mitigation measures influence the course of the COVID-19 epidemic? The Lancet, 395 (10228), 931–934. Lancet Publishing Group. https://doi.org/10.1016/S0140-6736(20)30567-5
- Azen, R., & Budescu, D. V. (2003). The dominance analysis approach for comparing predictors in multiple regression. Psychological Methods, 8(2), 129–148. https://doi.org/10.1037/1082-989X.8.2.129
- Brooks, S. K., Webster, R. K., Smith, L. E., Woodland, L., Wessely, S., Greenberg, N., & Rubin, G. J. (2020). The psychological impact of quarantine and how to reduce it: A rapid review of the evidence. The Lancet, 395 (10227), 912–920. Lancet Publishing Group. https://doi.org/10.1016/S0140-6736(20)30460-8
- Chan, E. Y., & Saqib, N. U. (2021). Privacy concerns can explain the unwillingness to download and use contact tracing apps when COVID-19 concerns are high. Computers in Human Behavior, 119, 106718. https://doi.org/10.1016/j.chb.2021.106718
- EHTERAZ - ACTA. (n.d.). Retrieved April 30, 2021, from https://www.acta.gov.qa/en/ehteraz/
- Germann, T. C., Kadau, K., Longini, I. M., & Macken, C. A. (2006). Mitigation strategies for pandemic influenza in the United States. Proceedings of the National Academy of Sciences of the United States of America, 103(15), 5935–5940. https://doi.org/10.1073/pnas.0601266103
- GitHub - Sakib1263/COVID-19-Vaccine-Willingness-and-Hesitancy-among-Residents-in-Qatar: A Machine Learning-based approach to classify COVID-19 Vaccine Willingness and Hesitancy severity among people in Qatar based on survey outcomes … GitHub. (2021). Retrieved August 17, 2021, from https://github.com/Sakib1263/COVID-19-Vaccine-Willingness-and-Hesitancy-among-Residents-in-Qatar
- Jacob, S., & Lawarée, J. (2020). The adoption of contact tracing applications of COVID-19 by European governments. Policy Design and Practice, 1, 1–15. https://doi.org/10.1080/25741292.2020.1850404
- Kotsiantis, S. B. (2007). Supervised machine learning: A review of classification techniques. Informatica, 31, 249–268. https://www.informatica.si/index.php/informatica/article/view/148/140
- Larson, H. J., Jarrett, C., Eckersberger, E., Smith, D. M. D., & Paterson, P. (2014). Understanding vaccine hesitancy around vaccines and vaccination from a global perspective: A systematic review of published literature, 2007-2012. Vaccine, 32 (19), 2150–2159. Elsevier BV. https://doi.org/10.1016/j.vaccine.2014.01.081
- Lazarus, J. V., Ratzan, S. C., Palayew, A., Gostin, L. O., Larson, H. J., Rabin, K., Kimball, S., & El-Mohandes, A. (2021). A global survey of potential acceptance of a COVID-19 vaccine. Nature Medicine, 27(2), 225–228. https://doi.org/10.1038/s41591-020-1124-9
- Marti, M., De Cola, M., MacDonald, N. E., Dumolard, L., & Duclos, P. (2017). Assessments of global drivers of vaccine hesitancy in 2014—Looking beyond safety concerns. PLOS ONE, 12(3), e0172310. https://doi.org/10.1371/journal.pone.0172310
- Ministry of Public Health, S. of Q. (2021, April). COVID-19. https://covid19.moph.gov.qa/EN/Pages/default.aspx
- Ministry of Public Health, S. of Q. (n.d.). Vaccine criteria of exemption from quarantine for those received COVID-19 vaccine outside Qatar. Retrieved April 17, 2021, from https://covid19.moph.gov.qa/EN/Covid19-Vaccine/Pages/vaccination-abroad.aspx
- Norman, G. (2010). Likert scales, levels of measurement, and the “laws” of statistics. Advances in Health Sciences Education, 15(5), 625–632. https://doi.org/10.1007/s10459-010-9222-y
- Oliver, S. E., Gargano, J. W., Marin, M., Wallace, M., Curran, K. G., Chamberland, M., McClung, N., Campos-Outcalt, D., Morgan, R. L., Mbaeyi, S., Romero, J. R., Talbot, H. K., Lee, G. M., Bell, B. P., & Dooling, K. (2020). The advisory committee on immunization practices’ interim recommendation for use of Pfizer-BioNTech COVID-19 Vaccine — United States, December 2020. MMWR. Morbidity and Mortality Weekly Report, 69(50), 1922–1924. https://doi.org/10.15585/mmwr.mm6950e2
- Oyedotun, T. D. (2020). Sudden change of pedagogy in education driven by COVID-19: Perspectives and evaluation from a developing country. Research in Globalization, 2, 100029. https://doi.org/10.1016/j.resglo.2020.100029
- Park, O., Park, Y. J., Park, S. Y., Kim, Y. M., Kim, J., Lee, J., Park, E., Kim, D., Jeon, B. H., Ryu, B., Ko, D., Kim, E., Kim, H., Lee, H., Gwack, J., Jo, J., Lee, J. H., Hyun, J., Kim, J., & Yum, M. (2020). Contact transmission of Covid-19 in South Korea: Novel investigation techniques for tracing contacts. Osong Public Health and Research Perspectives, 11(1), 60–63. https://doi.org/10.24171/j.phrp.2020.11.1.09
- Park, Y., Choe, Y., Park, O., Park, S. Y., Kim, Y. M., Kim, J., Kweon, S., Woo, Y., Gwack, J., Kim, S. S., Hyun, J. L., Ryu, B., Sukjang, Y., Kim, H., Shin, S. H., Yi, S., Lee, S., Kim, H. K., Lee, H., & Kyeongjeongm, E. (2020). Contact tracing during coronavirus disease outbreak, South Korea, 2020. Emerging Infectious Diseases, 26(10), 2465–2468. https://doi.org/10.3201/EID2610.201315
- Pullan, S., & Dey, M. (2021). Vaccine hesitancy and anti-vaccination in the time of COVID-19: A Google Trends analysis. Vaccine, 39(14), 1877–1881. https://doi.org/10.1016/j.vaccine.2021.03.019
- Qatar approves emergency use of Moderna’s COVID-19 vaccine | Coronavirus pandemic News | Al Jazeera. (n.d.). Retrieved March 1, 2021, from https://www.aljazeera.com/news/2021/2/10/qatar-approves-emergency-use-for-modernas-covid-19-vaccine
- Qatar makes COVID-19 app mandatory, experts question efficiency | Coronavirus pandemic News | Al Jazeera. (n.d.). Retrieved March 1, 2021, from https://www.aljazeera.com/news/2020/5/26/qatar-makes-covid-19-app-mandatory-experts-question-efficiency
- Sallam, M., Dababseh, D., Eid, H., Al-Mahzoum, K., Al-Haidar, A., Taim, D., Yaseen, A., Ababneh, N. A., Bakri, F. G., & Mahafzah, A. (2021). High rates of COVID-19 vaccine hesitancy and its association with conspiracy beliefs: A study in Jordan and Kuwait among Other Arab Countries. Vaccines, 9(1), 42. https://doi.org/10.3390/vaccines9010042
- Schmid, P., Rauber, D., Betsch, C., Lidolt, G., & Denker, M. L. (2017). Barriers of influenza vaccination intention and behavior - A systematic review of influenza vaccine hesitancy, 2005-2016. PLoS ONE, 12 (1), e0170550. Public Library of Science. https://doi.org/10.1371/journal.pone.0170550
- Sharpe, C., Wiest, T., Wang, P., & Seepersad, C. C. (2019). A comparative evaluation of supervised machine learning classification techniques for engineering design applications. Journal of Mechanical Design, 141(12), 12. https://doi.org/10.1115/1.4044524
- Sohrabi, C., Alsafi, Z., O’Neill, N., Khan, M., Kerwan, A., Al-Jabir, A., Iosifidis, C., & Agha, R. (2020). World Health Organization declares global emergency: A review of the 2019 novel coronavirus (COVID-19). International Journal of Surgery, 76, 71–76. Elsevier Ltd. https://doi.org/10.1016/j.ijsu.2020.02.034.
- Spears, J. L., & Padyab, A. (2021). Privacy risk in contact tracing systems. Behavior and Information Technology, 1–22. https://doi.org/10.1080/0144929X.2021.1901990
- Veena, K. M., Manjula Shenoy, K., & Ajitha Shenoy, K. B. (2018). Performance comparison of machine learning classification algorithms. Communications in Computer and Information Science, 906, 489–497. https://doi.org/10.1007/978-981-13-1813-9_49
- World Health Organization. (n.d.). Qatar. Retrieved April 28, 2021, from https://www.who.int/countries/qat/
- Zhang, M., Chow, A., & Smith, H. (2020). COVID-19 contact-tracing apps: Analysis of the readability of privacy policies. Journal of Medical Internet Research, 22 (12), e21572. JMIR Publications Inc. https://doi.org/10.2196/21572