
 ?Mathematical formulae have been encoded as MathML and are displayed in this HTML version using MathJax in order to improve their display. Uncheck the box to turn MathJax off. This feature requires Javascript. Click on a formula to zoom.
Abstract
The Centers for Medicare and Medicaid Services (CMS) introduced the Medicare Shared Savings Program (MSSP) for accountable care organizations (ACOs) as part of the Affordable Care Act. Participating ACOs accept risk for the financial outcomes of their assigned populations and share in gains (and, depending on the ACO model, losses) when these are generated. Gains and losses are calculated by comparing actual costs of the ACO population against a benchmark cost based on the historical performance of members in the ACO. Participating ACOs are at risk of model error. Because of stochastic variance in cost distributions and the imperfect operation of the risk-adjustment process, there is a nontrivial probability that an ACO may experience a false positive (gains are calculated where no gains were actually generated) or false negative (a loss is calculated by the model when no losses were actually generated). Using a sample of Medicare fee-for-service data, we model outcomes for typical ACOs and for ACOs consisting of chronic patients. For a typical ACO, the probability of model error resulting in a false positive or false negative outcome is between 5% and 8%. Chronic populations with higher variance have higher probabilities of model error, between 26% and 28% for a diabetes population, and about 23% for a cancer population. In the case of an ACO that generates gains through increased efficiency, model error can result in the ACO failing to realize gains, or even (in a minority of cases) require a reimbursement to the payer. From the perspective of the payer with a number of ACOs, the average overpayment or recovery will be minor. The percentage overpayment (recovery) increases as the prevalence of chronic patients increases. For a population of cancer patients a payer can expect to pay (or recover) between 1.0% and 2.0% of claims, while for a diabetes population the range is 1.5–2.5%. For an individual ACO the loss or gain is more significant because the ACO gains or loses the full amount, with a relatively high probability. While this study has focused on the Medicare Shared Savings Program, the MSSP is just an example of a class of gainsharing models that is increasingly prevalent in value-based contracts. Payers and providers who negotiate value-based contracts need to be aware of and account for model risk in their contracts, particularly as the sizes of populations under management become smaller.
1. BACKGROUND
1.1. Accountable Care Organizations
An accountable care organization (ACO) is a network of doctors and hospitals that share financial and medical responsibilities for patients. The goal is to coordinate care and eliminate unnecessary spending, sharing any financial gains between the sponsor and the ACO. An important example of risk-taking ACOs is the Medicare Shared Savings Program (MSSP). Under the MSSP program, participating ACOs can share gains with CMS, provided they meet a minimum quality of care standard.
1.2. Medicare Shared Savings Program
The Medicare Shared Savings Program was established by the Affordable Care Act (U.S. Congress Citation2010), providing physicians with an incentive to increase efficiency of care delivery. Savings or losses are calculated by establishing a counterfactual: Actual costs of the attributed ACO member population are subtracted from the expected costs of the population. The difference (either a gain or a loss) may be shared with the Centers for Medicare and Medicaid Services (CMS) (gains only, in the case of the original ACO model; more recent models share both gains and losses). An important factor in assessing the expected costs of a population is the application of risk adjustment (Duncan Citation2018; Kautter et al. Citation2014). Risk adjustment is applied to the ACO population to ensure risk equivalence with the comparison population.
illustrates the calculation of gains under the 3-year MSSP contract. The shaded triangles represent the difference between expected and actual costs of the attributed population. Since actual spending is lower than expected, the difference is shared 50/50 between CMS and the ACO.
FIGURE 1. Shared Saving Programs.
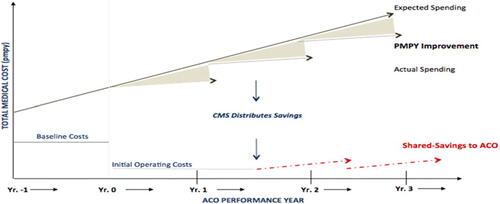
There is a savings hurdle rate that the ACO must surpass in order to be eligible for shared savings. This hurdle rate ranges between 2% for the largest ACOs (60,000 or more Medicare members) and 4% for smaller ACOs (5000 members). While the minimum number of beneficiaries to establish an ACO is 5000, the hurdle rate is adjusted if membership falls below this level.
The inclusion of claims from any provider is a key design feature of the program: The ACO is responsible for the totality of the patient’s expenditures, including those services rendered outside of the ACO participants (providers), despite the ACO having no referral restriction or denial authority. Claims are annualized by dividing them by the fraction of months in the year each beneficiary was enrolled in each Medicare benefit type. Annualization and weighting ensure that payments are correctly adjusted for months of beneficiary eligibility by enrollment type, including new Medicare enrollees and beneficiaries who die. Outlier expenditures are also truncated at the 99th percentile of national beneficiary expenditures for the applicable enrollment type (end-stage renal disease [ESRD], aged, etc.) after application of the completion factor.
For the entire ACO, the average per-capita expenditure is calculated for each of the three benchmark years (the three years prior to the performance year) and performance years by weighting each ACO member’s adjusted claims by the member’s exposure to the ACO (membership months as a fraction of the year). The denominator in this calculation is a weighted sum of members, where the weights are the membership fractions of the year. Mathematically,
where i is Medicare enrollment type, j is year, k is individual beneficiary
where n is the number of ACO beneficiaries of type i in year j, and
is the exposure period of the kth beneficiary of type i in year j.
1.3. Savings Calculation
For a comprehensive view of the Medicare Shared Savings Program (MSSP) gainsharing calculation, see the CMS documentation (U.S. Department of Health and Human Services Citation2018). Calculation of shared savings in the MSSP requires estimates of:
The ACO’s initial benchmark costs. We define the following components:
and trend factors:
Average risk scores:
The initial benchmark costs for performance year 1 (PY1) are then defined as (U.S. Department of Health and Human Services Citation2018):
Updated (adjusted) benchmark. The benchmark year cost PMPY (
^ With the change in risk profile of the population:
^ By adding the absolute increase in National Parts A and B PMPY. This increase is not risk- or trend-adjusted.
Other data elements required for the calculation are:
Performance year expenditures
Absolute national increase in per capita expenditures.
1.4. Prior Studies
Although there are a number of studies of ACOs, most of these deal with the implementation of the model or the outcomes, for example (e.g., Mills and Smith Citation2020; D’Aunno et al. Citation2018; Leventhal Citation2018; Champagne et al. Citation2019; Larson and Gusland Citation2019; McWilliams et al. Citation2016; McWilliams Citation2016; Markovitz et al. Citation2019; Kaufman et al. Citation2019; Williams Citation2016). Kaufman et al. (Citation2019) contains an extensive review of the relevant literature. A 2016 report from the National Association of ACOs (Citation2016)] pointed to a number of areas requiring improvement in the new ACO model; however, model risk was not one of the areas addressed.
1.5. Risk AdjustmentFootnote2
To establish the historical benchmark, the Center for Medicare and Medicaid Services Hierarchal Chronic Condition (CMS–HCC) prospective risk adjustment model is used to calculate beneficiary risk scores (Mills and Smith Citation2020). Risk adjustment in the ACO model adjusts for changes in the health status of the population assigned to the ACO from year to year. These adjustments will account for changes in risk mix in the ACO population between the first and third benchmark years and between the second and third benchmark years. CMS uses separate models for aged/disabled beneficiary subpopulations, including models for community-residing beneficiaries, long-term institutional beneficiaries, new Medicare enrollees, and functioning graft (post-kidney-transplant) beneficiaries, and ESRD beneficiary subpopulations, including models for dialysis beneficiaries and kidney transplant beneficiaries. Risk scores are normalized by Medicare enrollment type for each year to ensure that the mean national FFS risk score equals 1.0. This adjustment ensures consistency in the FFS risk score year to year.Footnote3 For this study we have ignored other subpopulations and focus on the elderly population only.
1.6. Minimum Savings Rate: The Risk Corridor
Because of the considerable randomness in healthcare utilization (and to a degree also unit costs) the MSSP program establishes a minimum savings rate or risk corridor within which neither gains nor losses are credited to the ACO. The size of this risk corridor varies based on population size and is called the “minimum savings rate” (U.S. Department of Health and Human Services Citation2018). Theoretically, an observed gain or loss within the corridor is assumed to be a random event; gains and losses outside of the corridor are considered to be the result of actions on the part of the ACO rather than random events. If the difference between the ACO’s expected and actual costs is below the lower risk corridor limit, this result is interpreted as a genuine gain and shared 50/50 with CMS; conversely, a difference that exceeds the upper bound of the risk corridor is considered a loss and either is ignored (ACO model 1) or results in a payment of 50% of the total amount (other models). It is important to note that when gains and losses are generated outside the corridor, the full amount of gain or loss is subject to the 50% gainsharing (i.e., not just the excess above or below the corridor).
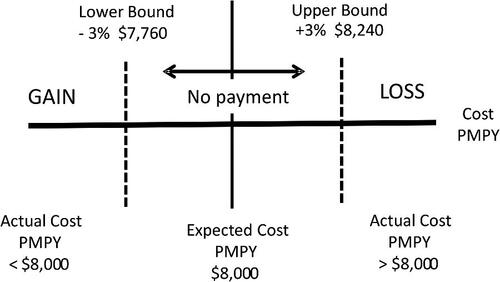
outlines a sample payment scheme for an ACO in the MSSP. Based on , if the ACO’s actual spending is between $7760 and $8240 there is no performance payment. On the other hand, if the ACO’s actual spending is $7500 then the ACO will share the savings of $500 ($8000 – $7500).
FIGURE 2. ACO Gain/Loss and Risk Corridors.
2. PURPOSE
The operation of the gain/loss calculation in the MSSP is complex, and outcomes are at risk of the variability of medical utilization, costs, and the risk adjustment process that is applied. The shared savings model is intended to measure whether an ACO produced financial gains or losses; however, because of variability, there is a probability that the ACO evaluation method inaccurately reflects gains and losses (“false negatives” and “false positives”). A false positive occurs when the calculation results in a gain when the actual result is a loss; conversely, a false negative results when the ACO actually generates a gain but the model indicates a loss. The risk corridor moderates this result somewhat; a false positive (or negative) identified within the risk corridor results in no payment. Only model errors outside the corridor result in actual payments. We model different outcomes using a Medicare fee-for-service database to indicate the extent of this possible model risk under several simplified, hypothetical examples.
3. DATASET DESCRIPTION
The data being evaluated is a sample of 110,000 members extracted randomly from the 2014–2016 Medicare Limited Dataset (5% files). The dataset contains demographic data and medical claims.Footnote4 To avoid issues of termination and new entrants, only members who were continuously enrolled throughout the 3-year period were selected. Risk scores are derived from the hierarchical condition category (HCC) binary variables calculated for each condition, each member, and each year. Each HCC flag represents a medical condition based on a set of diagnosis codes. The Medicare HCC model provides weights (or coefficients) for each HCC. A member’s average risk score is a summation of these weights for each HCC present in the member’s record. For example, HCC1 indicates a claim with a diagnosis of HIV/AIDS. shows a distribution of the population by age, sex, average cost, and average risk score.
TABLE 1 Population Distribution
Average cost and risk score of males and females under the age of 65 years are higher than the corresponding values of adults aged 65–75 years because these age groups represent disabled members eligible for Medicare under the Social Security Disability benefit.
4. METHODS
4.1. Risk Score
We have calculated HCC-based risk scores for each member for each year using the claims data in our dataset and the CMS-provided SAS code.
4.2. Calculating Gains and Losses
For our study we created synthetic ACOs by randomly extracting groups of members of different sizes from the Medicare dataset. We proxied the CMS gain/loss calculation by comparing the cost of our synthetic ACO to the mean cost of the population, adjusted for the difference in risk scores. Note that this is a simplification because the actual MSSP benchmark is based upon the historic costs of the members in the ACO over the past 3 years. The population mean is calculated for the entire dataset. The calculation is:
The risk adjustment factor is calculated as the ratio of the risk score for the sample ACO to the risk score for the population. An example of the calculation is shown in .
TABLE 2 Gain/(Loss) Calculation Examples
In the preceding example the gains and losses of a specific ACO are calculated. The mean cost of the population and that of the sample remain the same for each example, but the risk score of the population and sample change. The ratio of the sample risk score to the population risk score decreases, causing the ACO gain to turn into an ACO loss.
4.3. Resampling Bootstrap
To estimate the distribution of the gains and losses we created synthetic ACOs by sampling subsets from the overall database (Efron Citation1982), using bootstrapping with replacement. We use this technique to estimate the true sampling distribution of gains and losses. In this study, we are interested in knowing the distribution of actual outcomes and comparing outcomes to the appropriate risk corridors (the risk corridor narrows as the size of the ACO increases). Bootstrap interval estimates are asymptotically more accurate than standard interval estimates obtained with sample variance and assumptions of normality. Because the sample ACOs are randomly extracted from the database, we expect each ACO’s mean to differ from the mean of the overall population. However, for a large number of sample ACOs we would expect the distribution of the sample gains and losses to have a zero mean and a small standard deviation. We consider sample ACO sizes of 3000, 5000, and 10,000 for each of the different sample groups. We ran 1000 iterations for each sample size to generate a distribution of gains/losses with respect to the actual observed risk-adjusted PMPM from each simulation compared to the benchmark PMPM and the size of the MSSP-defined risk corridor (minimum savings rate).
5. RESULTS
5.1. Baseline Samples
In the Medicare MSSP program, ACO outcomes are compared with the ACO’s 3-year historic performance, which is used to establish a benchmark target price. Since we don’t have a full 3 years of history for each member or a physician attribution to assign members to the same practice, we created synthetic ACOs by randomly sampling from the population, risk adjusting the cost of that sample population, and then comparing that sample’s risk-adjusted average costs to the average risk-adjusted costs of our entire Medicare sample data set. Since this is a random distribution of members, after applying risk adjustment and the risk corridor, we expect the synthetic ACO’s cost to result in neither a gain nor a loss when no program impact has occurred. Later we will relax this assumption and evaluate model error in the presence of a program impact. Generally, our synthetic ACOs will exhibit either gains or losses, although the majority of these gains and losses should fall within the corridor as the assumed actual gain or loss is below the threshold of the risk corridor. In the baseline case, a deviation from zero in the calculation of gain/(loss) represents model error. The risk corridor serves to moderate the effect of the error (although ACOs with gains that fall within the corridor experience a loss of revenue). The groups we see outside of the risk corridor result in false positives or false negatives as a consequence of model error. In this study the overall dataset (110,000 members) represents the Medicare population. In we report the population mean PMPY compared with the mean PMPY of bootstrapped samples of different sized ACOs. Model error is observed when the true gain/loss result is zero but the model results in either a false positive or false negative. In we report the frequency of ACOs with gains or losses outside of the risk corridor. Given that these results are based on 1000 iterations, the observed frequency of gains varies between 3.1% (5000-member ACO) and 2.4% (10,000-member ACO). Losses occur with observed frequency between 5.1% and 2.8%. We also report gains and losses as a percentage of underlying cost. From the payer perspective, the payer will make payments (or recover losses) erroneously equal to 50% of the full amount of gains (losses) for those ACOs for which the results lie outside the corridor. A payer may not consider these over- or underpayments to be material, particularly when the payer contracts with multiple ACOs. However, errors have a more significant impact on the provider. As a result of model error, a provider will reimburse 50% of the entire loss or be paid 50% of the entire gain, with different estimated probabilities depending on the size of the ACO, if the ACO’s results are outside the corridor.
TABLE 3 Distribution of Gains/Losses in the Sample ACOs
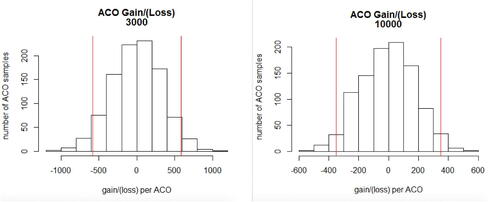
shows the distribution of outcomes from the 1000 iterations of sample ACO calculations for ACOs of size 3000 and 10,000 members. and show that there is a small number of ACOs that fall outside of the risk corridors. From the standpoint of CMS, in some cases ACOs are reimbursed when in fact there are no gains. Conversely, ACOs could (for some ACO models) be receiving money even when there is no loss. Given the distribution of ACOs with gains and losses, the size of ACOs, and the model to which the ACO belongs, CMS may experience an overall gain or loss.
FIGURE 3. Baseline Sample Results. Note: Red vertical bars are risk corridors.
5.2. Disease-Specific Populations
In the baseline analysis already shown, we assume that the distribution of disease conditions within the ACO is the same as that in the underlying population. However, different ACOs will experience a different mix of diseases. We are interested in the effect of different diseases on gains and losses. As an example, we model ACOs consisting of 100% patients with diagnoses of diabetes and cancer in order to illustrate the effect of condition mix within the ACO. The specific diabetes and cancer samples consist of members with HCCs as defined in the appendix. Because there are relatively fewer members with these conditions, we model only ACOs with 3000 and 5000 members.
5.3. Diabetes Sample
Results for the application of the ACO model to the diabetes sample are shown in and . As expected, the mean cost of the ACO diabetes population is higher than that of the overall population. We apply the risk adjustment process using the ratio between the Sample and Population Average Risk Scores to adjust the population mean, although the population and sample means are well matched with respect to risk score. The frequency of ACOs with gains varies between 13.6% and 15.3%; the frequency of losses varies between 12.1% and 12.7%. In other words, having more chronic patients in the ACO population increases the probability of model error and correspondingly incorrect gains or losses. From the perspective of the payer, assuming a broad distribution of ACOs, the normal distribution of gains and losses will not have much effect. As in the base case the impact on the provider is more significant.
FIGURE 4. Diabetes Sample Results and Histograms. Note: Red vertical bars are risk corridors.
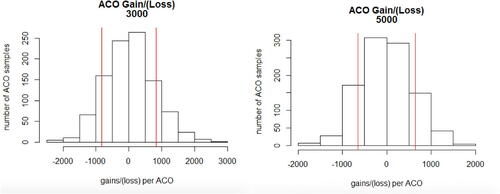
TABLE 4 Distribution of Gains/Losses in Diabetes Population st
shows the patient distribution for an ACO consisting of 100% patients with diabetes diagnoses.
TABLE 5 Diabetes Patient Distribution
A consequence of this analysis is that from a pure business perspective an ACO may try to avoid enrolling new diabetics in its population—maybe by restricting endocrinologists. However, an ACO that believes it is highly efficient at managing people with diabetes might actively recruit these patients because the ACO can benefit from reducing the variance of these patients’ outcomes.
5.4. Cancer Sample
shows the patient distribution for an ACO consisting of 100% patients with cancer diagnoses.
TABLE 6 Cancer Patient Distribution
Results for the application of the ACO model to the cancer sample are shown in and . Results for the cancer population are similar to those of the diabetes population, although cancer patient costs are higher and model error rates are slightly lower. Once again, from the perspective of the payer, errors are relatively immaterial, while the implication of the error for providers is more significant.
FIGURE 5. Cancer Sample Results and Histograms. Note: Red vertical bars are risk corridors.
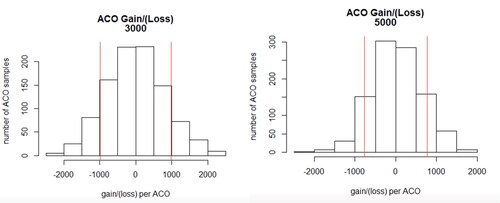
TABLE 7 Distribution of Gains/Losses in Cancer Population
5.5. Model Error in the Presence of Efficiency Gains
One of the objectives of the ACO initiative is to give providers incentives to practice more efficiently and thereby to reduce Medicare’s cost. As an example, we examine the effect of model error on baseline, diabetes, and cancer populations in ACOs that reduce costs by 5% ().
TABLE 8 Distribution of Gains/Losses in Different Populations with 5% Efficiency Gains
For the baseline population, 47% of ACOs with a size of 3000 members that have achieved a 5% savings reduction compared to their benchmark are not awarded a performance- based payment. Likewise, 10% of ACOs with a population of 10,000 that have achieved a 5% reduction in savings are not awarded a performance-based payment. This model error risk obviously reduces quickly as population size increases, but is significant for smaller ACOs.
The impact son our hypothetical 100% cancer and diabetes populations are even larger. For the cancer population, 52% of ACO populations of 3000 that achieve a 5% reduction will not receive a performance based payment. Even worse, 0.4% will actually have to make a loss payment despite achieving a 5% cost reduction! The diabetes results are about the same, albeit slightly worse from the provider perspective.
6. DISCUSSION
The Medicare MSSP ACO program distributes estimated gains (and in some newer models, losses) to participating ACOs. Because the shared savings model applies cost projections and adjustments using relative risk scores to costs that are themselves stochastic, ACO providers are likely to experience model risk. We have modeled synthetic ACOs and applied bootstrapping to estimate the distribution of gains and losses, both for ACOs with membership representative of the underlying Medicare population and for ACOs consisting of patients with specific diagnoses, assuming both no reduction in cost and a 5% reduction in cost. Depending on the size of the ACO and the distribution within the ACO of different conditions, there is a significant probability that the model will generate false positive and false negative gains and losses, resulting in erroneous gainsharing payments or recoveries on the part of the payer. These payments and recoveries are relatively immaterial to the payer provided the payer contracts with a large number of ACOs. However, with some nontrivial frequency a provider can expect either to lose gains that it is otherwise entitled to, or to have to reimburse a payer for losses erroneously. These effects are larger when the ACO enrolls more condition patients or when the ACO has potential gains from increased efficiency.
7. CONCLUSION
Our study shows that participating ACOs are at risk that they will not be rewarded for reducing costs within their populations because of the operation of the statistical model. Conversely, ACOs may also receive gains that they have not earned solely due to model error. The risk depends both on random fluctuations in utilization and cost within the ACO, as well as the operation of the risk adjustment model. The extent of model error appears to be larger in high-risk populations.
8. LIMITATIONS
This study is a simplified application of the actual CMS ACO model intended to evaluate the effect of model risk within the MSSP ACO model. Specifically, we have not used 3 years of historical data, a trend adjustment factor, truncated costs, and the entire Medicare population as our comparison. Because of our underlying population size (110,000), we have not been able to model the effect of variance on larger ACOs. Our results show that there is a tendency (as we would expect) for smaller errors in larger ACOs. Nevertheless the size of the errors (particularly in chronic populations) indicates that model error remains a concern, even in larger ACOs. We believe that this simplified model provides important guidance for researchers, policymakers, and participants in the CMS ACO program.
Discussions on this article can be submitted until January 1, 2024. The authors reserve the right to reply to any discussion. Please see the Instructions for Authors found online at http://www.tandfonline.com/uaaj for submission instructions.
Additional information
Funding
Notes
1 Per member per year.
2 For a summary of the MSSP ACO program and risk adjustment, see Duncan (Citation2018).
3 Note also that data used for the quarterly reports are not risk adjusted.
4 Medicare Parts A and B; the LDS dataset does not include prescription drugs (Part D).
REFERENCES
- Champagne, N., C. Mills, and J. Karcher. 2019. "Pathways to success” MSSP final rule: Key revisions to the proposed rule. Seattle, WA: Milliman, Inc.
- D'Aunno, T., L. Broffman, M. Sparer, and S. R. Kumar. 2018. Factors that distinguish high performing accountable care organizations in the Medicare Shared Savings Program. Health Services Research 53(1): 120–37. doi:10.1111/1475-6773.12642
- Duncan, I. 2018. Healthcare risk adjustment and predictive modeling, 2nd ed. New Hartford, CT: Actex Publications.
- Efron, B. 1982. The jackknife, the bootstrap, and other resampling plans. Philadelphia, PA: Society of Industrial and Applied Mathematics.
- Kaufman, B. G., S. Spivack, S. C. Stearns, P. H. Song, and E. C. O’Brien. 2019. Impact of accountable care organizations on utilization, care, and outcomes: A systematic review. Medical Care Research and Review 76(3): 255–90. doi:10.1177/1077558717745916
- Kautter, J., G. C. Pope, and P. Keenan. 2014. Affordable Care Act risk adjustment: Overview, context, and challenges. Medicare and Medicaid Research Review 4(3): E1–E11. doi:10.5600/mmrr.004.03.a02
- Larson, A., and C. Gusland, 2019. “Pathways to success” MSSP final rule: Winners and losers. Seattle WA: Millman, Inc.
- Leventhal, R. 2018. MSSP ACOs have performed below CBO estimates. In Healthcare innovation. Sarasota, FL: Healthcare Innovation Group.
- Markovitz, A. A., J. M. Hollingsworth, J. Z. Ayanian, et al. 2019. Risk adjustment In Medicare ACO program deters coding increases but may lead ACOs to drop high-risk beneficiariaries. Health Affairs (Millwood) 38(2): 253–61. doi:10.1377/hlthaff.2018.05407
- McWilliams, J. M. 2016. Changes in Medicare Shared Savings Program savings from 2013 to 2014. JAMA 316(16): 1711–13. doi:10.1001/jama.2016.12049
- McWilliams, J. M., L. A. Hatfield, M. E. Chernew, B. E. Landon, and A. L. Schwartz. 2016. Early performance of accountable care organizations in Medicare. New England Journal of Medicine 374(24). doi:10.1056/NEJMsa1600142
- Mills, C., and C. Smith. 2020. ACO minimum savings gain/(loss): Less is more. Seattle WA: Milliman, Inc.
- National Association of ACOs. 2016. ACOs at a cross-roads: Cost, risk and MACRA. Washington, DC: NAACOS.
- U.S. Congress. 2010. Patient Protection and Affordable Care Act. Washington, DC: U.S. Congress.
- U.S. Department of Health and Human Services. 2018. Medicare Shared Savings Program: Shared savings and losses and assignment methodology, ed. Centers for Medicare and Medicaid Services, 1–74. CMS: Baltimore, MD: CMS.
- Williams, S. B. 2016. Strategic plan for maximizing shared savings in accountable care organizations. Journal of Healthcare Management 61(4): 261–70.