
Abstract
A field study was conducted to test the effectiveness of faucet-mounted point of use (POU) water filters for removing high concentrations of lead in drinking water from premise plumbing sources and lead service lines (LSL). These filters were concurrently certified for total lead removal under NSF/ANSI Standard 53 (NSF/ANSI-53) and for fine particulate (Class I) reduction under NSF/ANSI Standard 42 (NSF/ANSI-42). In 2016, filtered and unfiltered drinking water samples were collected at over 345 locations in Flint, Michigan. Over 97% of filtered water samples contained lead below 0.5 µg/L. The maximum lead concentration in filtered water was 2.9 µg/L, well below the bottled water standard. The effectiveness of the POU activated carbon block filters in reducing lead concentrations, even above the 150 µg/L NSF/ANSI-53 challenge standard, is likely related to trapping particles due to the small effective pore size of the filters, in addition to ion-exchange or sorption removal of soluble lead. Properly installed and maintained POU filters, certified under both NSF/ANSI-53 (for total lead) and NSF/ANSI-42 (for fine particulate), can protect all populations, including pregnant women and children, by reducing lead in drinking water to levels that would not result in a significant increase in overall lead exposure.
Introduction
Filtration of tap drinking water through point-of-use (POU) water treatment devices has gained acceptance and popularity,[Citation1] in part due to concerns regarding lead contamination from service lines and interior premise plumbing materials. Lead is a neurotoxin that can be harmful even at low exposure levels, especially to young children and pregnant women, and the US Centers for Disease Control states that “No safe blood lead level in children has been identified.”[Citation2] Minimizing lead exposure, particularly by the removal of lead sources, has been the focus of public health experts and practitioners. Blood lead levels in children are generally declining following implementation of several regulations to remove sources of lead from homes and the environment, prevent the use of lead materials, and improve corrosion control in drinking water systems. Legacy sources of lead, such as leaded paint and lead-containing plumbing, still affect many children.[Citation2,Citation3] The Centers for Disease Control (CDC) blood lead level reference level (5 µg/dL) is set such that 2.5% of children ages 1–5 (i.e., over a half of a million children based on US Census Bureau data) are above this reference level, and even lower levels have been associated with lifetime effects on health and well-being for children[Citation2,Citation4,Citation5] and adults.[Citation6] In June 2016, American Association of Pediatrics issued a policy statement recommending lead levels in water consumed by children do not exceed 1 µg L−1.[Citation5]
Where present, lead service lines (LSL), which connect the water main to the premise (i.e., indoor or household) plumbing, are the largest contributor to waterborne total lead in homes.[Citation7,Citation8] Although use of LSLs was banned in 1986, surveys estimate 6.1 million to 10.2 million lead service lines[Citation9,Citation10] are likely still in use. This number is likely higher because many water systems do not have good records, especially on private property. Based on the experience of the authors, most public water systems historically only removed the public portion of LSLs. Premise plumbing components, including brass fixtures and fittings, lead solder,[Citation7,Citation11–13] flux, water meters, lead goosenecks, and galvanized steel pipes,[Citation14] can also release large amounts of lead to drinking water. Corrosion control water treatment is essential for lowering lead levels in water. Properly optimized corrosion control treatment can significantly reduce water lead levels across the whole system, but many factors can still result in high lead release at individual homes even with properly optimized corrosion control treatment.
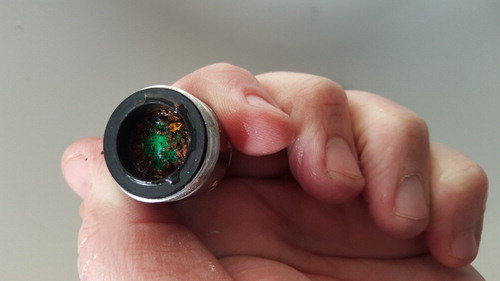
Particles originating from corrosion by-product or scale deposits, which can be sporadically released from LSLs and other lead-containing plumbing and may contain very high lead levels, may not be captured with most water sampling protocols.[Citation15,Citation16] Physical, hydraulic, and chemical disturbances to these lead pipes and associated galvanized pipes have resulted in measurable and undesirable particulate release.[Citation7,Citation17–20] The size of the “particles” can range from the nanometer scale to naked-eye visibility, and the size and mobility are governed by water chemistry factors.[Citation15,Citation16,Citation21] illustrates an example of granular particulate material in a Flint household, that was large enough to be filtered out by the faucet aerator. When elevated lead is present in tap water used for drinking, cooking, or baby formula preparation, there is a higher risk of detrimentally impacting blood lead levels, especially for infants and young children.[Citation15] Because the inorganic lead in drinking water is not absorbed through the skin,[Citation22,Citation23] washing hands and bathing have a negligible effect on blood lead levels, even if elevated lead is present in tap water.
Figure 1. An example of particulates observed in a faucet aerator, Flint, MI (Photo credit: Peggy Donnelly, EPA).
Lead contaminated drinking water became a major issue in Flint, Michigan, following the April 2014 transition from drinking water purchased from the City of Detroit to the Flint River as the city’s drinking water source,[Citation24–26] resulting in an increased percentage of children with elevated blood lead levels.[Citation27] Federal agencies including EPA and the Department of Health and Human Services (HHS) subsequently recommended that Flint residents use either filtered water (i.e., using NSF/ANSI-53 certified lead-reducing POU filters) or bottled water for drinking and cooking. Federal and state agencies and other organizations distributed Brita® (Brita, LP [part of The Clorox Company family of companies]; Oakland, CA) and PUR® (PUR Water Purification Products, Inc. [Helen of Troy Ltd.], El Paso, TX) brand POU water filters for use in Flint to protect residents against elevated lead. The State of Michigan has been distributing POU filters for use in Flint since January 2016,[Citation28] and this program is expected to continue until one year after all LSLs have been removed in Flint.[Citation29] The filters are certified in accordance with NSF/ANSI-53 as being effective for the removal of particulate and soluble lead at concentrations in water up to 150 µg L−1. Testing of unfiltered water from Flint residences by EPA, MDEQ, and others showed water lead levels exceeded 150 µg L−1, and in extreme circumstances levels above 10,000 µg L−1 were measured.[Citation30,Citation31] As a result, there were questions from consumers and the medical community about the ability of distributed POU filters to reduce elevated lead levels found in Flint given the filters were certified using a challenge concentration of 150 µg L−1 total lead. In some cases, direct statements were made that caused residents to believe that the filters were not capable of working at levels of lead released in many homes, and in some cases they were advised to only use bottled water for drinking or cooking.[Citation32–35]
The POU filter models included in this study had dual certification in accordance with NSF/ANSI-53 (total lead) [Citation36] and NSF/ANSI-42 (Class I particulate, 0.5 to 1 micron). [Citation37] These standards mutually support each other, and the relative impact of one certification versus the other could not be separated in this study. In fact, the relative impact of each certification would be expected to vary from house to house and city to city, based on the physical and chemical speciation of the lead at that site. The certification of POU filters to both of the noted NSF/ANSI standards is intended to ensure that the device reduces total lead (dissolved and particulate) to below 10 µg L−1 during the performance lifetime of the product.
The solubility chemistry and speciation of lead has been widely discussed and reviewed, especially since the early 1980s.[Citation16,Citation38] Because of the complexity of lead chemistry in drinking water and the wide variations of finished water chemistry across the United States, one single test condition was not deemed adequate for lead removal certification testing under NSF/ANSI-53. Peak soluble lead and peak colloidal or particulate lead would normally occur in different background water quality conditions, particularly with different pH, alkalinity and orthophosphate corrosion inhibitor concentrations. Dissolved lead concentrations approaching the NSF/ANSI-53 certification testing challenge level of 150 µg L−1 would most often occur at acidic pHs to slightly basic pHs, in the absence of phosphate corrosion inhibitors. The NSF/ANSI-53 testing protocol challenges POU filter devices with two types of water each containing 150 µg L−1 total lead: (1) a low-alkalinity aggressive water (pH 6.5, alkalinity 10–30 mg CaCO3/L) and (2) a more mineralized water (pH 8.5, alkalinity 100 mg CaCO3/L). Revisions to the NSF/ANSI-53 protocol in 2007 added particulate lead by requiring 30 ± 10% of the 150 µg L−1 of the total lead in the challenge influent be particulate and upwards of 20% of the total lead content be fine particulate lead (0.1–1.2 microns).[Citation36,Citation39]
Many newly certified POU filters utilize an outer fabric or fiber filter surrounding a solid block composed primarily of activated carbon, made of small particles of activated carbon augmented in some filter cartridges with ion exchange or sorption media for metals removal, fused together to form a block of uniform pore size, typically 0.5–1.0 micron.[Citation39] Solid block activated carbon will be simplistically abbreviated as SBAC for the purposes of this article. Deshommes et al. (2010) demonstrated consistent lead removal by tap-mounted POU filters (80–99% removal) and under-the-sink POU filters (82–90% removal), which were NSF/ANSI-53-certified for total lead after 2007 and NSF/ANSI-42-certified for fine particulate (0.5–1 micron), when challenged with two levels of particulate lead (approximately 20 µg L−1 or 100 µg L−1) and one level of dissolved lead (approximately 50 µg L−1).[Citation39]
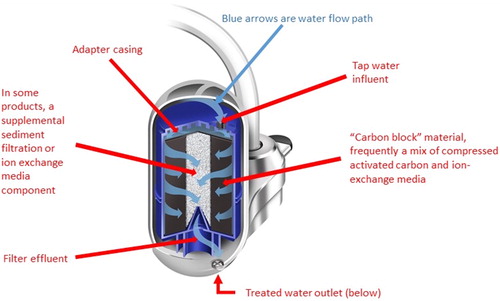
Based on a combination of understanding of the mechanisms of lead removal within the filters, and some field study evidence,[Citation40] the authors expected that POU filters certified in accordance with NSF/ANSI-53 (total lead removal) and NSF/ANSI 42 (Class I particulate reduction, 0.5–1 micron) standards would be effective at providing protection against lead levels much higher than 150 µg L−1. illustrates the components of the commercial POU faucet-mounted filtration devices designed to remove particulate and soluble metals, including lead. At high lead levels (>150 µg L−1) and typical drinking water pH conditions, lead solubility dictates that much or most of the lead present in the water would be in particulate form.[Citation16,Citation38] Thus, elevated lead would be physically trapped and removed by the filters. Consistent with known water filtration performance, the removal effectiveness of particulate lead would become progressively better with more clogging, though for best flow performance, the certified filter capacity (gallons) should not be exceeded.
Figure 2. Schematic diagram of the internal structure of a typical faucet-mounted POU water filter, representative of the models tested by this study in Flint, MI.
Furthermore, elevated levels of other metals such as iron, copper, and zinc were occasionally reported in unfiltered drinking water samples. Although POU filters used to remove lead from water in Flint were not certified for removal of such metals, the general expectation among drinking water experts, based on the properties of carbon-based and cation exchange media materials, was that the filters would prove capable of removing them as well. An extensive drinking water sampling effort was initiated in Flint to evaluate the effectiveness of POU filters under field conditions in actual residences, including locations with elevated lead above the 150 µg L−1 certification level. The objective of this work was to summarize the findings of this filter effectiveness sampling program in Flint, Michigan.
Materials and methods
Filtered and unfiltered grab samples were collected to assess whether the NSF/ANSI-53 and NSF/ANSI-42 certified POU filters being distributed in Flint were effective for the reduction of lead, regardless of influent levels above the certification criteria of 150 µg L−1. Sampling locations were selected by targeting homes with previous lead results above 150 µg L−1,[Citation30,Citation41] with a confirmed LSL coming into the home, or at the residents’ request. Almost all samples were collected from within the Flint drinking water system service area, with the exception of 9 sampling locations in surrounding areas served by Beecher Metropolitan District (2 sites), Genesee County (6 sites), and a private well (1 site).
Filtered and unfiltered water grab samples were collected at each selected sampling location, generally at the kitchen faucet, as outlined below in accordance with EPA’s Quality Assurance Project Plan.[Citation41] Samplers recorded field observations including the filter type/brand, filter indicator status, and the resident’s estimate of the time since the filter or cartridge was installed. Samplers were not able to verify the certification status of the filter and cartridge, except for those installed by the sampling team. All samples were collected from the cold water tap, and three types of 1000-mL samples were collected from homes:
Filtered Water, Existing Filter – One grab water sample was collected through the existing water filter already installed at the home (if present).
Unfiltered Water – An unfiltered water grab sample was collected after removing the existing filter or turning the by-pass valve on the filter. No cleaning or flushing was conducted prior to the unfiltered water grab sampling.
Filtered Water, New Filter – Following installation and flushing of a new filter or replacement filter cartridge for approximately 2 min, a grab sample was collected through the newly installed filter or filter cartridge. At some sites that had an existing filter in place that appeared in good condition (including no red or yellow indicator lights), a new filter or filter cartridge was not installed and no ‘New Filter’ sample was collected.
Only PUR® and Brita® POU filters that have been certified under NSF/ANSI-53 (total lead) and NSF/ANSI-42 (Class I particulate) were approved for distribution to Flint residents. These PUR® and Brita® POU filters use a SBAC matrix, as described above. All POU filters installed by EPA during the study (‘New Filter’ samples) were certified under NSF/ANSI-53 (total lead) and NSF/ANSI-42 (Class I particulate). Based on their wide, no-cost distribution to Flint residents, it is assumed that all ‘existing’ PUR® and Brita® POU filters included in this study were certified under NSF/ANSI-53 (total lead) and NSF/ANSI-42 (Class I particulate).
There were slight modifications in the sampling protocol during the course of the study, including elimination of the “Filtered Water, New Filter” at most locations, unless a replacement filter was needed. According to the respective manufacturers [Citation42–45], the PUR® and Brita® POU filters are designed with a warning light to come on when the filter should be changed soon (e.g., approximately 25% of the rated volumetric capacity or estimated useful lifetime remaining) and turn red after the filter reaches end of life (e.g., rated volumetric capacity or estimated useful lifetime).
Each grab water sample consisted of filling one 1,000-mL HDPE bottle, which was then field preserved (HNO3 to pH < 2) for analysis of total metals (including lead). EPA regional laboratories or a contract laboratory analyzed samples by EPA Methods 200.8 (Pb, Cu, Zn) and 200.7 (Fe, Mn, Al, Ni, Cd, Cr, Ca, Mg, K, Na), after acid digestion. Lead levels were reported down to levels between 0.11 and 0.5 µg L−1 among the analytical laboratories used in this study, and method detection and reporting limits also varied among the laboratories for some of the other metals of interest (see Table S2). Final analytical results were evaluated, and 2 sites were resampled due to apparent sampling errors; the resampling results are included in the subsequent analysis. Residents were provided all sampling results from sampling locations at their homes.
Lead sources in the plumbing are highly variable along the water flow pathway, the amount of water used at any given time varies, the volume of the sample represents different lengths of pipes, and the stagnation time between water uses varies greatly; for all these reasons, the lead (and other metal) filter influent concentration constantly varies [Citation12,Citation17,Citation46] at each site. Thus, there was no way to do a simple “before and after” filtration impact sampling when the “before” sample is never constant, as could be done in a certification laboratory setting. Because the distribution system water quality was shown by water quality sampling to be generally consistent with respect to the best estimation of the parameters affecting lead release, the study design was to pool unfiltered grab samples as representing “before” lead sample concentrations, and to compare the pools of post filtration grab sample results for the “existing” filters and the newly-replaced filters.
Results and discussion
Given the nature of the filtered and unfiltered water sampling, and the varying reporting limits amongst the analytical laboratories, an effective way to present and evaluate the data visually is by using percentile distribution versus concentration plots, with a logarithmic scale on the concentration axis ( through 7). The concentrations of any chosen percentile, and even individual values, can be simply obtained by the intersection of projecting lines from each axis. Table S3 summarizes the metals results for grab unfiltered water samples as well as the post filtration grab sample results for the “existing” filters and the newly-replaced filters.
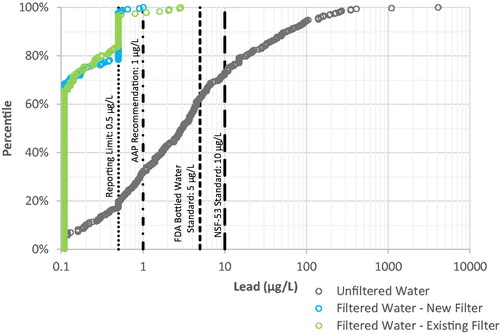
Figure 3. Percentile versus concentration distribution of lead levels in filtered and unfiltered drinking water samples. Note logarithmic scale for lead concentration. Laboratory results presented include some estimated values between the Method Detection Limit (0.11 µg L−1) and the Reporting Limit (0.5 µg L−1).
Removal of lead
High lead levels, in some cases above the 150 µg L−1 NSF/ANSI-53 challenge concentration and as high as 10,000 µg L−1, had been detected in unfiltered water samples collected in Flint, both as part of this study and other sampling efforts.[Citation30,Citation31] The unfiltered water samples represented a wide range of stagnation times, typical of normal household use conditions, with less than 20% of the samples in this study representing a confirmed stagnation period of 6 h or more. The maximum lead concentration in the unfiltered water at the 345 sampling locations in this study was 4,080 µg L−1, with approximately 4% of the unfiltered water samples above 150 µg L−1 and over 37% above the Food & Drug Administration (FDA) standard for bottled water (5 µg L−1). Approximately 20% of the unfiltered water samples contained lead below the laboratory reporting limit of 0.5 µg L−1. Variability in lead levels at individual sampling locations can be attributed to many factors, including site-specific plumbing and service line materials, low water usage, long stagnation time, as well as particulate lead release caused by physical, hydraulic, and chemical disturbances to lead and associated galvanized pipes.[Citation12,Citation14,Citation16,Citation17,Citation20]
Although a detailed characterization of particulate versus soluble lead was not conducted, the indirect evidence and theoretical lead solubility modeling support the conclusion that a significant portion of the lead at the highest concentrations is present as particles. This statement is supported by field observations of heavy loading of faucet aerators with particulate material, which was confirmed by laboratory testing to have a high lead content (see and Table S4). The particulate lead is likely to be scale material that has been released from the interior of water service lines and interior pipes. Previous EPA investigation of 91 lead pipe scale samples from 26 different drinking water systems revealed that the lead concentration ranged from approximately 3% to over 90% by weight, depending on the nature of the treatment and water chemistry.[Citation47]
Filtered water lead levels were very low for cartridges in use for days or weeks (existing filter), as well as those sampled on the same day as the cartridge was installed (new filter) (. As shown in 97 and 98% of the filtered water lead levels were lower than the laboratory reporting limit of 0.5 µg L−1 for existing and new filters, respectively. Lead levels in all but 6 filtered water samples (99%) were below the AAP recommendation of 1 µg L−1. [Citation5] and the maximum lead level in filtered water observed was 2.9 µg L−1. Lead levels in all filtered water samples were below the FDA bottled water standard of 5 µg L−1 and the NSF/ANSI-53 standard for certification of 10 µg L−1.
A limited number of filtered water samples were collected through a filter which was due to be changed (red light observed), but they are not included in the graphical removal analysis. Of these 12 filtered water samples, lead levels ranged from <0.11 to 0.56 µg L−1. However, these results should not suggest that consumers should use their water filters longer than recommended by the manufacturer, because additional important complications could arise, as discussed elsewhere in this article.
Further statistical analyses were performed, making different assumptions about the data below the laboratory reporting limit and the distribution of the lead concentrations. These are summarized in the Supplemental Information.
Removal of other metals
Although tap-mounted filters certified under NSF/ANSI-53 for total lead removal are not jointly certified for their removal, the sampling results showed incidental removal of copper, zinc, iron, and manganese. The co-occurrence of other metals in unfiltered water, and the removal of the other metals along with removal of lead, provide further evidence that high lead removal is by physical removal of particles. through 7 illustrate, in the same fashion as , the comparisons of filter performance for the common corrosion or scale release byproduct metals copper, zinc, iron, and manganese.
Figure 4. Distribution of copper levels in filtered and unfiltered drinking water samples. Note logarithmic scale for lead concentration. Laboratory results presented include some estimated values between the Method Detection Limit (0.75 µg L−1) and the Reporting Limit (5 µg L−1).
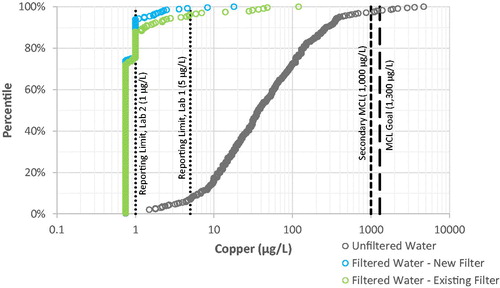
Copper. 98% of filtered water samples contained copper below the higher laboratory reporting limit of 5 µg L−1, and the maximum copper concentration in filtered water was 120 µg L−1 (see ), well below the Maximum Contaminant Level Goal (MCL Goal) of 1,300 µg L−1. By comparison, unfiltered water samples had higher copper as high as 4,700 µg L−1, with 2% above the MCL Goal of 1,300 µg L−1.
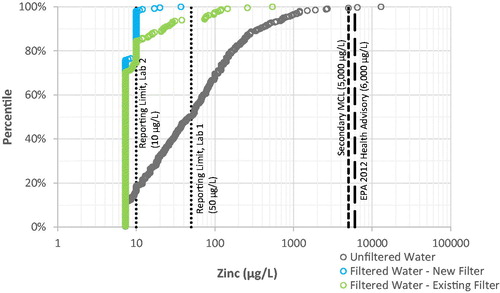
Zinc. 97% of filtered water samples contained zinc below the higher laboratory reporting limit of 50 µg L−1, and the maximum zinc concentration in filtered water was 540 µg L−1 (see ), well below the MCL Goal of 5,000 µg L−1. By comparison, unfiltered water samples had higher zinc, with 1% above the MCL Goal of 5,000 µg L−1 and a maximum of 13,000 µg L−1.
Figure 5. Distribution of zinc levels in filtered and unfiltered drinking water samples. Note logarithmic scale for lead concentration. Laboratory results presented include some estimated values between the Method Detection Limit (7.3 µg L−1) and the Reporting Limit (50 µg L−1).
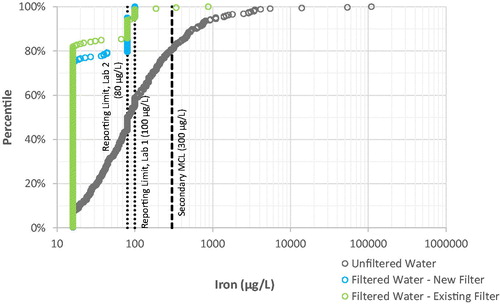
Iron. 99% of filtered water samples contained iron below the higher laboratory reporting limit of 100 µg L−1, and only two filtered water samples (0.4%) were above the Secondary MCL of 300 µg L−1 (see ). By comparison, unfiltered water samples had higher iron, with 19% above the Secondary MCL of 300 µg L−1 and a maximum of 110,000 µg L−1 (110 mg L−1).
Figure 6. Distribution of iron levels in filtered and unfiltered drinking water samples. Note logarithmic scale for lead concentration. Laboratory results presented include some estimated values between the Method Detection Limit (16 µg L−1) and the Reporting Limit (100 µg L−1).
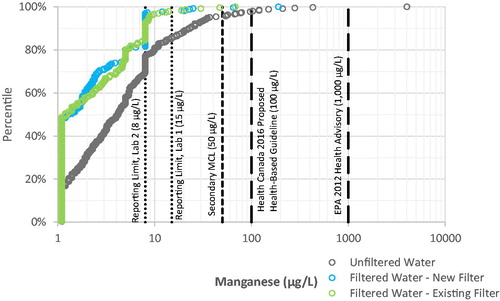
Manganese. 98% of filtered water samples contained manganese below the maximum laboratory reporting limit of 15 µg L−1, and only three filtered water samples (0.6%) were above the Secondary MCL of 50 µg L−1 (see ). By comparison, unfiltered water samples had higher manganese, with 4% above the Secondary MCL of 50 µg L−1 and a maximum of 4,020 µg L−1.
Figure 7. Distribution of manganese levels in filtered and unfiltered drinking water samples. Note logarithmic scale for lead concentration. Laboratory results presented include some estimated values between the Method Detection Limit (1.1 µg L−1) and the Reporting Limit (15 µg L−1).
Additional metals (e.g., aluminum, nickel, cadmium, chromium) were analyzed; however, because most results were at or below the laboratory reporting limit, the authors were not able to evaluate whether or not the metals were being removed by the POU filters (see Tables S2 and S3 in Supplemental Information).
Previous tap water sampling efforts[Citation31] indicated correlations between lead and other metals (e.g., aluminum) were present in Flint tap water. Lead and galvanized iron pipe scales from water systems using alum as a coagulant have contained high levels of aluminum, zinc, iron, and manganese.[Citation7,Citation48] Iron corrosion scales have an affinity to bind other metals, such as lead, from drinking water,[Citation14,Citation49] so particles can often contain elevated levels of multiple metals. Although no correlations could be found between lead and other metals (copper, zinc, iron, manganese) in unfiltered water samples, there are some examples of high lead co-occurring with higher levels of other metals. For example, in this work, one unfiltered sample, which contained 1,100 µg L−1 lead, also contained 1,000 µg L−1 aluminum, 2,200 µg L−1 copper, 110,000 µg L−1 iron, 430 µg L−1 manganese, and 1,900 µg L−1 zinc. The filtered water sample subsequently collected at this site contained much lower levels of lead (<0.5 µg L−1) and other metals including aluminum (<200 µg L−1), copper (<5 µg L−1), iron (<100 µg L−1), manganese (<15 µg L−1), and zinc (<50 µg L−1).
Conclusion
Given the sporadic nature of lead release, especially from LSLs and associated galvanized iron pipes, a reliable means of reducing lead in drinking water is needed by homeowners, especially for susceptible populations such as bottle-fed infants, young children, and pregnant women.
In this field investigation in Flint, MI, faucet-mounted POU filters concurrently certified under NSF/ANSI-53 (total lead) and NSF/ANSI 42 (Class I particulate) were shown by this study under particularly challenging lead and scale release conditions to be a robust approach that consistently achieved lead levels at or below the 1 µg L−1 concentration in tap water that was recommended by AAP (2016).[Citation5] This study demonstrated the removal of a combination of soluble and particulate lead from concentrations much greater than the 150 µg L−1 certification challenge concentration, to well below the current 10 µg L−1 certification acceptance criterion. Therefore, properly certified, installed, and maintained filters can be expected to reliably reduce lead exposure from drinking water, even when high lead levels (in excess of 1,000 µg L−1) are present in unfiltered water. The City of Washington, D.C. has also reported that testing of POU filters indicated consistent lead levels at or below 1 µg L−1 in filtered tap water.[Citation50]
Faucet-mounted POU devices can be an important and reliable barrier against unpredictable lead release from LSLs and interior plumbing materials by reducing lead in drinking water to levels that would not result in a significant increase in overall lead exposure.[Citation51] Other state and local agencies beyond Flint have recommended the use of NSF/ANSI-53 certified lead-removal POU filters in certain cases, especially by bottle-fed infants, young children, and pregnant women.[Citation39,Citation52–54]
To ensure effectiveness and safety, POU filters should be maintained and replaced in accordance with manufacturer recommendations. For example, only cold water should be run through the POU filter media.[Citation55] Recent attention to bacterial growth on POU filters[Citation56] has cast doubts in Flint and elsewhere regarding POU filter usage. However, previous studies demonstrated regrowth of heterotrophic bacteria in building plumbing, including POU devices, and that drinking this water does not constitute a significant health risk to healthy adults and children when the entry water meets acceptable water microbial quality norms.[Citation57–63] Manufacturers recommend running water through the POU filter for 5 s before using the water for drinking or cooking; and several studies have confirmed that flushing the water for 30 s or more can significantly decrease bacterial counts in the filter effluent.[Citation56,Citation60]
The findings of this study only apply to the use of an appropriate POU filter that is certified to remove the contaminant of concern (e.g., lead).[Citation64] Using “whole house” or point-of-entry devices for lead removal rather than certified POU devices, can cause problematic water quality changes, including removal of chlorine, that can increase bacteriological risk and increase lead release from premise plumbing after the ‘whole house’ or point-of-entry filter.[Citation40,Citation65–67] Specific required package labeling and literature, required for certified products, can help the consumer select a product that will meet their needs. For a lead reducing filter, the certification seal and conformance statement on the packaging should indicate that the product was tested and certified against NSF/ANSI Standard 53 and NSF/ANSI Standard 42 for the claims specified on the performance data sheet. The performance data sheet, which is inside the package but also available online or by contacting the company, should be reviewed to check the product removes lead and fine particulate material (Class I, 0.5 to 1 micron), as well as any other specific contaminants of concern.
While this study verified the ability of some appropriately certified commercially-available POU devices to effectively remove lead to very low concentrations under challenging water chemistry conditions, some additional research seems to be warranted. This study tested devices only with a tap water using free chlorine as a secondary disinfectant. Many of the faucet-mounted POU devices for which this study is applicable contain some form of activated carbon, and many devices are also certified to concurrently remove both free and combined chlorine along with the lead. Reduction of chloramine by GAC is well-known.[Citation68] As a result, the acclimation of nitrifying bacteria with time in some waters creates the potential for nitrite generation. Recently, this phenomenon has been reported in another study of tap water POU filters that have some similarities to the devices tested in this study.[Citation69] In that study reported by Alfredo and Lin (2018), larger filters were used that stay in place for one year, unlike the smaller filter cartridges containing some form of GAC that homeowners might install on a faucet and change every few months.
We have not located any published research reports showing nitrite formation occurring in residential end-of-tap carbon block or mixed media POU filters in chloraminating systems. But, it is definitely an important public health question, and more research needs to be done to confirm or discount this potential complication for different devices in general usage across all water chemistries.
Supplemental Material
Download MS Word (63.9 KB)Acknowledgments
The authors thank residents of Flint who participated in the study, the EPA Chicago Regional Laboratory as well as EPA personnel involved in field sampling, data management, data quality assurance, data visualization & GIS, and the Flint Drinking Water Technical Support Team (formerly known as “EPA Flint Task Force”). The authors appreciate helpful input and clarifications from the Agency for Toxic Substances and Disease Registry (ATSDR), particularly Mark Johnson, and from the Water Quality Association, particularly Eric Yeggy. Furthermore, the authors thank Kelly Cahalan, formerly with the Oak Ridge Associated Universities, for support early in the manuscript development, as well as EPA internal reviewers including Matt Alexander and Rita Bair for helpful feedback on the manuscript. Any opinions expressed in this article are those of the author(s) and do not, necessarily, reflect the official positions and policies of the EPA. Any opinions expressed in this article are those of the author(s) and do not, necessarily, reflect the official positions and policies of the EPA. Any mention of products or trade names does not constitute recommendation for use by the EPA.
References
- WQA Consumer Opinion Studies; Lisle, IL: Water Quality Association; 2015. https://www.wqa.org/programs-services/resources/consumer-opinion-studies (accessed Oct 24 2017).
- Centers for Disease Control and Prevention. What Do Parents Need to Know to Protect Their Children? https://www.cdc.gov/nceh/lead/acclpp/blood_lead_levels.htm (Accessed Apr 15, 2019)
- Levallois, P.; St-Laurent, J.; Gauvin, D.; Courteau, M.; Prévost, M.; Campagna, C.; Lemieux, F.; Nour, S.; D'Amour, M.; Rasmussen, P. E. The Impact of Drinking Water, Indoor Dust and Paint on Blood Lead Levels of Children Aged 1 − 5 Years in Montreal (Quebec, Canada). J. Expo. Sci. Environ. Epidemiol. 2014, 24, 185–191. DOI: 10.1038/jes.2012.129.
- Lanphear, B. P.; Hornung, R.; Khoury, J.; Yolton, K.; Baghurst, P.; Bellinger, D. C.; Canfield, R. L.; Dietrich, K. N.; Bornschein, R.; Greene, T.; et al. Low-Level Environmental Lead Exposure and Children’s Intellectual Function: An International Pooled Analysis. Environ. Health Perspect. 2005, 113, 894–899. DOI: 10.1289/ehp.7688.
- AAP. Policy Statement: Prevention of Childhood Lead Toxicity. Pediatrics 2016, 138, e20161493. American Association of Pediatrics (AAP), Council on Environmental Health. http://pediatrics.aappublications.org/content/pediatrics/early/2016/06/16/peds.2016-1493.full.pdf [Accessed 2/14/2019]
- Lanphear, B. P.; Rauch, S.; Auinger, P.; Allen, R. W.; Hornung, R. W. Low-Level Lead Exposure and Mortality in US Adults: A Population-Based Cohort Study. Lancet Public Health 2018, 3, e177–e184.
- Sandvig, A.; Kwan, P.; Kirmeyer, G.; Maynard, B.; Mast, D.; Trussell, R. R.; Trussel, S.; Cantor, A.; Prescott, A. Contribution of Service Line and Plumbing Fixtures to Lead and Copper Rule Compliance Issues, AWWA Research Foundation; 2008.
- Cartier, C.; Laroche, L.; Deshommes, E.; Nour, S.; Richard, G.; Edwards, M.; Prévost, M. Investigating Dissolved Lead at the Tap Using Various Sampling Protocols. J. AWWA 2011, 103, 55–67. DOI: 10.1002/j.1551-8833.2011.tb11420.x.
- EPA. Final Regulatory Impact Analysis of National Primary Drinking Water Regulations for Lead and Copper (1991.W.91.E.A); EPA: Washington, D.C., 1991.
- Cornwell, D. A.; Brown, R. A.; Via, S. H. National Survey of Lead Service Line Occurrence. Jawwa. 2016, 108, E182–E191. DOI: 10.5942/jawwa.2016.108.0086.
- AWWARF. Lead Control Strategies; AWWA Research Foundation and AWWA: Denver, CO, 1990.
- Schock, M. R. Causes of Temporal Variability of Lead in Domestic Plumbing Systems. Environ. Monit. Assess. 1990, 15, 59–82. DOI: 10.1007/BF00454749.
- Subramanian, K. S.; Sastri, V. S.; Elboujdaini, M.; Connor, J. W.; Davey, A. B. C. Water Contamination: Impact of Tin-Lead Solder. Water Res. 1995, 29, 1827–1836. DOI: 10.1016/0043-1354(95)00005-6.
- HDR Engineering. An Analysis of the Correlation between Lead Released from Galvanized Iron Piping and the Contents of Lead in Drinking Water. Prepared for the District of Columbia Water and Sewer Authority. September 2009.
- Triantafyllidou, S.; Parks, J.; Edwards, M. Lead Particles in Potable Water. Journal AWWA 2007, 99, 107–117. DOI: 10.1002/j.1551-8833.2007.tb07959.x.
- Schock, M. R.; Lytle, D. A. Internal Corrosion and Deposition Control. In: Water Quality and Treatment: A Handbook of Community Water Supplies, 6th ed.; Edzwald, J.K., Ed.; McGraw-Hill, Inc.: New York, 2011.
- Del Toral, M. A.; Porter, A.; Schock, M. Detection and Evaluation of Elevated Lead Release from Service Lines: A Field Study. Environ. Sci. Technol. 2013, 47, 9300–9307. DOI: 10.1021/es4003636.
- Lewis, C. M.; Couillard, L. A.; Klappa, P. J.; Vandenbush, T. D. Lead Water Service Lines: Extensive Sampling and Field Protocol Protect Public Health. Jawwa. 2017, 109, 34–41. DOI: 10.5942/jawwa.2017.109.0016.
- Kim, E. J.; Herrera, J. E. Characteristics of Lead Corrosion Scales Formed during Drinking Water Distribution and Their Potential Influence on the Release of Lead and Other Contaminants. Environ. Sci. Technol. 2010, 44, 6054–6061. DOI: 10.1021/es101328u.
- Deshommes, E.; Laroche, L.; Deveau, D.; Nour, S.; Prévost, M. Short- and Long-Term Lead Release after Partial Lead Service Line Replacements in a Metropolitan Water Distribution System. Environ. Sci. Technol. 2017, 51, 9507–9515. DOI: 10.1021/acs.est.7b01720.
- Korshin, G. V.; Ferguson, J. F.; Lancaster, A. N. Influence of Natural Organic Matter on the Morphology of Corroding Lead Surfaces and Behavior of Lead-Containing Particles. Water Res. 2005, 39, 811–818. DOI: 10.1016/j.watres.2004.12.009.
- OSHA (Occupational Safety and Health Administration). Substance data sheet for occupational exposure to lead. Appendix A to 29 CFR 1910.1025 [56 FR 24686, May 31, 1991] https://www.osha.gov/pls/oshaweb/owadisp.show_document?p_table=STANDARDS&p_id=10031 (accessed Jun 19, 2018).
- EPA. Basic Information about Lead in Drinking Water, 2019. https://www.epa.gov/ground-water-and-drinking-water/basic-information-about-lead-drinking-water (accessed Apr 16, 2019).
- Davis, M. M.; Kolb, C.; Reynolds, L.; Rothstein, E.; Sikkema, K. Flint Water Advisory Task Force: Final Report, Office of Governor Rick Snyder, State of Michigan, Lansing, MI. 2016 https://www.michigan.gov/documents/snyder/FWATF_FINAL_REPORT_21March2016_517805_7.pdf (accessed Feb 28, 2018).
- Roy, S. Why is it possible that Flint River water cannot be treated to meet Federal Standards? 2015. Retrieved from https://www.flintwaterstudy.org.
- Torrice, M. How Lead Ended up in Flint’s Tap Water. C&E News 2016, 94, 26–29.
- Hanna-Attisha, M.; LaChance, J.; Sadler, R. C.; Champney Schnepp, A. Elevated Blood Lead Levels in Children Associated with the Flint Drinking Water Crisis: A Spatial Analysis of Risk and Public Health Response. Am. J. Public Health 2016, 106, 283–290. DOI: 10.2105/AJPH.2015.303003.
- MDEQ. Summary of Flint Response Activities. 2016. https://www.michigan.gov/documents/flintwater/DEQ_and_Partner_Response_to_Flint_Water_Crisis_062316_527365_7.pdf
- Concerned Pastor for Social Action, Melissa Mays, Natural Resources Defense Council, and American Civil Liberties Union of Michigan versus the State of Michigan, MDEQ, and the City of Flint. Settlement Agreement. Filed March 27, 2017, https://www.michigan.gov/documents/flintwater/Settlement_Agreement_dated_032717_580103_7.pdf
- MDEQ. Taking Action on Flint Water: Testing Results. Michigan Department of Environmental Quality. Lansing, Michigan, 2017. http://www.michigan.gov/flintwater (accessed 18 Sept 2017).
- EPA. Memorandum: Final Report - High Lead at Three Residences in Flint, Michigan, Transmittal to MDEQ and City of Flint. November 4, 2015. Final Report - High Lead at Three Residences in Flint, Michigan (PDF) (accessed Feb 28, 2018).
- Dolan, M. “EPA: High lead levels in Flint exceed filters’ rating.” Detroit Free Press. January 29, 2016. http://www.freep.com/story/news/local/michigan/flint-water-crisis/2016/01/29/epa-high-lead-levels-flint-exceed-filters-ability/79540740/
- Emery, A. “Some Flint homes still show lead too high for water filters.” MLive. February 4, 2016. http://www.mlive.com/news/flint/index.ssf/2016/02/some_flint_homes_still_show_le.html
- Karoub, J. “DHHS: Flint lead levels too high for filters.” The Associated Press, 2016. http://www.pressherald.com/2016/01/29/dhhs-flint-lead-levels-too-high-for-filters/
- GCMS (Genesee County Medical Society). Press Release: GCMS Recommendation regarding Flint Municipal Water. June 29, 2016. https://flintcares.com/water-2/.
- NSF International. Drinking Water Treatment Units- Health Effects (NSF/ANSI 53-2018); NSF International, Ann Arbor, MI, 2018a.
- NSF International. Drinking Water Treatment Units - Aesthetic Effects (NSF/ANSI 42-2018; NSF International: Ann Arbor, MI, 2018b.
- Schock, M. R.; Wagner, I.; Oliphant, R. The Corrosion and Solubility of Lead in Drinking Water. In Internal Corrosion of Water Distribution Systems, 2nd ed.; AWWA Research Foundation/DVGW Forschungsstelle: Denver, CO, 1996; pp. 131–230.
- Deshommes, E.; Zhang, Y.; Gendron, K.; Sauvé, S.; Edwards, M.; Nour, S.; Prévost, M. Lead Removal from Tap Water Using POU Devices. J. AWWA 2010, 102, 91–105. DOI: 10.1002/j.1551-8833.2010.tb10210.x.
- Deshommes, E.; Nour, S.; Richer, B.; Cartier, C.; Prévost, M. POU Devices in Large Buildings: Lead Removal and Water Quality. J. AWWA 2012, 104, E282–E297. DOI: 10.5942/jawwa.2012.104.0058.
- EPA. Flint Sampling Support Quality Assurance Project Plan, 2017. https://www.epa.gov/flint/flint-water-sampling-objectives (accessed Feb 28 2018).
- PUR® Faucet Filtration System Owner’s Manual – Classic. 2017a. https://www.pur.com/faucet-filtration-systems/pur-classic-faucet-filtration-system (accessed Aug 31, 2018).
- PUR® Faucet Filtration System Owner’s Manual – Basic & Advanced. 2017b. https://www.pur.com/faucet-filtration-systems/pur-basic-faucet-filtration-system (accessed Aug 31, 2018).
- Brita® Water Filtration Systems. FF-100 User’s Guide. February 7, 2018. https://www.brita.com/wp-content/uploads/19329000.023_BRT_CBI_FF-100_UsersGuide_R9_i01_Complete.pdf [Accessed 8/31/2018].
- Brita® Water Filtration Systems. SAFF-100 User’s Guide. https://www.brita.com/wp-content/uploads/19329000.024_BRT_BC_SAFF-100_UsersGuide_R9_i01_16-03-18-1137_Basic.pdf (accessed Aug 31, 2018).
- Vaccari, D. A. Spatial Distribution of Lead in Plumbing Systems, Proceedings AWWA Annual Conference and Exposition, pp. 785–795, New York, June 19–23, 1994.
- Schock, M. R.; Hyland, R. N.; Welch, M. M. Occurrence of Contaminant Accumulation in Lead Pipe Scales from Domestic Drinking-Water Distribution Systems. Environ. Sci. Technol. 2008, 42, 4285–4291. DOI: 10.1021/es702488v.
- Wasserstrom, L. W.; Miller, S. A.; Triantafyllidou, S.; DeSantis, M. K.; Schock, M. R. Scale Formation under Blended Phosphate Treatment for a Utility with Lead Pipes. JAWWA 2017, 109, E464–E478. DOI: 10.5942/jawwa.2017.109.0121.
- McFadden, M.; Giani, R.; Kwan, P.; Reiber, S. Contributions to Drinking Water Lead from Galvanized Iron Corrosion Scales. J. AWWA 2011, 103, 76. DOI: 10.1002/j.1551-8833.2011.tb11437.x.
- Government of the District of Columbia (D.C.). Department of General Services, 2017. Initial Water Filtration Testing Protocol. dgs.dc.gov/sites/default/files/dc/sites/dgs/publication/attachments/Initial%20Water%20Filtration%20Testing%20Protocol%203.20.2017.pdf.
- ATSDR. Letter from ATSDR Director Patrick Breysse to EPA Administrator McCarthy. June 22, 2016. https://www.epa.gov/sites/production/files/2016-06/documents/filter_challenge_assesment_field_report_-_epa_v5.pdf (accessed Feb 28 2018).
- Ohio EPA. Ohio Administrative Code (OAC) 3745-81-84. Published April 16, 2018. Effective May 1, 2018. http://www.epa.ohio.gov/ddagw/rules#112025079-chapter-3745-81-primary-drinking-water-standards
- MHD. Drinking Water Filter Program. Milwaukee Health Department, Milwaukee, Wisconsin, 2017. http://city.milwaukee.gov/health/disease-Control-and-Environment/Drinking-Water/Drinking-Water-Filter-Program.htm (accessed Sept 18, 2017).
- Edwards, M.; Triantafyllidou, S.; Best, D. Elevated Blood Lead Levels in Young Children Due to Lead-Contaminated Drinking Water: Washington, DC, 2001–2004. Environ. Sci. Technol. 2009, 43, 1618. DOI: 10.1021/es802789w.
- DeSilva, F. Activated Carbon Filtration. Water Quality Products Magazine, 2000. www.watertreatmentguide.com/activated_carbon_filtration.htm (accessed Aug 7, 2017).
- Love, N. Point-of-Use Devices and Biofilms. Presented at 14th Annual EPA Drinking Water Workshop: Small Systems Challenges and Solutions. Aug 22, 2017.
- Fiore, J. V.; Babineau, R. A. Effect of an Activated Carbon Filter on the Microbial Quality of Water. Appl. Environ. Microbiol. 1977, 34, 541–546.
- Reasoner, D. J.; Blannon, J. C.; Geldreich, E. E. Microbiological Characteristics of Third-Faucet Point-of-Use Devices. J. AWWA 1987, 79, 60–66. DOI: 10.1002/j.1551-8833.1987.tb02925.x.
- Bell, F.; Perry, D.; Smith, J.; Lynch, S. Studies on Home Treatment Systems. J. AWWA 1984, 76, 126–130. DOI: 10.1002/j.1551-8833.1984.tb05312.x.
- Calderon, R. L.; Mood, E. W. Bacteria Colonizing Point-of-Use, Granular Activated Carbon Filters and their Relationship to Human Health. Yale School of Medicine, Report to US Environmental Protection Agency, 1988, CR-811904-01-0.
- Calderon, R. L. Bacterial colonizing point-of-entry, granular activated carbon filters and their relationship to human health. Yale School of Medicine, Report to US Environmental Protection Agency, 1991, CR-811904-01-0.
- WHO. Heterotrophic Plate Count Measurement in Drinking Water Safety Management. 2002 World Health Organization Conference Proceedings. World Health Organization. Geneva, Switzerland, 2002.
- EPA. Point-of-Use or Point-of-Entry Treatment Options for Small Drinking Water Systems. Washington D.C., Office of Water. U.S. Environmental Protection Agency, 2006.
- US Environmental Protection Agency. A Consumer Tool for Identifying Point of Use (POU) Drinking Water Filters Certified to Reduce Lead, EPA/600/F-18/335 U. S. Environmental Protection Agency, Office of Research and Development: Washington, DC, 2018. https://www.epa.gov/sites/production/files/2018-12/documents/consumer_tool_for_identifying_drinking_water_filters_certified_to_reduce_lead.pdf
- Zhang, Y.; Triantafyllidou, S.; Edwards, M. Effect of Nitrification and GAC Filtration on Copper and Lead Leaching in Home Plumbing Systems. J. Environ. Eng. 2008, 134, 521. DOI: 10.1061/(ASCE)0733-9372(2008)134:7(521).
- Boyd, G. R.; Pierson, G. L.; Kirmeyer, G. J.; English, R. J. Lead Variability Testing in Seattle Public Schools. J. AWWA 2008, 100, 53. DOI: 10.1002/j.1551-8833.2008.tb08142.x.
- Shrestha, J.; Li, J. Influence of Permeate from Domestic Reverse Osmosis Filters on Lead Pipes Corrosion and Plastic Pipes Leaching. J. Water Process Eng. 2017, 18, 126–133. DOI: 10.1016/j.jwpe.2017.06.007.
- Fairey, J. L.; Speitel, G. E. J.; Katz, L. E. Monochloramine Destruction by GAC—Effect of Activated Carbon Type and Source Water Characteristics. J. AWWA 2007, 99, 110–120. DOI: 10.1002/j.1551-8833.2007.tb07985.x.
- Alfredo, K.; Lin, J. To Filter or Not to Filter, Proc. AWWA Water Quality Technology Conference, Toronto, ON, November 11–14, 2018.