Abstract
Subway systems are considered as main public transportation facility in developed countries. Time spent by people in indoors, such as underground spaces, subway stations, and indoor buildings, has gradually increased in the recent past. Especially, operators or old persons who stay in indoor environments more than 15 hr per day usually influenced a greater extent by indoor air pollutants. Hence, regulations on indoor air pollutants are needed to ensure good health of people. Therefore, in this study, a new cumulative calculation method for the estimation of total amounts of indoor air pollutants emitted inside the subway station is proposed by taking cumulative amounts of indoor air pollutants based on integration concept. Minimum concentration of individual air pollutants which naturally exist in indoor space is referred as base concentration of air pollutants and can be found from the data collected. After subtracting the value of base concentration from data point of each data set of indoor air pollutant, the primary quantity of emitted air pollutant is calculated. After integration is carried out with these values, adding the base concentration to the integration quantity gives the total amount of indoor air pollutant emitted. Moreover, the values of new index for cumulative indoor air quality obtained for 1 day are calculated using the values of cumulative air quality index (CAI). Cumulative comprehensive indoor air quality index (CCIAI) is also proposed to compare the values of cumulative concentrations of indoor air pollutants. From the results, it is clear that the cumulative assessment approach of indoor air quality (IAQ) is useful for monitoring the values of total amounts of indoor air pollutants emitted, in case of exposure to indoor air pollutants for a long time. Also, the values of CCIAI are influenced more by the values of concentration of NO2, which is released due to the use of air conditioners and combustion of the fuel. The results obtained in this study confirm that the proposed method can be applied to monitor total amounts of indoor air pollutants emitted, inside apartments and hospitals as well.
Nowadays, subway systems are considered as main public transportation facility in developed countries. Time spent by people in indoors, such as underground spaces, subway stations, and indoor buildings, has gradually increased in the recent past. Especially, operators or old persons who stay in the indoor environments more than 15 hr per day usually influenced a greater extent by indoor air pollutants. Hence, regulations on indoor air pollutants are needed to ensure good health of people. Therefore, this paper presents a new methodology for monitoring and assessing total amounts of indoor air pollutants emitted inside underground spaces and subway stations. A new methodology for the calculation of cumulative amounts of indoor air pollutants based on integration concept is proposed. The results suggest that the cumulative assessment approach of IAQ is useful for monitoring the values of total amounts of indoor air pollutants, if indoor air pollutants accumulated for a long time, especially NO2 pollutants. The results obtained here confirm that the proposed method can be applied to monitor total amounts of indoor air pollutants emitted, inside apartments and hospitals as well.
Introduction
Subway stations are currently operated as 9 lines in urban areas in Korea, and about 6 million passengers per day in the metropolitan area use and spend considerable time in subway stations. So, subway station is one of the main public transportation facilities and the social concern has also increased on the indoor air pollution in subway stations. Due to high retention time and usage by large number of people, the amounts of indoor air pollutants increase inside subway stations. Thus, the people who stay in subway stations and in indoor buildings for a long time are exposed to high amounts of indoor air pollutants. Therefore, the Korea Ministry of Environment (MOE) has tried to manage air quality in subway stations by imposing stringent laws and regulations (CitationKim et al., 1994). The MOE has established the Indoor Air Quality (IAQ) Act in an attempt to control major pollutants, including PM10 (particulate matter with aerodynamic diameters <10 μm), carbon dioxide (CO2), carbon monoxide (CO), VOCs (volatile organic compounds), and formaldehyde, in indoor environments such as subway platforms (CitationKim et al., 2010a; CitationTodorovic and Kim, 2012).
Recently, some studies (CitationNiu and Burnett, 2001; CitationPark and Ha, 2008; CitationChuck and Kim, 2012) on regulation of IAQ in underground subway stations (including the monitoring and control of IAQ) have been reported. CitationNiu and Burnett (2001) have compared the different regulation methods for indoor air pollutants and have proposed comprehensive standards for emission levels of the indoor air pollutants. CitationPark and Ha (2008) have monitored the levels of particulate matters and CO2 in the underground subway station platforms and compared the concentrations at different monitoring locations. But the emission of indoor air pollutants in the real underground subway stations is not being monitored till to date and the quantitative standards for emission levels of indoor air pollutants have not been established well (CitationBernstein et al., 2008; CitationKim, 2012). This necessitates the monitoring of indoor air pollutant levels cumulatively in real underground subway stations to ensure good health for the people. Hence, the development of cumulative monitoring methods for indoor air pollutants is the central theme of the present study.
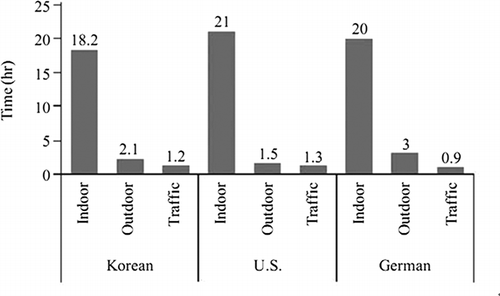
shows that the time spent by people of different developed countries is higher in indoors such as subway stations and indoor buildings than the outdoors. Especially, operators who stay in the subway stations more than 15 hr a day usually influenced a greater extent by indoor air pollutants. Also, if children and old and infirm persons are exposed to indoor air pollutants such as particulate matters for a long time, they are strongly influenced by these air pollutants. In such situations, cumulative indoor air quality index, which is measured for 24 hr, is more suitable than the standards set for short time, such as hourly standards. Therefore, there is a need for cumulative comprehensive indoor air quality index that can be used for 24 hr. The regulations on total amounts of outdoor air pollutants has already been brought into effect since 1 July 2007 in the capital area in Korea to reduce the air pollutants (CitationSeo, 2008). However, regulations on total amounts of indoor air pollutants have not been established yet. There is a lack of research on the estimation of total amounts of indoor air pollutants emitted inside subway stations and indoor buildings. Thus, a new cumulative calculation method for the estimation of total amounts of indoor air pollutants emitted is needed by taking cumulative amounts of indoor air pollutants.
Figure 1. Comparison of times spent by people of different developed countries in different environments.
Therefore, in this study, a new cumulative calculation method for the estimation of total amounts of indoor air pollutants emitted inside subway stations, by taking cumulative amounts of indoor air pollutants, is proposed based on integration concept. A new index for cumulative indoor air quality for long time periods, such as 1 day, is also suggested using the values of comprehensive air quality index (CAI). So, results for cumulative amounts of indoor air pollutants in subway stations are represented with cumulative comprehensive indoor air quality index to easily understand air quality for 1 yr.
Materials and Methods
Data set
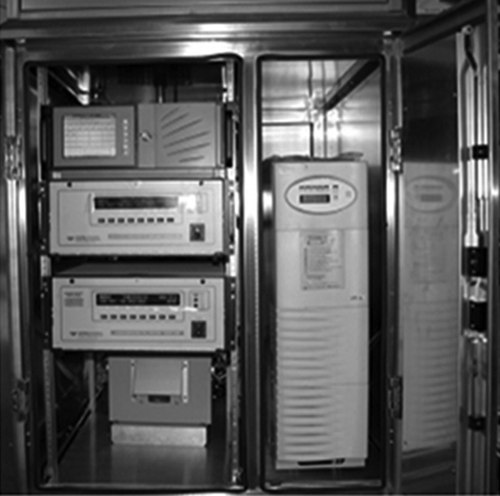
The proposed method is applied to the measured indoor air data from a subway station. The data are gathered by collecting hourly samples from D-subway station, Seoul Metro, for a period of 1 yr from January to December 2009. Tele-monitoring systems (TMS) were installed properly in Korean subway stations for the management of indoor air quality. TMS data measured by sensors in a domestic station are used for multivariate data analysis of indoor air quality (IAQ). presents TMS in a subway station. The TMS are located at the center of the subway platforms and measured the concentration levels of seven air pollutants. In this study, the data set collected in the subway station consist of (1) hourly averaged concentrations of NO, NO2, NOx, PM10, PM2.5, CO, and CO2; and (2) two meteorological parameters, namely, temperature and humidity (CitationKim et al., 1994, 2010). And then, the outliers detected in the data set are eliminated based on ±5% lower and upper bounds.
Figure 2. TMS in a subway station.
Indoor air pollutants
Since many people spend considerable time in indoor environment, the concern on indoor air quality has increased as well as the concern on ambient air quality. According to the EC (European Commission) directive on ambient air quality assessment and management, ozone (O3), nitrogen dioxide (NO2), sulfur dioxide (SO2), carbon monoxide (CO), and PM (particulate matter) less than 10 μm in diameter (PM10) or less than 2.5 μm in diameter (PM2.5) are the target species of pollutants, due to their ill effects on human health and vegetation (CitationPandey et al., 2005). PM10 and PM2.5 are potentially toxic to humans and all living matters (CitationGallero et al., 2006). Although people are exposed to air pollutants in outdoor frequently, they could regain their health as soon as possible due to continued circulation and purification of air. However, since subway stations or indoor buildings are sealed in most cases, standards for indoor air quality should be stricter than the outdoors. Therefore, The Korea Ministry of Environment (MOE) has tried to manage air quality in subway stations by imposing stringent laws and regulations (CitationKim et al., 1994). The Korea MOE established Indoor Air Quality Control Act for Public Use Facilities, to control 10 major pollutants such as PM10, CO, formaldehyde (HCHO), total suspended particulate (TSP), CO, NO2, radon, VOC, asbestos, and ozone in indoor environments.
shows the specific information on the standards for air pollutants in indoor environments in Korea (CitationKim et al., 2011). Specifically, summarizes the details of average concentrations of indoor air pollutants, namely, NO2, PM10, CO, and CO2 obtained in D-subway station. The mean values of these pollutants are 0.043 ppm, 53.25 μg/m3, 1.49 ppm, and 501.98 ppm and the corresponding standards are 0.05 ppm, 150 μg/m3, 10 ppm, and 1000 ppm, respectively.
Table 1. Standards for indoor air pollutants in Korea (a) for maintenance and (b) for recommendation(9)
Table 2. Average NO2, PM10, CO, and CO2 concentrations obtained in indoor (D) subway station and the corresponding standards
Comprehensive air quality index (CAI)
Air quality index (AQI) was proposed by U.S. Environmental Protection Agency (EPA) in 1999 to protect the human health. In Korea, comprehensive air quality index (CAI) has also been suggested by MOE. To ensure proper air quality, CAI is developed by taking human risk and air quality standards into account. People can easily understand a real-time measured air quality using the values of CAI. shows the values of CAI, which are divided into six groups as Good, Moderate, Unhealthy for sensitive groups, Unhealthy, Very unhealthy, and Hazardous. CAI scores for each of the air pollutants are calculated using eq 1.
Table 3. Classification of values of comprehensive air quality indices of different air pollutants into six different groups (i.e., Good, Moderate, Unhealthy for sensitive groups, Unhealthy, Very unhealthy, and Hazardous)
where I P is the CAI score of each air pollutant, C P is the concentration of air pollutant, BPHI and BPLO are the upper and lower concentration bounds for a range of air pollutant, I HI and I LO are the mean indices corresponding to BPHI and BPLO (maximum and minimum indices of range). After calculating CAI scores for each air pollutant, the highest score among the five is used as the integrated index value (only one value). And if there are more than two indices in the “Unhealthy for sensitive groups,” the index with higher value receives more weightage. Hence, the integrated (one) index is calculated.
However, CAI is an index for outdoor air quality. As mentioned before, since subway stations are one of the main public transportation facilities and people reside in the indoor buildings for a long time, indices for indoor air quality are needed. So, comprehensive indoor air quality index (CIAI) is proposed along these lines by earlier studies (CitationKang et al., 2010). shows the classification of CIAI values into six different groups, as suggested by EPA for different pollutants. There is no regulation on the concentration of PM2.5 in Korea, unlike other developed countries. However, PM2.5 can lodge deep inside the lungs because of their small size (approximately 1/30th of the average width of a human hair) (CitationPark and Ha, 2008). Therefore, PM2.5 is also an important air pollutant, and there is a necessity for its inclusion in indoor air quality regulations of Korea.
Table 4. Classification of values of comprehensive indoor air quality indices of different air pollutants into six different groups (i.e., Good, Moderate, Unhealthy for sensitive groups, Unhealthy, Very unhealthy, and Hazardous) suggested by EPA
Total emission of indoor air pollutants
Korean Ministry of Environment (MOE) has applied national regulation standard for management of air pollutants, under the same conditions without reference to scale of production activity by method of concentration regulation (CitationKim et al., 2010b, Citation2011). In spite of reinforcement of ambient air standard, some pollutants exceeded ambient air standard locally and therefore necessity of total emission regulation is on the rise. So, in the capital area of Korea, the regulation on the total amount of air pollutants has gained increasing attention to reduce air pollutants. But the regulations on the total amount of indoor air pollutants have not been established yet. As mentioned before, if children and old and infirm persons are exposed to indoor air pollutants, such as PM10 and PM2.5 for a long time, they will be influenced a greater extent by indoor air pollutants. Especially, operators who stay at subway stations and indoor buildings will be influenced more critically than the common people. Hence, in this study, a new cumulative calculation method for the estimation of total amounts of air pollutants emitted is proposed by taking cumulative amounts of indoor air pollutants inside the subway station based on the integration concept.
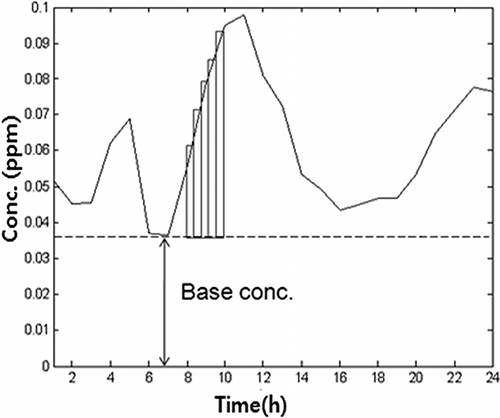
In fact, there is a base concentration exists for each indoor air pollutant, as the spatial characteristics of indoor environments, such as subway stations, are narrow and limited. For estimation of total amount indoor air pollutant using cumulative calculation method, air pollutants (1) entered through ventilation and (2) generated from the movements of people inside subway station are considered. The data set is organized as concentrations of seven air pollutants (NO, NO2, NOx, PM10, PM2.5, CO, and CO2) obtained for 1 yr, with samples collected at an interval of 1 hr. It is assumed that the lowest value among the values of data set of each indoor air pollutant is taken as base concentration for cumulative calculation method. shows the concept of newly developed cumulative calculation method for the estimation of total amounts of indoor air pollutants emitted. After subtracting the base concentration from the measured data set of each indoor air pollutant, the total emitted pollutant (TEP) inside a subway station is calculated by the following eq 2. TEP is the total amount of indoor air pollutant emitted inside a subway station.
Figure 3. Newly developed calculation method for the estimation of total amount of indoor air pollutant emitted.
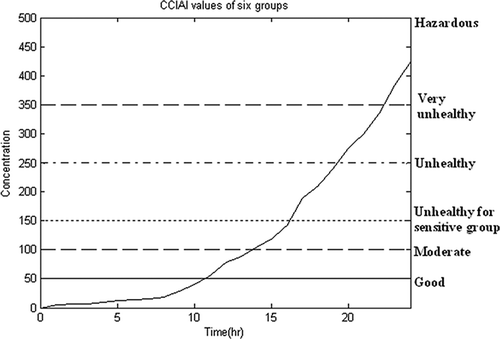
CAI and CIAI are commonly used as indices for air quality, which were suggested by EPA, in order to represent the standards of IAQ for short time periods, such as 1 hr. Hence, there is a need for cumulative comprehensive indoor air quality index for large time periods, such as 24 hr. Therefore, a new index, namely, cumulative comprehensive indoor air quality, is suggested to represent the total amounts of indoor air pollutants emitted. Cumulative comprehensive indoor air quality index (CCIAI) value for 1 day is calculated by multiplying CIAI value by 24. presents the values of CCIAI. Those are referred by EPA, and are also classified into six groups, similar to CAI. shows the classification of CCIAI values into six groups (Good, Moderate, Unhealthy for sensitive groups, Unhealthy, Very unhealthy, and Hazardous). The range for index score is from 0 to 500, which was set by U.S. EPA. Concentration that starts to affect sensitive groups is set as 100. Therefore, CCIAI values are the modified version of the standards of IAQ, which is applicable for Korea. As time goes on, the cumulative indoor air pollutants get piled up. If the cumulative indoor air quality index value belongs to Unhealthy class for sensitive groups, then it is judged as a sensitive air quality and, at that time, urgent control for indoor air quality is demanded. Therefore, in this study, the calculated values of total amounts of the indoor air pollutants are compared with CCIAI to easily check the indoor air quality in real time.
Table 5. Classification of values of cumulative comprehensive indoor air quality indices (CCIAI) of different air pollutants into six different groups (i.e., Good, Moderate, Unhealthy for sensitive groups, Unhealthy, Very unhealthy, and Hazardous)
Figure 4. Classification of CCIAI values into six groups (i.e., Good, Moderate, Unhealthy for sensitive groups, Unhealthy, Very unhealthy, and Hazardous).
Scheme of total emission of indoor air pollutants
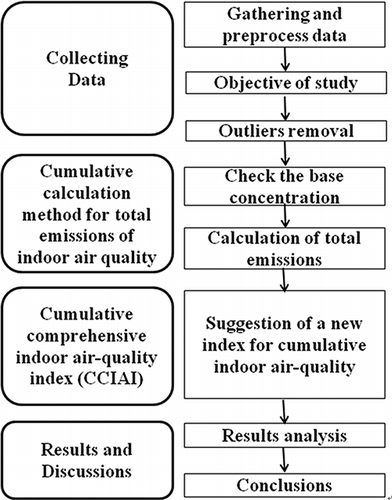
As mentioned above, regulations on total emission of indoor air pollutants are not established yet in Korea. Therefore, an appropriate method is necessary to analyze the indoor air quality, and to monitor the total emission of indoor air pollutants, according to the evaluated results. shows the scheme, which explains the overall process of calculating total amounts of indoor air pollutants emitted and the values of CCIAI. First, the measured data of indoor air pollutants in a subway station are collected and preprocessed. The second step is to check for outliers. Here, outlier is a measurement value that involves high variance due to measurement error. The third step is to calculate the total amounts of indoor air pollutants emitted in subway stations. In this step, total amounts of indoor air pollutants emitted are calculated by a new cumulative calculation method. The fourth step is to decide the new index for cumulative indoor air quality. In this step, cumulative comprehensive indoor air quality index (CCIAI) for 1 day is suggested. The final step is to compare the results of total emissions with the values of CCIAI. This concludes that the new cumulative calculation method and index are proposed for the benefit of the operators who stay in subway stations and indoor buildings for a long time.
Figure 5. Scheme to calculate total amounts of indoor air pollutants emitted in subway stations.
Results and Discussion
Analysis of hourly IAQ data
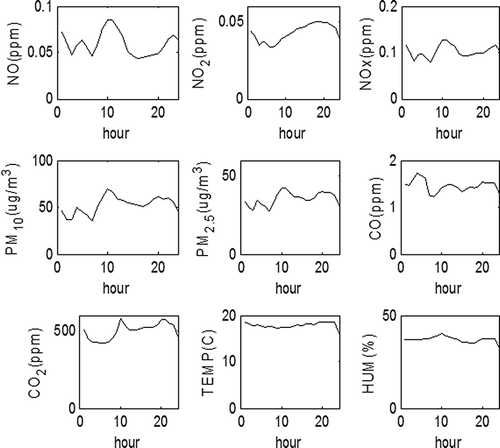
In this study, the data were collected from January to December 2009 with a sampling interval of 1 hr. The indoor air quality data involve the concentrations of seven air pollutants (NO, NO2, NOX, PM10, PM2.5, CO, and CO2) and two meteorological variables (temperature and humidity) (CitationKim et al., 2010). Hourly data of indoor air quality were obtained using TMS and were recorded, as shown in (CitationMarkovic et al., 2008). All pollutants show increasing trends and peaks during rush hours. The concentration patterns of NO, NOx, PM10, and PM2.5 are similar. Since the standards for NO2, PM10, PM2.5, CO, and CO2 (in the form of comprehensive indoor air quality indices) are available, hence, the remaining five indoor air pollutants are considered in this study. shows the values of CIA indices for NO2, PM10, CO, and CO2, which were obtained from D station. But, these data represent hourly data and standards. As mentioned above, if children and old and infirm persons, and especially operators who stay in subway stations more than 15 hr a day, are exposed to indoor air pollutants for a long time, they experience a strong influence of these indoor air pollutants. Therefore, as suggested in earlier sections, the data of total emissions of indoor air pollutants in real time are to be recorded.
Figure 6. Patterns of concentrations of NO, NO2, NOx, PM10, PM2.5, CO, CO2, temperature, and humidity obtained with a sampling time of 1 hr.
Cumulative indoor air quality
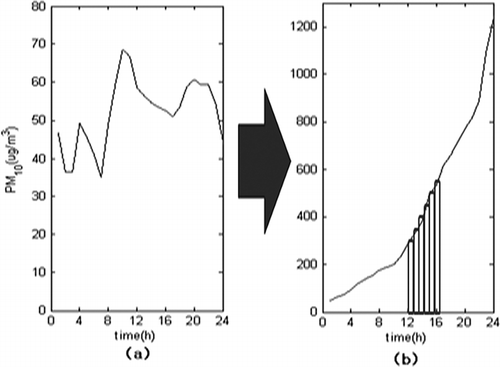
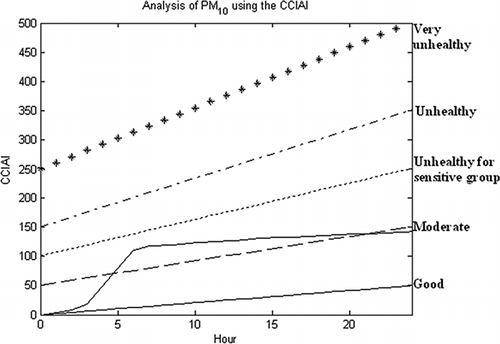
Base concentrations exist for each of indoor air pollutants. Thus, before going for the application of cumulative calculation method to calculate the total amounts of indoor air pollutants emitted in a subway station, the base concentration of each indoor air pollutant is subtracted from the measured data set of each pollutant. In this study, the lowest value among the values of data set of each air pollutant is selected as base concentration. Thus, the total amounts of each of the indoor air pollutants are calculated using the method suggested in Section 2.4. shows the graph of cumulative amount of PM10 (which is one among the nine variables monitored) for 24 hr, which is obtained by applying the cumulative calculation method to the hourly data.
Figure 7. The concentration data of PM10 obtained in D-subway station: (a) hourly average and (b) cumulative values obtained for 1 day.
shows the hourly data of PM10 obtained in a subway station for 1 day, which is represented as CIAI. According to hourly data of PM10 obtained for 1 day, the values of CIAI seem to lie in the region of “Unhealthy for sensitive groups” during the 3rd to 7th hours of the day. PM10 concentrations simultaneously increased during that time, which indicated that the starting hour of subway operation caused the increase in the emissions of the pollutants. If children and old and infirm persons are exposed to indoor air pollutants, such as PM10, then they will be influenced a greater extent by PM10. Control of PM10 is needed at that time in a subway station. Except in the morning, the hourly data of PM10 are lying in the range of ‘“Moderate” group and PM10 is almost constant. However, as mentioned earlier, the time spent by the people of developed countries has gradually increased in indoors than in outdoors such as subway stations and indoor buildings. In this case, cumulative calculation method for the estimation of total amounts of indoor air pollutants emitted and cumulative indoor air quality index obtained for 24 hr is more suitable than that for short time, such as hourly standards. shows cumulative concentration trend of PM10 obtained for 1 day inside a subway station, which is represented with the values of CCIAI. According to the cumulative data of 1 day, the values of CCIAI seem to lie in the region of “Unhealthy for sensitive groups” from the 5th hour. If children and old and infirm persons stay inside subway stations and indoor buildings, for a long time, they are influenced a large extent. Especially, operators who work for 24 hr inside subway stations will be influenced critically than common people. In case of exposure to indoor air pollutants for a long time, cumulative IAQ indices are more suitable to explain than those obtained based on hourly data. Therefore, cumulative calculation method for the estimation of total amounts of indoor air pollutants emitted in a subway station is needed.
Figure 8. Concentration data of PM10 obtained for 1 day, which is represented with the values of CIAI.
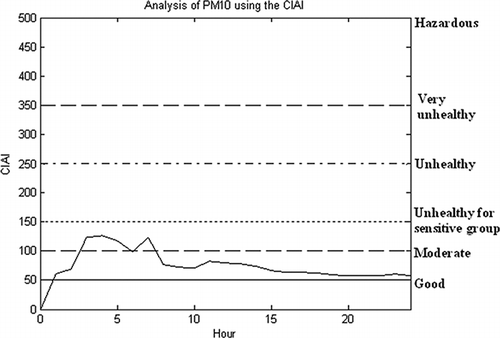
Figure 9. Cumulative concentration trend of PM10 obtained for 1 day, which is represented with the values of CCIAI.
Cumulative comprehensive indoor air quality index (CCIAI)
As time goes on, indoor air pollutants get accumulated in indoor environment and affect the people who reside or work for a long time in indoor buildings. It is necessary to supply some information, which is presented as cumulative data and standards. In this study, the measured data are presented as total amount of indoor air pollutant emitted based on integration concept. Also, a new index for cumulative indoor air quality, referred as values of CIA, is presented.
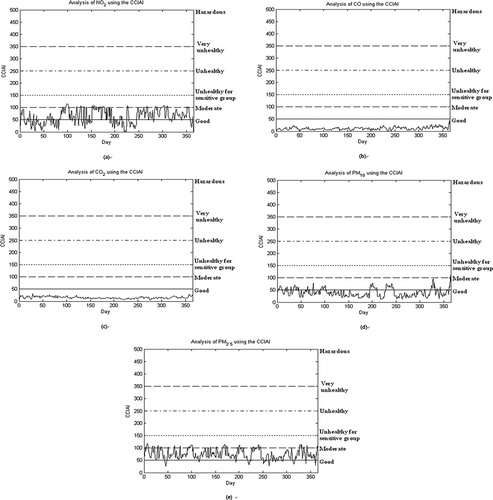
shows the variations of cumulated values (obtained for 24 hr) of concentrations of NO2, CO, CO2, PM10, and PM2.5 during 1-yr period in D-subway station. In , the cumulative values of NO2 are lying almost within the range of “Moderate” group. As it is seen from the figure, during certain time of the day, NO2 is in “Unhealthy for sensitive groups.” This is due to the release of NO2 during combustion of fuel to operate the subway (CitationRuiz et al., 2010; CitationRyan et al., 2008). The effects of fuel combustion and the indoor air used for heating must be taken into consideration as well (CitationJohn et al., 2004). Hence, adequate control is needed to reduce NO2. If the control of NO2 does not work adequately, this sensitive environment could cause the respiratory problems to the patients suffering with asthma, at concentration of 650 ppb over the duration of 3 hr (CitationVan Strien et al., 2004). and show the plots for cumulative values of CO and CO2 obtained for 1 yr. It is believed that CO emitted during the process of combustion is also considered, as is the case with NO2. The effects of outdoor air, gases released during the combustion process for the operation of subway, and the indoor air used for heating must be taken into consideration for estimation of CO2 emission as well (CitationKim et al., 2010a), since CO2 is a pollutant, which can cause respiratory problems, and its amount is related to the number of passengers. and also show that the cumulative CO and CO2 values obtained for 1 yr are within the range of “Good” group. By seeing the cumulative values of CO and CO2, it is confirmed that there is no risk for human beings inside D-subway station with respect to CO and CO2. The higher amounts of CO can impair the oxygen binding with hemoglobin, and in turn, causes headaches, nausea, dizziness, breathlessness, fatigue, and occasionally coma and death (CitationWeaver et al., 2002). In addition, since the carboxyhemoglobin (which is obtained by binding of CO with hemoglobin in blood) increases as the time progresses, continuous exposure to low concentrations of CO could also lead to considerable health effects. and show the cumulative values of PM10 and PM2.5 obtained for 1 yr. Concentrations of PM10 and PM2.5 are proportional to the quantity of dust, which is a result of outdoor air entering through the ventilation system and due to the movement of passengers. Recent studies (CitationDelfino, 2002; CitationOrmstad, 2000) on PMs of indoor showed that they contain large amounts of potential allergy carriers, and they could cause respiratory illness such as asthma. Especially, PM2.5 can lodge deeply into the lungs because of their small size. Thus, PM2.5, which is considered different from PM10, has also become the main indoor air pollutant recently. The cumulative values of PM10 obtained for 1 yr are almost lying within the range of “Moderate” group, whereas the cumulative values of PM2.5 are lying within the range of “Unhealthy for sensitive groups.” So, adequate control is needed to reduce it.
Figure 10. Cumulative concentration trends of (a) NO2, (b) CO, (c) CO2, (d) PM10, and (e) PM2.5 obtained for 1 yr.
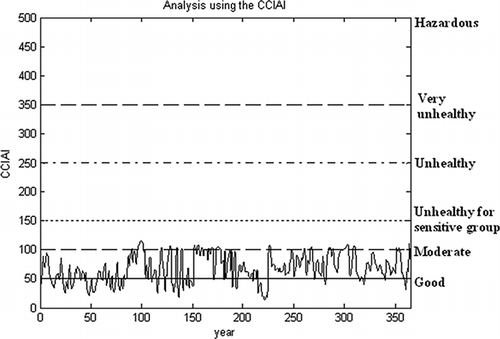
Through the cumulative calculation method for estimation of total amounts of indoor air pollutants emitted, cumulative values of NO2, CO, CO2, PM10, and PM2.5 obtained for 1 yr are presented in the form of cumulative indoor air quality index values. Then, these values of each indoor air pollutant are used for calculation of CAI values using eq 1. After finding out CAI values for each indoor air pollutant, the highest score among five CAI scores is used as integrated index value (only one value). If there are more than two indices that fall in “Unhealthy for sensitive groups,” the index with the highest value receives more weightage and then it is used as integrated index value. Through these steps, cumulative comprehensive indoor air quality index (CCIAI) values are obtained for five indoor air pollutants. shows the values of CCIAI obtained during 1 yr in D-subway station. It is almost lying within the range of “Moderate” group. But, few of the CCIAI values are lying in the range of “Unhealthy for sensitive groups.” For these reasons, it is confirmed that the values of CCIAI were influenced by high concentrations of PM2.5, which may be a result of yellow storm blown during spring. In summer and winter, CCIAI values were influenced by the high values of concentration of NO2, which is released due to the use of air conditioner and combustion of fuel. Taken as a whole, since the pattern of CCIAI is similar with NO2, it is believed that CCIAI was influenced more by NO2. Therefore, through the control of NO2, it is possible to improve the values of cumulative indoor air quality index inside subway stations.
Figure 11. Values of cumulative comprehensive indoor air quality index (CCIAI) obtained for 1 yr, integrated as one index.
Conclusions
The time spent by people in indoors, such as subway stations and indoor buildings, has gradually increased during the recent past. Especially, operators who stay in the subway stations more than 15 hr a day usually influenced a greater extent by indoor air pollutants. Therefore, in this study, a new cumulative calculation method for the estimation of amount of total emission by taking cumulative values of concentrations of indoor air pollutants inside the subway station, based on integration concept, is proposed. Moreover, a new index for cumulative indoor air quality for 1 day is obtained using the values of cumulative air quality index (CAI) and thus cumulative comprehensive indoor air quality index (CCIAI) are suggested for comparing the values of cumulative indoor air pollutants. The results confirmed that, in case of exposure to indoor air pollutants for a long time, cumulative IAQ values are more suitable than the hourly data. Also, the values of CCIAI (integrated index) are influenced more by the values of NO2. Therefore, this study can help to set a standard for evaluation of the risk level to the operators, who stay in subway stations and indoor buildings for 24 hr.
Acknowledgments
This work was supported by the National Research Foundation of Korea (NRF) grant, funded by the Korea government (MEST) (No. 2012-0000609).
References
- Bernstein , J.A. , Alexis , N. , Bacchus , H. , Bernstein , L. , Fritz , P. , Horner , E. , Li , N. , Mason , S. , Nel , A. , Oullette , J. , Reijula , K. , Reponen , T. , Seltzer , J. , Smith , A. and Tarlo , S.M. 2008 . The health effects of nonindustrial indoor air pollution . J. Allergy Clin. Immunol. , 212 : 585 – 591 .
- Chuck , W.F.Y. and Kim , J.T. 2012 . Sustainable developments for future building . Indoor and Built Environment , 21 : 3 – 4 .
- Delfino , R.J. 2002 . Epidemiologic evidence for asthma and exposure to air toxics: Linkages between occupational, indoor, and community air pollution research . Environ. Health Perspect. , 110 : 573 – 589 .
- Gallero , F.J.G. , Vallejo , M.G. , Umbria , A. and Baena , J.G. 2006 . Multivariate statistical analysis of meteorological and air pollution data in the campo De Gibraltar region Spain . Environ. Monit. Assess. , 119 : 405 – 423 .
- John , S. , Edward , J.W. , William , E.M. , Michael , B. , Daniel , M.B. and Andrew , S.W.A. 2004 . New method for the rapid determination of volatile organic compound breakthrough times for a sorbent at concentrations relevant to indoor air quality . J. Air Waste Manage. Assoc. , 54 : 105 – 110 .
- Kang , H.S. , Kim , S.J. , Kwak , E.S. and Kim , I.W. 2010 . A suggestion of the CIAI (comprehensive indoor air-quality index) for the air quality management in the subway station . Korean Soc. Atmos. Environ. , 5 : 329 – 330 .
- Kim , J.T . 2012 . Sustainable and healthy building . Energy and Buildings , 46 : 1 – 1 .
- Kim , D.S , Kim , S.D. , Kim , Y.S. , Shin , E.B. and Lee , T.J. 1994 . Quantitative determination of aerosol contribution in Seoul metropolitan subway stations . J. Korean Soc. Environ. Eng. , 16 : 309 – 319 .
- Kim , M.J. , Kim , Y.S. , Ataei , A. , Kim , J.T. , Kim , J.J. and Yoo , C.K. 2011 . Statistical evaluation of indoor air quality changes after installation of the PSD system in Seoul's metro . Indoor and Built Environ. , 20 : 187 – 197 .
- Kim , Y.S. , Kim , I.W. , Kim , J.C. and Yoo , C.K. 2010 . Multivariate monitoring and local interpretation of indoor air quality in Seoul's metro system . Environ. Eng. Sci , 27 : 721 – 731 .
- Kim , Y.S. , Kim , I.W. , Kim , J.C. and Yoo , C.K. 2010a . Multivariate statistical monitoring and local interpretation of indoor air quality in a subway station . Environ. Sci. Eng. , 27 : 901 – 911 .
- Kim , Y.S. , Kim , M.J. , Lim , J.J. , Kim , J.T. and Yoo , C.K. 2010b . Predictive monitoring and diagnosis of periodic air pollution in a subway station . J. Hazard. Mater. , 183 : 448 – 459 .
- Markovic , D.M. , Markovic , D.A. , Jovanovic , A. , Lazic , L. and Mijic , Z. 2008 . Determination of O3, NO2, SO2, CO and PM10 measured in Belgrade urban area . Environ. Monit. Assess. , 145 : 349 – 359 .
- Niu , J.L. and Burnett , J. 2001 . Setting up the criteria and credit-awarding scheme for building interior material selection to achieve better indoor air quality . Environ. Int. , 26 : 573 – 580 .
- Ormstad , H. 2000 . Suspended particulate matter in indoor air: Adjuvants and allergen carriers . Toxicology , 152 : 53 – 68 .
- Ruiz , P.A. , Claudia , T. , Jorge , C. , Gianni , L. , Pedro , O. and Petros , K. 2010 . Effect of gas and kerosene space heaters on indoor air quality: A study in homes of Santiago, Chile . J. Air Waste Manage. Assoc. , 60 : 98 – 108 . doi: 10.3155/1047-3289.60.1.98
- Pandey , J.S. , Kumar , R. and Devotta , S. 2005 . Health risks of NO2, SPM and SO2 in Delhi (India) . Atmos. Environ. , 39 : 6868 – 6874 .
- Park , D.U. and Ha , K.C. 2008 . Characteristics of PM10, PM2.5, CO2 and CO monitored in interiors and platforms of subway train in Seoul, Korea . Environ. Int. , 34 : 629 – 634 .
- Ryan , L. , Liesel , Y. and Alan , R. 2008 . Seasonaland diurnal variability in airborne mold from an indoor residential environment in northern New York . J. Air Waste Manage. Assoc. , 58 : 684 – 692 . doi: 10.3155/1047-3289.58.5.684
- Seo , Y.H. 2008 . Examination of air pollution control equipments of the incineration plants for the response to the total amount regulation of air pollutants . J. Korean Soc. Environ. Admin. , 14 : 143 – 151 .
- Todorovic , M.S. and Kim , J.T. 2012 . Beyond the science and art of the healthy buildings daylighting dynamic control's performance prediction and validation . Energy and Buildings , 46 : 159 – 166 .
- Van Strien , R.T. , Gent , J.F. , Belanger , K. , Triche , E. , Bracken , M.B. and Leaderer , B.P. 2004 . Exposure to NO2 and nitrous acid and respiratory symptoms in the first year of life . Epidemiology , 15 : 471 – 478 .
- Weaver , L.K. , Hopkins , R.O. , Chan , K.J. , Churchill , S. , Elliott , C.G. , Clemmer , T.P. , James , F. , Thomas , F.O. and Morris , A.H. 2002 . Hyperbaric oxygen for acute carbon monoxide poisoning . N. Engl. J. Med. , 347 : 1057 – 1067 .