Abstract
This study is considered the first attempt to apply a mobile monitoring system to estimating silt loading on paved roads in a mega-city such as the Seoul metropolitan area. Using a mobile monitoring system developed in 2005, we estimated silt loadings on representative paved roads in the Seoul metropolitan area, including the city of Incheon, over a period of 3 yr. The temporal and spatial characteristics of silt loading were investigated for the carefully selected roads that may reflect the characteristics of the cities of Seoul and Incheon. In this study, changes in the average silt loading values were investigated in terms of land use, the temporal resolution of data acquisition (i.e., seasonal, daily, three-hour scale), the road width or number of lanes, and rainfall, which may affect the characteristics of the average silt loading significantly. It was found that the advantages of using the mobile monitoring system are its ability to obtain a large quantity of silt loading data in a short period of time and over a wide area and its ability to create a silt loading map showing the relative magnitude of silt loading in relation to a specific location, which makes it possible to easily locate hot spots.
This study may be considered the first practical application of a mobile monitoring system to obtain the silt loading data on paved roads in a mega-city such as Seoul. It was found that the advantages of using the mobile monitoring system are its ability to obtain a large quantity of silt loading data in a short period of time and over a wide area and its ability to create a silt loading map showing the relative magnitude of silt loading in relation to a specific location, which makes it possible to easily locate hot spots to be cleaned cost-effectively by city officials.
Introduction
Fugitive dust arising from the resuspension of deposited materials on paved roads by vehicle travel has been a major air pollution issue in the western United States, with its typical dry climate, as well as in northern and southern European countries such as Sweden, Finland, and Spain (CitationAbu-Allaban et al., 2003; CitationAmato et al., 2010a, Citationb; CitationHussein et al., 2008; CitationKuhns et al., 2001; CitationKupiainen et al., 2005; CitationPirjola et al., 2010). According to a recent emission inventory study, the amount of resuspended road dust emitted from paved roads in the western United States is approximately 17% of the total PM10 emission inventory (CitationCalifornia Air Resources Board, 2009). Similarly, according to a previous study (CitationJung et al., 2006; CitationKim et al., 2004) based on the Clean Air Policy Support System (CAPSS) developed by the Korean Ministry of Environment (KME), resuspended road dust is likely to be one of the largest PM10 emission sources in the road transport sector as well as the entire PM10 emission inventory for the Seoul metropolitan area, including the city of Incheon. Therefore, to manage the air quality of the Seoul metropolitan area effectively, it is very important to reduce resuspended road dust, as well as other PM sources such as vehicle exhaust PM.
To estimate the emissions of resuspended road dust, the U.S. Environmental Protection Agency (EPA) AP-42 emissions equation (CitationU.S. EPA, 1995) is currently being used in Korea. This equation uses two parameters, the silt loading and the average vehicle weight for the corresponding road. Here, the term “silt loading” is defined as the mass of the silt-size material (equal to or less than 75 μm in physical diameter) per unit area of the total surface. The total road surface dust loading consists of loose material that can be collected by broom sweeping and vacuuming of the traveled portion of the paved road. The silt fraction is determined by measuring the proportion of the loose dry surface dust that passes through a 200-mesh screen using the ASTM-C-136 method (U.S. EPA, 1995). Silt loading is the product of the silt fraction and the total loading.
During the early stage of our study in the measurement of the silt loading on the paved roads in the Seoul metropolitan area, we used a conventional broom sweeping/vacuum sweeping method to collect dust deposited on the traffic lanes while blocking them. We soon realized that obtaining silt loading data using this sort of conventional method is time-consuming and even dangerous, especially in a mega-city such as Seoul with a population of approximately 10 million people, where the number of registered cars is currently about 3 million. Furthermore, because the area to be investigated for the measurement of the silt loading was fairly large in order to obtain representative silt loading data for the Seoul metropolitan area, it was literally impossible to carry out a meaningful number of silt loading measurements using the conventional method on a regular basis. This dilemma led us to develop a mobile monitoring method in 2002. The initial version of the mobile monitoring system was made in 2003, and then, after some subsequent modifications of the original design, the final version of the mobile monitoring system was completed in 2005 (CitationHan et al., 2007; CitationKME, 2005).
The objective of this study is to introduce some of our development efforts and test results along with the findings of practical importance that we have experienced during the use of the mobile monitoring system, particularly in a mega-city such as the Seoul metropolitan area.
Mobile Monitoring System
The principle we employed for the estimation of silt loading using the mobile monitoring system is basically identical to the Testing Re-entrained Aerosol Kinetic Emissions from Roads (TRAKER) method (CitationKuhns et al., 2001) developed by the Desert Research Institute in the United States. The principle is based on the idea that the amount of resuspended road dust from paved roads (or unpaved roads) is likely to increase with an increase in the vehicle speed, the silt loading, and the vehicle weight. In addition to these factors, other important factors that may affect the extent of the resuspension of road dust include site-specific silt characteristics (e.g., the particle size distribution and the physical property of the particles) and surface characteristics such as the surface wetness of the corresponding road section, although these are not explicitly taken into consideration in the TRAKER methodology. These factors may affect the amount of resuspended road dust, but they are considered less significant variables as compared to the vehicle speed, silt loading, and vehicle weight.
Based on this principle, in the TRAKER system, the PM10 concentration of road dust solely originating from resuspension (in fact, this was called the TRAKER signal in the original work by CitationKuhns et al., 2001) is calculated by subtracting the background PM10 concentration, which is measured in front of the mobile monitoring system, from the PM10 concentration measured immediately behind the front tires of the mobile monitoring system. With the use of this background subtraction method, the PM10 concentration of the resuspended road dust solely originating from resuspension of silt deposited on the paved road due to the momentum transfer of the rotating tires, which is the TRAKER signal in the CitationKuhns et al. (2001) work (or the ΔDust in this study) can be estimated. This, in turn, is correlated with the vehicle speed and the silt loading of the corresponding road to give us a correlation equation for estimating the silt loading of the corresponding road section. As a result, if the speed of the test vehicle and the net resuspended PM10 concentration (i.e., the TRAKER signal or ΔDust) of certain location at a given time is known, the silt loading of the corresponding location at a given time can then be calculated using the correlation equation. This is how silt loading is estimated using the principle of the TRAKER method. This method makes it possible to obtain silt loading data of higher temporal and spatial resolution than those obtained by conventional methods.
A photograph of the monitoring vehicle developed for this study is shown in The mobile monitoring system largely consisted of sensor units for measuring the PM concentration, a differential global positioning system (DGPS), and a data acquisition system. DustTrak (model 8520, TSI) measured the PM10 concentration of road dust, and a portable aerosol spectrometer (model 1.108, Grimm) measured particle size distribution of the road dust. Other instruments integrated into the system were the digital temperature and humidity sensor (model 8722-M-GB, TSI) and DGPS (Stellar 2000: 1 m [RMS] position accuracy). All of the sensors and DGPS communicated with a laptop computer through RS232 ports at certain set time intervals. The weight of the mobile monitoring system including the vehicle (Hyundai Terracan EX250) and all of the instrumentation is approximately 2 metric tons, which is about the same as the fleet average weight of vehicles in the Seoul metropolitan area. A detailed design of the mobile monitoring system was presented in a previously published work (CitationHan et al., 2007).
Figure 1. Mobile monitoring system for silt loading measurement.
At the outset of this study, however, it was not clear whether the correlation equation could be successfully obtained in Korea owing to possible differences in the road dust characteristics and the clearly different traffic situations between the Seoul metropolitan area and those of the western United States, where the original correlation equation for the TRAKER system was developed. Despite this concern, a correlation equation for the measurement of silt loading on paved roads in the Seoul metropolitan area was successfully obtained after a number of test runs for calibration were carried out on carefully chosen paved roads in the city of Incheon.
The selection of the test roads was based on the land use and traffic volume. The paved roads tested in this study ranged from a paved road in a residential area, where silt loading is expected to be very low, to paved roads in both industrial and landfill areas in the city of Incheon, where silt loading is expected to be very high. This ensures a wide range of silt loading values, where the correlation equation can be applied with reasonable accuracy on paved roads in the Seoul metropolitan area.
The detailed procedure for obtaining the correlation equation for silt loading measurement can be found in previously published works (CitationHan et al., 2007; CitationKuhns et al., 2001). In this study, only the final form of the correlation equation is presented for illustration, as follows:
Note that the correlation equation obtained in this study was established based on conditions in which the silt loading ranged from 0.08 g/m2 to 4.70 g/m2, which are the lowest silt loading value and the highest silt loading value measured on the paved roads in the Seoul metropolitan area, respectively. Therefore, outside this silt loading range, it is expected that the correlation equation may not be accurate. Nonetheless, particularly for regions where the silt loading is less than 0.08 g/m2, it is likely that the extrapolation of the silt loading value to zero silt loading may not result in significant errors from a practical point of view because it is obvious that, in the case of zero silt loading, there should be no resuspension of the road dust of PM10 size.
In contrast, for silt loading higher than 4.70 g/m2, it is not clear up to what value of silt loading the correlation equation can be applied without too much error. Nonetheless, in light of the fact that just a few hot spots with silt loading higher than 4.70 g/m2 have been found thus far in the Seoul metropolitan area, applying the correlation equation beyond the applicable range would not result in much error in estimation of the total PM10 emission rate associated with resuspended road dust on paved roads in the Seoul metropolitan area.
For comparison, the correlation equation developed by CitationKuhns et al. (2001) is also presented here:
Here, T is the differential TRAKER signal (mg/m3) and s is the TRAKER speed (mile/hr, mph).
The notable difference between the correlation equation made in this study and that made by CitationKuhns et al. (2001) can be found in the exponent of T (i.e., the TRAKER signal) by a casual examination of both equations. The exponent of T in the correlation equation in this study is approximately a factor of 2.5 greater than for T in the correlation of CitationKuhns et al. (2001), which means that the correlation equation in this study is more sensitive to the TRAKER signal than their correlation equation. This may be due primarily to the difference in the detailed design of the mobile monitoring system. However, the possible difference in the silt characteristics (e.g., the particle size distribution and the physical property of the particles) and the surface characteristics of the test road section between this study and that of CitationKuhns et al. (2001) seems to contribute somewhat to this difference as well.
Therefore, it is recommended that any mobile monitoring system to be designed and employed for the measurement of silt loading on paved roads in certain regions or countries other than the western United States should have a calibration procedure to make its own correlation equation exclusively applicable to that region's paved roads.
It should also be noted that the PM10 fraction of silt loading may vary from site to site (CitationKuhns et al., 2001). Therefore, there may be a possibility that difference in the particle size distribution of the road dust from site to site results in a certain degree of underestimation or overestimation in the silt loading values from site to site.
In fact, the results of a particle size analysis of silt samples taken from various sites using the vacuum sweeping method (i.e., a direct measurement method) in the Seoul metropolitan areas, which was recently carried out on the active lanes of paved roads such as industrial, commercial, and residential roads in 2010, shows that the volume percent fractions of the particles whose equivalent volume diameters are less than 10 μm in silt ranged from 2.5% to 4.6%, with an average of 3.6%, as shown in and listed in , respectively. Here, the sampling of road dust and an analysis of the silt were carried out according to the U.S. EPA AP-42 procedures using the ASTM-C-136 method (U.S. EPA, 1995). The particle size distribution was analyzed using a Malvern Mastersizer 2000 (Malvern Instruments, Malvern, UK), which measures the equivalent volume diameter using a laser diffraction method as its principle of measurement. Although the equivalent volume diameter is not the same as the aerodynamic diameter used in obtaining the PM10 (based on aerodynamic diameter) fraction in silt by other researchers, it is likely that for silt particles, the equivalent volume diameter may be slightly smaller than the aerodynamic diameter based on the relationship between these two definitions of equivalent diameters for nonspherical particles, as well as the typical soil mineral particle density (approximately 2.5 g/cm3) and dynamic shape factor of typical soil particles (approximately 1.6) (CitationHinds, 1999). Furthermore, the volume percent measured by the Malvern Mastersizer is usually very close to the weight percent as long as the same materials are measured. Based on this approximation, we used the volume percent fraction of the particles whose equivalent volume diameters are less than 10 μm in silt as a surrogate of the PM10 fraction of silt in this study. For convenience, however, we refer to the volume percent fraction of the particles whose equivalent volume diameters are less than 10 μm in silt simply as the PM10 fraction in silt from here on.
Table 1. Analysis of PM10 fraction in the silts sampled from various sites according to land use
Figure 2. PM10 fraction (volume %) of silt (<75 μm) sampled on active traffic lanes versus silt loading.
According to the results, the ratio of the maximum PM10 fraction to the minimum PM10 fraction is approximately 1.8. More specifically, the maximum PM10 fraction of silt loading has a value that is approximately 27% larger than the average value, while the minimum PM10 fraction of silt loading has value that is approximately 31% smaller than the average value. Also, as shown in , it is likely that there is no systematic tendency for the PM10 fraction in silt loading to increase or decrease as the silt loading increases from 0.31 g/m2 to 1.43 g/m2, which is almost a fivefold increase in silt loading. This implies that the PM10 fraction of silt loading may not be a strong function of the magnitude of the silt loading itself; rather, it may vary from site to site or even from test section to test section in a certain test road segment such that the ratio of the maximum PM10 fraction to the minimum PM10 fraction is approximately 1.8.
Therefore, the degree of variation in the estimated silt loading due to the difference in the PM10 fractions between sites is expected to be much smaller than that for the magnitude of the estimated silt loading itself according to the land use, road class, and time of measurement, at least in this study. Furthermore, because the average silt loading for a certain road segment is obtained by taking the arithmetic average of the data estimated every 1 second in this study, the effect of the fluctuation in the PM10 fraction from location to location on the silt loading may cancel out each other through the data averaging process.
For this reason, and considering the difficulties associated with implementing both the PM10 fraction analysis using the vacuum sweeping method and the estimation of the silt loading using the mobile monitoring system simultaneously, we neglected the variation of the estimated silt loading arising from the differences in the PM10 fractions between sites in interpreting the temporal and spatial characteristics of the estimated silt loading in the tested routes.
Criteria for Selecting Eligible Data
The developed mobile monitoring system was employed to obtain seasonal silt loading data on carefully selected paved roads in the Seoul metropolitan area, including the city of Incheon, for 3 yr, starting from 2005 and lasting through 2007.
The test runs for obtaining the silt loading data were usually carried out during the daytime, when the traffic volume was relatively high owing to the difficulties in implementing test runs at night. Hence, the effect of the dust plumes emitted from vehicles passing nearby or vehicles moving ahead of the mobile monitoring system on the silt loading measurement may affect some of the data obtained during the test runs. For this reason, the data inevitably affected by the dust plumes generated by other vehicles were systematically removed using the data selection criteria carefully made in this study, which are quite similar to the criteria used by CitationKuhns et al. (2001). When ΔDust has a negative value or is close to zero, these data are regarded as having been obviously affected by dust plumes generated by other nearby vehicles and are hence excluded from the calculation of the silt loading. Moreover, data obtained when the speed of the mobile monitoring system exceeded the speed range (i.e., 20 km/hr to 70 km/hr) upon which the correlation equation for the silt loading measurement (i.e., Equationeq 1) was based were considered to be inaccurate, and the corresponding data were therefore also excluded. However, in the case of an expressway, as an exception, the silt loading data obtained at a test vehicle speed of up to 80 km/hr were regarded as acceptable data.
Hot-spot data whose silt loading value exceeds 4.70 g/m2 was assumed to have a value of 4.70 g/m2 regardless of the value calculated using the correlation equation for the silt loading measurement so that only a few hot spots with unrealistically high silt loading values would not influence the overall average characteristic of silt loading in the Seoul Metropolitan area too much. Moreover, because the correlation equation developed in this study can only be applied in the silt loading range of up to 4.70 g/m2, this kind of data treatment criterion for hot-spot data may be needed as well, particularly when the local average or overall average silt loading values are needed.
The detailed data selection criteria used in this study are summarized in .
Table 2. Criteria for eligible data for the data obtained per second
As mentioned in , the frequency of data collection during the measurement of the silt loading was one data-point collection per second; to obtain the representative silt loading value of a certain road segment in an average sense, at least 30 data points were used to obtain the arithmetic average of those data points. Therefore, in a sense, the silt loading values obtained in this study to evaluate the emission factor of resuspended road dust are the arithmetically averaged silt loading values with respect to the corresponding length of the road segment on which the mobile monitoring system traveled during the time intervals required to obtain at least 30 qualified data points according to the data selection criteria. For reference, the percentages of the data that satisfied the data selection criteria were about 44% in the case of Seoul and about 54% in the case of Incheon. This implies that, on average, about half of the data collected failed to meet the data selection criteria employed in this study owing to the difficulties in maintaining constant vehicle speed due to stop-and-go traffic as well as the dust plumes generated by nearby traffic. Nonetheless, the amount of qualified data was still very large and thus sufficient to represent the spatial characteristics of silt loading in Seoul and Incheon by drawing a silt loading map, as shown in the next section.
Temporal and Spatial Characteristics of Silt Loading
It is known from the literature that on paved roads, silt loading tends to decrease with an increase of traffic volume, and among active traffic lanes, the lane closest to the gutter has the highest silt loading, whereas the lane closest to the center line has the lowest silt loading (KME, 2005; CitationTeng et al., 2007; CitationU.S. EPA, 2011). At the outset of this study, the mobile monitoring system was driven on each active traffic lane on the test road to investigate how the silt loading is distributed according to the traffic lanes.
As expected, it was confirmed that the lane closest to the gutter has the highest silt loading, while the lane closest to the centerline has the lowest silt loading. Since it is practically impossible to measure the silt loading values of each traffic lane of the road segment considered simultaneously unless we have multiple mobile monitoring systems, we only measured the silt loading values of the second traffic lane from the gutter, if possible, and regarded these values as representative of the silt loading value of the corresponding road segment at the time of measurement because the arithmetic average of the silt loading values of all of the traffic lanes is very close to the silt loading value of the second lane from the gutter (KME, 2005).
Moreover, considering that the only way to keep the speed of the mobile monitoring system under 70 km/hr all the time without interfering with the normal speed of the traffic flows on roads having more than three traffic lanes in one direction would be to drive the mobile monitoring system in the second lane from the gutter, it is conceivable that the preceding strategy would be appropriate from a practical point of view as well. For roads with two traffic lanes in one direction, however, we had no choice but to drive the mobile monitoring system in the traffic lane next to the gutter.
Spatial Silt Loading Characteristics of Seoul and Incheon
In addition to the primary objective of obtaining silt loading data for the estimation of resuspended road dust in the Seoul Metropolitan area, another practical advantage of using the mobile monitoring system is that one can obtain silt loading data in a large area of the city within a relatively short time period. Thus, the city officers in charge of cleaning can easily locate hot-spot areas to be cleaned and rank them as high-priority areas.
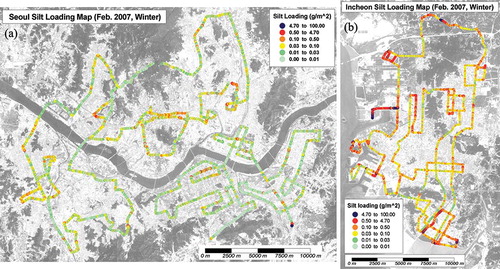
Figures 3(a) and 3(b) represent the silt loading maps of Seoul and Incheon, respectively, drawn with the silt loading data obtained every second on the road segments in Seoul and Incheon during 3 days in February 2007. It is noted, however, that in this case, the last data selection criterion when the silt loading was greater than 4.70 g/m2 was not applied to represent a hot spot more clearly on the map as an exception.
To obtain the silt loading data for Seoul and Incheon, 129 and 118 road segments, respectively, were selected according to the land use and road characteristics. Test runs using the mobile monitoring system were carried out over a 3-day period in each area. The total lengths of the roads covered were around 210 km for Seoul and 180 km for Incheon. The average length of each road segment was approximately 1.5 km. According to the results of the test runs, the maximum silt loading values obtained per second were close to approximately 100 g/m2; these hot spots were found mostly on roads of the northern port area, the industrial complex areas, and the landfill areas located in the city of Incheon.
In (a) and 3(b), six colors represent the relative magnitude of the silt loading of the corresponding location of the roads measured using the mobile monitoring system. Here, dark blue represents the highest range of silt loading values and red represents the second highest range of silt loading values. Also, pale green represents the lowest range of silt loading values. As shown in (a) and 3(b), the silt loading maps can allow us to see the differences in the silt loading characteristics between Seoul and Incheon clearly during the 3-day sampling periods in February 2007. In the case of Incheon, some of the hot-spot areas where the silt loading values were much higher than those of other areas can be seen clearly, whereas in the case of Seoul, such hot-spot areas were rarely seen. This difference in the silt loading characteristics between Seoul and Incheon is due to the fact that Incheon has major industrial areas, landfill areas, and port areas, where major fugitive dust problems are likely to occur, whereas Seoul has no such major fugitive dust sources other than construction work. Basic statistical information on Seoul and Incheon is provided in to elucidate the reason behind the difference in the silt loading characteristics between Seoul and Incheon.
Table 3. Basic statistical information on Seoul and Incheon (as of 2007)
Figure 3. Silt loading maps of paved roads in (a) Seoul and (b) Incheon.
(a) and 4(b) show the local average values of the measured silt loading of the corresponding road segments in Seoul and Incheon, respectively. As shown in the figures, in the case of Seoul, only one peak whose local average silt loading reached approximately 0.55 g/m2 was found, whereas in the case of Incheon, many peaks where the largest local average silt loading reached approximately 2.26 g/m2 were found. It was confirmed later from video images recorded during the test runs that on the road segment of Seoul whose local average silt loading exhibited the peak value of 0.55 g/m2, there was ongoing road construction work. In the case of Incheon, the road segment with the highest local average silt loading of 2.26 g/m2 turned out to belong to the local cargo traffic roads near the northern port.
Figure 4. Local average silt loadings of each road segment in (a) Seoul and (b) Incheon.
In terms of the overall average values of all the local average silt loading values of each road segment in February 2007, Seoul has an overall average silt loading of 0.05 g/m2, while Incheon has an overall average silt loading of 0.25 g/m2, which is almost five times higher than that of Seoul. This implies that the city of Incheon has more severe road dust problems than Seoul and must take special measures to clean the roads, particularly in such hot-spot areas as clearly observed in the silt loading map in (b), to reduce road dust in there effectively as soon as possible.
Here, to investigate how much the data selection criteria when the silt loading is higher than 4.70 g/m2 affect the local average silt loading values and the overall silt loading values, the following analysis was made.
For illustration, shows the variation in the silt loading measured every 1 sec on the road segment near the port of Incheon having the highest local average silt loading among the tested road segments. In this case, if hot-spot data correction is made, then the local average silt loading becomes 2.26 g/m2, which is approximately 32% lower than 3.31 g/m2, the local average silt loading calculated using raw data without hot-spot data correction. In terms of the overall average silt loading of all of the test road segments in the city of Incheon, hot-spot data correction resulted in approximately a 10% decrease in the magnitude of silt loading, as listed in . In the case of the city of Seoul, however, hot spots where silt loading measured every 1 sec is higher than 4.70 g/m2 were not found in this study and thus no data treatment regarding hot spots was necessary.
Table 4. Effects of the hot-spot data treatment on calculating the average silt loading
Figure 5. Comparison of the actual hot-spot data with the corrected data used for the calculation average silt loading.
In terms of the change in the silt loading of Seoul and Incheon during the one-year period from February 2006 to February 2007, as shown in , it is noted that the overall average silt loading of both Seoul and Incheon did not change appreciably despite slight reduction in Seoul.
Figure 6. Change in silt loading during the 1-yr period in Seoul and Incheon.
Note that in the 95th percentile of the local average silt loading data obtained from 80 road segments in Seoul decreased from 0.14 g/m2 to 0.09 g/m2, whereas the 95th percentile of the local average silt loading values obtained from 70 road segments in Incheon increased from 0.70 g/m2 to 0.96 g/m2. This implies that control measures such as street vacuum sweeping followed by water flushing taken by the city of Seoul resulted in reducing the silt loading of the hot-spot areas for road dust, whereas the control measures taken by the city of Incheon to reduce silt loading of the hot-spot areas failed to reduce the silt loading of the hot-spot areas during the 1-yr period and, on the contrary, resulted in the increase of the silt loading in the hot-spot areas. One plausible reason behind why this result occurred may be explained by examining the statistical information on the street cleaning efforts of Seoul and Incheon, as provided in . First, in terms of the total number of vacuum street sweepers, Seoul has approximately 3.6 times more vacuum street sweepers than Incheon. Second, in terms of the total number of water flush trucks, the situation is much worse for Incheon, showing that Seoul has almost 10 times more water flush trucks than Incheon. Lastly, the length of the roads covered by one vacuum street sweeper amounted to 13.5 km for Seoul and 39.2 km for Incheon, and the length of the roads covered by one water flush truck sweeper amounted to 14.2 km for Seoul and 111.5 km for Incheon. For these reasons, together with the possible increase in the activities that emit fugitive dust during the 1-yr period, the silt loading in Incheon shows an increase.
Silt Loading Characteristics According to Land Use and Seasons
Figure 7 shows the change in silt loading according to land use and season on paved roads in Incheon. To figure out variation in silt loading according to land use, the roads in the major industrial area, the port of Incheon, the commercial and residential area, and the major arterial roads were selected. Also, to see how silt loading changes with the seasons, the four seasons including spring (May 2006), summer (August 2006), fall (from September 2006 to November 2006), and winter (from December 2006 to January 2007) were chosen as a basis for comparison.
It is clear from that the highest silt loading was measured on the roads in the port area in Incheon, reaching approximately 0.24 g/m2 during the spring of 2006, whereas the lowest silt loading was measured on the major arterial roads, reaching approximately 0.04 g/m2 during the summer of 2006. In terms of the silt loading characteristics according to the land use, it is clear that the silt loadings of the major arterial roads were the lowest. This may be explained as follows. First of all, there might be no appreciable soil dust sources near the major arterial roads. Second, the average daily traffic on the major arterial roads was expected to be relatively high compared with that in other areas, which, in turn, gave rise to the higher resuspension rate of the deposited particles (i.e., the depletion effect; CitationLangston et al., 2008) on the roads. Accordingly, the combined effects associated with these two factors along with periodic road cleaning by the city of Incheon, particularly concentrated on the major arterial roads, might be responsible for making the silt loading on the major arterial roads the lowest among the data we collected.
Figure 7. Silt loading characteristics according to land use and the seasons in Incheon during the year 2006.
In terms of the silt loading characteristics according to the season, it is likely that during spring, silt loading tended to be the highest, due to the increased activities in construction work usually starting from the early spring. For areas other than the industrial area, it is evident that silt loading tended to be the lowest, presumably due to the frequent rains throughout the summer, as listed in , and the second highest during winter and the second lowest during fall, respectively. However, in the case of the industrial area, the silt loadings of the summer and fall were found to be relatively higher than that of winter. Therefore, further long-term detailed studies may be needed to more clearly elucidate the reason behind the silt loading characteristics according to the land use and seasons.
Incidentally, we do not use sand as a sanding material in the Seoul metropolitan area during winter. Instead, we use calcium chloride as a de-icer to reduce the potential air quality impact during winter (BC CitationMWLAP, 2005). Therefore, a sanding material effect after the snow melts may not be responsible for the high estimate of the silt loading in spring in this study. On the other hand, it is well known that in Nordic countries, the springtime high PM10 emission is due to the sanding material effect after the melting of the snow (CitationEdvardsson and Magnusson, 2009; CitationHussein et al., 2008; CitationZhu et al., 2009).
Variation of Silt Loading in Short Time Intervals
Taking advantage of the merits of the mobile monitoring system enabled us to obtain almost real-time silt loading data. We attempted to figure out how silt loading changes with time for relatively short time intervals on carefully selected roads in Incheon. is the plot of the daily silt loading data obtained on the test roads during a 1-week period from January 21, 2005 (Friday), to January 27, 2005 (Thursday), against the corresponding date. Here, to obtain the daily silt loading data of the test roads whose lengths were approximately 5 km at the longest, test runs were carried out following the test route in which the test roads were included. Since the total time it took for the mobile monitoring system to be driven around the test route was approximately 2 hr, strictly speaking, the daily silt loading data in were not obtained at the same time. Nonetheless, it is likely that the maximum 2-hr difference between the data collection times did not affect the data analysis in terms of the trend in daily silt loading of the test roads unless the change of silt loading with time is significant for relatively short time periods. Of course, the shortcomings of this study as just explained would be easily resolved if we could employ four mobile monitoring systems at the same time.
Figure 8. Daily variation of average silt loading on the test roads of Incheon during 1 week.
As for the characteristics of the silt loading according to land use, as shown in , it is noted that the daily silt loading values are clearly dependent upon land use, and the highest silt loading value was found on the test roads in the western industrial complex (denoted as the industrial complex III in this study), whereas the lowest silt loading values were found on the major arterial roads. It is also noted that where the daily silt loading was relatively high as in the case of the western industrial complex, silt loading changed significantly day by day. However, where the silt loading was relatively low, as in the case of either the roads in the residential area or the major arterial roads, no such daily fluctuation in silt loading was found; rather, silt loading remained almost the same throughout the test week.
Although further detailed study may be needed to verify the exact reasons behind the totally different time-dependent behaviors of silt loading according to land use as shown in , it seems that the competition between the rate of the resuspension of road dust and the rate of deposition of silt materials on the corresponding test roads played a major role in determining the amount of silt remaining on the corresponding test roads at a given time. In the case of the western industrial complex, there are major fugitive dust sources like the landfill that are in and around the area. Also, the traffic volume on the roads is relatively low and unsteady compared to the other areas including the southeastern industrial complex (denoted as the industrial complex IV). For this reason, it is likely that the rate of deposition of the silt material is much larger than the rate of resuspension of road dust in the western industrial complex, so that the silt loading of the test roads in the western industrial complex is much higher than that in other areas. Furthermore, presumably because of the intrinsic unsteady daily traffic volume in the western industrial complex, the fluctuation of daily silt loading values during the week may be greater in the western industrial complex than in other areas. By the same token, it is likely that the daily silt loading of the major arterial roads was very low and remained almost constant because of the relatively high and steady daily traffic volume compared to that in other areas and the absence of major fugitive dust sources near the major arterial roads.
The shorter term behavior of silt loading with time can be seen in , which plots the silt loading data taken every 3 hr on the test roads during a day against the corresponding time of measurements. To obtain these data, we drove the mobile monitoring system six times per day (24 hr) repeatedly following the test routes from January 26, 2005, to January 27, 2005.
Figure 9. Variation of average silt loading measured every 3 hr on the test roads of Incheon during 24 hr.
As shown in , it is clear that similar time-dependent behavior of silt loading according to land use as observed in the case of daily silt loading can also be seen on a shorter time scale. The silt loading values measured approximately every 3 hr exhibit the same qualitative trend as the daily silt loading does.
This implies that silt loading can change significantly even on a shorter time scale, such as 3 hr, rather than a day, depending on the circumstances. Accordingly, when high-resolution silt loading data in terms of both temporal and spatial scales are required, it is necessary to employ multiple mobile monitoring systems. For this reason, a second mobile monitoring system similar to the first mobile monitoring system introduced in this study is currently being duplicated by the Korean Ministry of Environment.
To see whether street cleaning influences the hourly and daily measurements of the silt loading, the following analysis was carried out despite the limited available information on the street cleaning carried out by the corresponding autonomous districts during the test runs in this study.
In the city of Incheon, where measurements for hourly and daily silt loading were carried out, street cleaning was performed nearly every day except for Sunday during a week, as far as we know. In addition, street cleaning was done using a vacuum street sweeper with a water sprayer on its gutter brooms, and this was followed by a water flush truck. During the wintertime, when these test runs were carried out, however, only vacuum street sweepers were employed so that the water would not freeze on the road. Street cleaning usually took place in the daytime from 10 a.m. to 4 p.m. However, we have no idea as to exactly when street cleaning took place on each and every road segment considered in this study because no detailed information regarding the records of street cleaning at that time is available at present.
In the case of hourly measurements, as shown in , however, because we started the test runs at approximately 6 p.m. and finished the test runs at around 3 p.m. the next day so as not to be interrupted by street cleaning action during the test runs, we think that the effect of street cleaning on the analysis of the time-dependent characteristics of the hourly silt loading may not be significant. It is known that the higher the silt loading of the road is, the higher the efficiency of street cleaning is (CitationChou et al., 2007). For this reason, in view of the case of the western industrial complex, where silt loading decreased significantly at around 3 p.m., we suspect that there might be street cleaning action on the corresponding test road. However, because no information regarding the exact time of street cleaning is available at present, no definitive conclusion can be made in this study. In fact, for a more thorough investigation of the reasons behind the relatively large hourly variation of the silt loading on the test road segment in the western industrial complex, all of the other PM10 emission sources including fugitive dust near the test road segment must also be taken into consideration. However, certainly, this information is difficult to obtain and is likely to be inaccurate owing to the intrinsic nature of the emission inventory of fugitive dust. Furthermore, more detailed information regarding the traffic volume on the test road segments should also be taken into consideration.
Similarly, in the case of the daily measurements, the mobile monitoring system was driven once per day from 12 a.m. to 2 a.m. from January 21, 2005, to January 27, 2005. Because all of these data were obtained at least 6 hr after the last street cleaning action took place, it is likely that the influence of street cleaning on the silt loading may not last long, on account of the possible subsequent deposition of silt on the road by adjacent PM emission sources after street cleaning. Furthermore, even if there was some influence of street cleaning on the silt loading, assuming that the degree of influence on silt loading by street cleaning was approximately the same for all of the road segments tested, still clearly shows the site-specific characteristics of silt loading.
Variation of Silt Loading According to the Number of Traffic Lanes
Figure 10 shows the dependence of silt loading on the characteristics of the cities, as well as the width of the test roads having multiple traffic lanes. In fact, since broader roads with multiple traffic lanes can accommodate higher traffic volume, the number of traffic lanes can be regarded as a proxy for average daily traffic on the corresponding roads. Accordingly, although the traffic volume is considered to be a better indicator than the number of traffic lanes, because we did not have traffic volume data with the proper temporal and spatial resolution in the Seoul metropolitan area when this study was carried out, it was not possible to compare the silt loading data with the traffic volume data directly. For this reason, we chose the width of the road having a certain number of traffic lanes in one direction as a parameter for comparison instead of traffic volumes, whose information may not be easy to obtain on the corresponding roads.
To draw , first, all the test roads in Seoul and Incheon were classified in terms of the width of the test roads having a certain number of traffic lanes regardless of the type of land use, and then the average silt loadings of the test roads having a certain number of traffic lanes were obtained by taking an arithmetic average of all the silt loading data of the corresponding roads having a certain number of traffic lanes.
Figure 10.Variation of silt loading according to the number of traffic lanes.
As shown in , the average silt loading clearly decreases as the number of lanes increases in the case of Incheon, whereas it remains almost constant as the number of lanes increases in the case of Seoul. This may be attributed to the fact that there are no major fugitive dust sources in Seoul, and the traffic volume on the roads in Seoul is relatively high compared with that in Incheon.
Specifically, as an illustration, for the case of a one-lane road, the deposition rate of the silt material on a one-lane road in Incheon may be much higher than that in Seoul because of the higher possibility of the existence of the fugitive dust sources near one-lane roads in Incheon than in Seoul, while the resuspension rate of deposited silt materials from the one-lane road may be lower in Incheon than in Seoul because of the lower traffic volume in Incheon than in Seoul, as listed in . It is known that the larger the traffic volume is on the road segment, the smaller the silt loading becomes on the road segment as a consequence of the depletion effect of vehicle runs, as mentioned by Langston et al. (2008). Accordingly, it is conceivable that the arterial roads with larger traffic volumes tend to have smaller silt loading, as shown in and Similar logic can also be applied for the case of multiple-lane roads to explain the silt loading characteristics according to the number of lanes and cities.
One may also expect that, generally, roads with a larger number of traffic lanes have a higher speed limit to accommodate a higher traffic volume. Therefore, if the mobile monitoring system was driven at nearly the same speed as the fleet average speed of the vehicles on the road segment, which may be close to the speed limit of the road segment, the speed of the mobile monitoring system could be an another good indicator of the traffic volume of the corresponding road segment, as suggested by CitationZhu et al. (2009). Unfortunately, however, this was not the case in this study, as we drove the mobile monitoring system intentionally at the limited speed, ranging from 20 km/hr to 70 km/hr, if possible, depending on the traffic situation, even on the test road segments with a speed limit of 80 km/hr, so as not to violate the condition of the speed range under which the correlation for estimating silt loading was developed in this study.
As shown in (a), which is a plot of the average travel speed of the mobile monitoring system used during test runs in this study against the posted speed limit, it is clear that these two speeds do not have a good correlation with each other, showing a correlation coefficient of 0.334, although it appears that the average travel speed of the mobile monitoring system tends to increase slightly with an increase in the posted speed limit. This implies that the average speed of the mobile monitoring system may not be a good indicator of the traffic volume of the corresponding road segment, at least in this study.
Figure 11. (a) Correlation between the average travel speed of the mobile monitoring system and the posted speed limit. (b) Correlation between the average ΔDust value and the average travel speed of the mobile monitoring system.

For this reason, it is likely that the mobile monitoring system's sampling signals (i.e., ΔDust), which are the PM10 concentration differencse between the background concentration and that obtained immediately behind the front tire of the mobile monitoring system during sampling runs, have a very weak correlation with the average travel speed of the mobile monitoring system, as shown in (b). For illustration, regarding the degree of scattering of the ΔDust obtained at approximately the same average travel speed, it is shown in (b) that the maximum ΔDust value is almost 10 times greater than the minimum ΔDust value in some cases (e.g., at an average travel speed of about 40 km/hr).
Therefore, it is difficult to estimate how much the average travel speed of the mobile monitoring system affected the ΔDust value using these data points due to the large scattering in the ΔDust data, although it appears in (b) that both the degree of scattering in the ΔDust data and the magnitude of the ΔDust data decrease gradually as the average travel speed of the mobile monitoring system increases. It is likely that the large degree of scattering of the ΔDust data was caused by the intrinsic difference in the amount of the silt deposited on the road segments. In other words, in this study, considering the degree of the scattering in the ΔDust data at about same average travel speed of the mobile monitoring system as well as the degree of the variation in the ΔDust data according to the increase in the average travel speed of the mobile monitoring system, the variation of silt loading may be more strongly dependent on factors such as the traffic volume or the number of traffic lanes, or the land use, than it is on the average travel speed of the mobile monitoring system.
Effect of Rainfall
There were two unexpected heavy rainfall events during the early summer of 2006 in the Incheon area. A light rainfall of 8.5 mm occurred on May 5, 2006, and a subsequent heavy rainfall of 86.5 mm occurred on May 6, 2006. Approximately 1 month later, a cumulative rainfall of 97 mm occurred during the 6 days from June 10 to June 15, 2006 (specifically, 32.5 mm on June 10, 2.5 mm on June 11, 60.5 mm on June 14, and 1.0 mm on June 15). Since these two heavy rainfall events happened to occur in the middle of the prescheduled intensive testing campaign for measuring silt loading, we had great opportunities to investigate the effect of rainfall on the silt loading. Incidentally, during the period when the first rainfall event occurred, we were measuring the silt loading of the test route that included 62 road segments representing the major roads in the industrial and residential areas. During the period when the second rainfall event occurred, we were measuring the silt loading of another test route that included 70 road segments that broadly covered the representative roads of the city of Incheon.
In principle, the effect of rainfall on the change in the silt loading on the test roads may be evaluated by comparing the silt loading measured immediately before a rainfall event with those measured immediately after the road has dried sufficiently so that factors other than washing by rainfall do not affect the silt loading appreciably. Of course, any control actions such as road cleaning by vacuum sweepers should be absent or minimal in principle before the measurement of the silt loading. In this study, it was assumed that before we drove the mobile monitoring system, such control actions were practically absent during a period of 42 hr after a heavy rainfall in the case of the first rainfall event and 33 hr after heavy rainfall in the case of the second rainfall event.
In the case of the first rainfall event that occurred in May, approximately a 30% reduction in the overall average silt loading was estimated to have occurred for the 62 road segments after the rainfall event. Here, overall average silt loadings were calculated by taking an arithmetic average of the local average silt loadings of the 62 road segments. The local average silt loading values of each and every road segment before and after the first rainfall event were plotted in , along with the percentage of change in the local average silt loading on the corresponding road segment after the rainfall event. As shown in , it turned out that, as expected, for approximately 51 out of 62 road segments, the local average silt loading values decreased after the rainfall event, whereas for approximately 11 out of 62 road segments the local average silt loading values increased after the rainfall event, contrary to the common expectation that road washing by rainfall will decrease silt loading. The road segments where local average silt loading increased after the heavy rainfall event are mainly located in areas of the industrial complex corresponding to the road segments whose number ranges from 7 to 35. However, some cases showing increased silt loading after the rain can also be also found in the road segments belonging to the residential area. Two of them are the 45th road segment, which is considered a relatively dirty road in the residential area, and the 58th road segment, which is considered a typical clean road in the residential area.
Figure 12. Change of average silt loading after rainfall event 1.
Similarly, in the case of the second rainfall event that occurred in June, approximately a 27% reduction in the overall average silt loading was found for 70 road segments after the rainfall event. As shown in , it appears that for approximately 18 out of 70 road segments, the local average silt loading increased after the rainfall. In general, some road segments belong to the areas of the industrial complexes I, II, and IV, and the port area exhibited increased silt loading after the rainfall events, and a few road segments belonging to the area where commercial and residential areas are mixed together also exhibited similar trends. Specifically, they are (1) the road segments whose numbers range from 7 to 10 and from 13 to 15 in industrial complexes I and II, which are located almost in the middle of the residential and commercial area II and have relatively narrow roads composed mainly of two lanes in one direction, (2) the road segments whose numbers are 29 and 33 in the mixed commercial and residential area III and 60 in the mixed commercial and residential area IV, (3) the road segments whose numbers are 36, 41, and 48 in the port area, which has fugitive dust problems due to the handling activities of bulk cargos such as sand, animal feed stuffs, scrap metals, and so on, and (4) the road segment whose number is 67 in industrial complex IV composed mainly of a large number of small or medium size industries, respectively. One can clearly see the effect of rainfall on the reduction of silt loading on the whole in (a) and 14(b), which show silt loading maps representing the magnitude of silt loading on the corresponding road in the test route before and after the rainfall event of June, respectively. Here, it should be noted that each silt loading value is actually the data point obtained every second and plotted on the exact location where the data was obtained. In , one can easily see that after the heavy rainfall event, the silt loading decreased significantly on most of the roads in the test routes. However, it is also noted that the silt loading values on the roads in some areas, including the hot-spot areas such as industrial complexes I and II, the port area, and some parts of the seaside roads in industrial complex IV, were still higher than those on the roads in the rest of the areas despite the decrease in silt loading due to the heavy rainfall. Therefore, this clearly shows that reducing the hot-spot areas may be the first priority to control the resuspended road dust, although it has been proven not to be easy.
Figure 13. Change of average silt loading after rainfall event 2.
Figure 14. Change in silt loading after rainfall event 2: (a) silt loading map before rainfall and (b) silt loading map after rainfall (A: industrial complex I, B: industrial complex II, C-1 and C-2: port areas, D: industrial complex III, E: industrial complex IV).
After further detailed examination of the data including video images recorded during the test runs, it was concluded that a plausible reason for the increase in silt loading on certain road segments after heavy rainfall is the combined effect of runoff during heavy rainfall events and the malfunction of the rainwater drain system due to poorly designed and poorly maintained infrastructure, which is vulnerable to heavy rainfall. This may have increased the extent of the accumulation of soil particles on the road carried by the rainwater from the soil sources adjacent to the road.
Conclusions
This study may be considered to be the first attempt to apply a mobile monitoring system for measuring silt loading on paved roads in a mega-city such as the Seoul metropolitan area. Using a mobile monitoring system developed in 2005, we measured silt loadings on representative paved roads in the Seoul metropolitan area including the city of Incheon during a period of 3 yr. Among lots of data obtained during test runs, only qualified data prescreened according to the data selection criteria made in this study were used for the analysis of the silt loading characteristics of paved roads in the Seoul metropolitan area. The frequency of obtaining silt loading data was 1 point per second, with at least 30 data points being used to determine the average silt loading for each road segment. The advantage of using the mobile monitoring system becomes clear by observing the silt loading map showing the relative magnitude of silt loading depending on the location, which makes it possible to locate hot spots easily. The test routes were designed to include representative roads of the Seoul metropolitan area including Incheon, so that it would reflect the characteristics of each city in terms of land use and traffic volume as closely as possible.
On the whole, it seems that the traffic volume, nearby PM emission sources, and street cleaning actions played a major role in determining the time-dependent and site-specific characteristics of silt loading in this study. This indicates that unless we have more detailed information on traffic volumes, the PM emission inventory, and street cleaning actions both temporally and spatially, a more complete analysis and understanding of the dynamic behavior of silt loading with respect to time and sites will not be possible beyond what we found in this study.
Acknowledgments
This study was supported by Inha University and the National Institute of Environmental Research (South Korea).
References
- Abu-Allaban , M. , Gillies , J.A. , Gertler , A.W. , Clayton , R. and Proffitt , D. 2003 . Tailpipe, resuspended road dust, and brake-wear emission factors from on-road vehicles . Atmos. Environ. , 37 : 5283 – 5293 . doi: 10.1016/j.atmosenv.2003.05.005
- Amato , F. , Nava , S. , Lucarelli , F. , Querol , X. , Alastuey , A. , Baldasano , J.M. and Pandolfi , M. 2010b . A comprehensive assessment of PM emissions from paved roads: Real-world emission factors and intense street cleaning trials . Sci. Total Environ. , 408 : 4309 – 4318 . doi: 10.1016/j.scitotenv.2010.06.008
- Amato , F. , Querol , X. , Johansson , C. , Nagl , C. and Alastuey , A. 2010a . A review on the effectiveness of street sweeping, washing and dust suppressants as urban PM control methods . Sci. Total Environ. , 408 : 3070 – 3084 . doi: 10.1016/j.scitotenv.2010.04.025
- British Columbia Ministry of Water, Land, and Air Protection. 2005. Best Management Practices to Mitigate Road Dust From Winter Traction Materials. Victoria, BC http://www.bcairquality.ca/reports/pdfs/roaddustbmp_june05.pdf (http://www.bcairquality.ca/reports/pdfs/roaddustbmp_june05.pdf) (Accessed: 1 February 2012 ).
- California Air Resources Board. 2009. Emissions inventory data, 2008 estimated annual average emissions http://www.arb.ca.gov/ei/emissiondata.htm (http://www.arb.ca.gov/ei/emissiondata.htm) (Accessed: 7 June 2011 ).
- Chou , C.M. , Chang , Y.M. , Lin , W.Y. and Tseng , C.H. 2007 . Evaluation of street sweeping and washing to reduce ambient PM10 . Int. J. Environ. Pollut. , 31 : 431 – 447 .
- Edvardsson , K. and Magnusson , R. 2009 . Monitoring of dust emission on gravel roads: Development of a mobile methodology and examination of horizontal diffusion . Atmos. Environ. , 43 : 889 – 896 . doi: 10.1016/j.atmosenv.2008.10.052
- Han , S. , Won , K.H. , Jang , K.W. , Son , Y.M. , Kim , J.S. , Hong , J.H. and Jung , Y.W. 2007 . Development and application of real-time measurement system of silt loading for estimating the emission factor of resuspended dust from paved road . J. Korean Soc. Atmos. Environ. , 23 : 596 – 611 . In Korean with English abstract
- Hinds , W.C. 1999 . Aerosol Technology: Properties, Behavior, and Measurement of Airborne Particles , 2nd , New York : John Wiley & Sons .
- Hussein , T. , Johansson , C. , Karlsson , H. and Hansson , H.C. 2008 . Factors affecting non-tailpipe aerosol particle emissions from paved roads: on-road measurements in Stockholm, Sweden . Atmos. Environ. , 42 : 688 – 702 . doi: 10.1016/j.atmosenv.2007.09.064
- Jung , Y.W. , Han , S. , Won , K.H. , Jang , K.W. and Hong , J.H. 2006 . Present status of emission estimation methods of resuspended dusts from paved roads . J. Korean Soc. Atmos. Environ. , 28 : 1126 – 1132 . In Korean with English abstract
- Kim , H.G. , Jung , Y.W. and Hong , J.H. 2004 . Estimation of fugitive dust emission by administrative districts . J. Korean Soc. Atmos. Environ. , 20 : 263 – 276 . In Korean with English abstract
- Korean Ministry of Environment . 2005 . A Study on Atmospheric Emission Inventory Development, and the Estimation of Air Pollutant Emission Factors and Quantity. Final Report , Seoul : Seoul . In Korean with English abstract
- Kuhns , H. , Etyemezian , V. , Landwehr , D. , MacDougall , C. , Pitchford , M. and Green , M. 2001 . Testing re-entrained aerosol kinetic emissions from roads: A new approach to infer silt loading on roadways . Atmos. Environ. , 35 : 2815 – 2825 . doi: 10.1016/S1352-2310(01)00079-6
- Kupiainen , K.J. , Tervahattu , H. , äisänen , M. R , äkelä , T. M , Aurela , M. and Hillamo , R. 2005 . Size and composition of airborne particles from pavement wear, tires, and traction sanding . Environ. Sci. Technol. , 39 : 699 – 706 . doi: 10.1021/es035419e
- Langston, R., R.S. Merle, Jr., D. Hart, V. Etyemezian, H. Kuhns, J. Giles, D. Fitz, K. Bumiller, and D. James. 2008. Clark County (Nevada) Paved Road Dust Emission Studies in Support of Mobile Monitoring Technologies. U.S. Environmental Protection Agency http://www.epa.gov/ttnchie1/ap42/ch13/related/Final_Test_Report.pdf (http://www.epa.gov/ttnchie1/ap42/ch13/related/Final_Test_Report.pdf) (Accessed: 3 June 2011 ).
- Pirjola , L. , Johansson , C. , Kupiainen , K. , Stojiljkovic , A. , Karlsson , H. and Hussein , T. 2010 . Road dust emissions from paved roads measured using different mobile systems . J. Air Waste Manage. Assoc. , 60 : 1422 – 1433 . doi: 10.3155/1047-3289.60.12.1422
- Teng , H. , Kwigizile , V. , James , D.E. and Merle , R. 2007 . Identifying influencing factors on paved roads silt loading . J. Air Waste Manage. Assoc. , 57 : 778 – 784 . doi: 10.3155/1047-3289.57.7.778
- U.S.Environmental Protection Agency . 1995 . Compilation of Air Pollutant Emission Factors (AP-42) , 5th , Vol. I , Research Triangle Park , NC : U.S. Environmental Protection Agency .
- U.S. Environmental Protection Agency. 2011. Compilation of Air Pollutant Emission Factors (AP-42), vol. I, section 13.2.1, Paved roads (final section: January 2011). Research Triangle Park, NC: U.S. Environmental Protection Agency http://www.epa.gov/ttn/chief/ap42/ch13/final/c13s0201.pdf (http://www.epa.gov/ttn/chief/ap42/ch13/final/c13s0201.pdf) (Accessed: 3 June 2011 ).
- Zhu , D. , Kuhns , H.D. , Brown , S. , Gillies , J.A. , Etyemezian , V. and Gertler , A.W. 2009 . Fugitive dust emissions from paved road travel in the Lake Tahoe Basin . J. Air Waste Manage. Assoc. , 59 : 1219 – 1929 . doi: 10.3155/1047-3289.59.10.1219