Abstract
This paper evaluated the feasibility of using the horizontal radial plume mapping (HRPM) technique to locate multiple emission sources via computational simulation. Seventy-two test maps, each having two Gaussian distributions, were generated in a two-dimensional domain. The HRPM technique with the non-negative least square (NNLS) algorithm was then applied to reconstruct the plumes, assuming a nine-beam scanning beam geometry. The NNLS algorithm successfully reconstructed the source locations of 68 of the 72 test maps. However, when one of the plumes was near the origin, the NNLS did not always identify the peak locations correctly. Furthermore, when the two plumes were spaced closely, the NNLS tended to reconstruct a wide plume covering both plumes instead of separating them due to the resolution limitation of the current nine-beam geometry. In the sensitivity analysis, five sets of random error (1%, 5%, 10%, 20%, and 30%) were added in the path-integrated concentration (PIC) from the 72 test maps, and thus, an additional 360 reconstructions were implemented. Robust results were obtained when the noise added was less than 20%. The results generally support the implementation of the NNLS algorithm in the HRPM technique as described in the U.S. Environmental Agency (EPA) Other Test Method 10 (OTM-10).
The methodology evaluated in this paper provides near-real-time estimates about the locations of multiple emission sources. The involved optical remote sensing instruments can monitor large spatial areas (e.g., landfills) in a cost-effective way.
Supplementary materials are available for this paper. Go to the publisher's online edition of the Journal of the Air & Waste Management Association for three failed cases of narrow plumes and examples of the translated grids.
Introduction
Locating emission sources or hot spots of air pollutants is essential for many health and environmental reasons. To control pollution and minimize its impact on human health, it is important to locate the pollution sources in a timely fashion. Several researchers have applied optical remote sensing (ORS) instruments with the computed tomography (CT) technique to reach this goal (CitationByer, 1979; CitationWolfe and Byer, 1982). However, the involvement of complicated CT beam geometry composed of more than one ORS instrument or multiple detectors limited its real-world application (CitationDrescher et al., 1996; CitationSamanta and Todd, 2000).
A radial plume mapping (RPM) technique using only one ORS instrument with multiple retroreflectors was proposed for further improvement in this field. The CitationU.S. Environmental Protection Agency (EPA) Other Test Method 10 (OTM-10), which was released in 2006, provided the guidelines for conducting RPM measurements (EPA, 2006). The horizontal radial plume mapping (HRPM) technique described in OTM-10 was designed to locate hot spots of air contaminants. In previous studies, this technique was evaluated with both computational simulation approaches (CitationHashmonay et al., 1999, 2002) and field experiments (CitationWu et al., 1999; CitationHashmonay et al., 2002). For example, in CitationHashmonay et al. (2002), the authors demonstrated that the HRPM technique was able to give comparable results for plume characterization to the CT technique. In our previous study (CitationWu and Chang, 2011), we further evaluated the performance difference between two reconstruction algorithms that were commonly used in the HRPM technique.
What is less known is the feasibility of using the HRPM technique for identifying multiple plumes of the same substance. In this paper, we evaluate the performance of the HRPM technique to locate two plumes with computational simulation data. A series of test maps with two plumes along with the associated path-integrated concentration (PIC) data were simulated. These PIC data were then reconstructed by the HRPM technique to estimate the peak locations. Several modifications were also proposed to improve this technique.
Materials and Methods
Generation of test maps and associated PIC
The study domain was set at 30 × 30 dimensionless units and was further divided into nine pixels of equal size. A nine-beam geometry was assumed to have one ORS instrument at the origin and the path-defining components (e.g., retroreflectors) on the edge of each pixel such that the beam paths passed through the center of each pixel (). This was to maximize the beam path length within each pixel and minimize the error magnification of the algorithm (CitationHashmonay, 2008). Two symmetric Gaussian distributions with the same height, width (standard deviation [SD] = 2), and shape were generated with the peak locations at the center of different pixels to form one test map. Thus, the total number of the test maps in this series was 36 (=). Another series of test maps (n = 36) were generated with larger SD (= 4) at the same locations. Previous studies also used the Gaussian distributions to generate the test maps (CitationDrescher et al., 1996; CitationVerkruysse and Todd, 2005) and thus allowed the researchers to directly compare the input parameters to the parameters obtained from the reconstructed algorithm (CitationHashmonay et al., 1999). The observed PIC (PICobs) of the nine beam paths were calculated by integrating the simulated Gaussian distributions and were defined as follows:
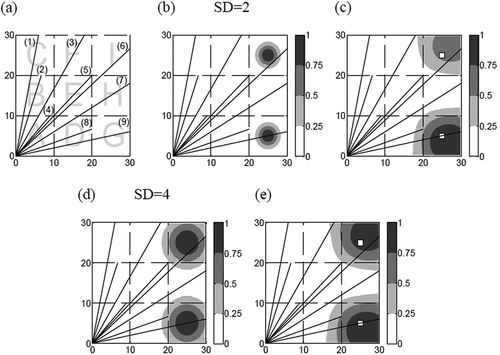
Figure 1.(a) The plan view of the simulated beam geometry. The letters A to I represent the pixel IDs, and the numbers in parenthesis represent the beam IDs. (b) An example of the test map with two Gaussian distributions (SD = 2). (c) The reconstruction results of (b) by the NNLS algorithm. (d) An example of the test map with two Gaussian distributions (SD = 4). (e) The reconstruction results of (d) by the NNLS algorithm. The grayscale bars represent the relative concentration levels of the reconstructed plumes.
where j is the parameter number index, k is the basis function number index, Li is the ith beam path length, pjk is the jth parameter of the kth basis function, and Gk is the kth basis function. For this study, k equaled 2 (two basis functions, which are both Gaussian distributions), and i ranged from 1 to 9 (nine beam paths). To simplify the test map, we incorporated two identical bivariate Gaussian distributions with the same standard deviation in both the x-axis and y-axis to generate the test map. Furthermore, the correlation between the x and y components of both Gaussian distributions were set at 0, and thus, j equaled 4 (i.e., the peak location at x and y, standard deviation, and scaling factor for the peak height).
In real-world applications, it takes time for the ORS instrument to scan from one retroreflector to another. Because the PICs are not collected simultaneously and the plumes might fluctuate as the meteorological condition changes, it was essential to investigate the reconstruction stability of the NNLS algorithm. Thus, for the sensitivity analysis, we added random errors of 1%, 5%, 10%, 20%, and 30% to each PIC set (defined as PICs for paths 1–9), and thus, 180 (36 × 5) additional PIC sets were generated for each map series. For example, the random error within 1% of the original PICobs was added to all the synthetic PICobs data derived from the 36 test maps. The NNLS algorithm was then performed to reconstruct all the 36 maps.
NNLS reconstruction
NNLS is an iterative algebraic deconvolution algorithm (CitationLawson and Janson, 1995; CitationHashmonay et al., 2007). The observed PIC for deconvolution to retrieve the concentration information is given by:
where K is the kernel matrix that incorporates the specific beam geometry, k is the number index of the beam paths, m is the number index of the pixels, and c m is the concentration in the mth pixel. In this study, k and m both equaled 9 (nine beam paths and nine pixels). Each element in the kernel matrix represents the length of the kth beam path in the mth pixel. Given PICobs and Kkm in Equationeq 2, the NNLS was able to solve for cm . The geostatistical method of kriging (CitationOliver and Webster, 1990) was further applied to generate a smooth surface map and to avoid limiting the peak in the center of each pixel.
Evaluation of the reconstruction quality
Three indicators were used to evaluate the reconstruction quality. First, the concordance correlation factor between the observed and reconstructed PICs (CCFPIC) was calculated to describe the quality of fit between them and to determine whether the solution search process was optimized. The CCF is similar to the Pearson correlation coefficient, with adjustments for the shifts in location and scale (CitationHashmonay et al., 1999). A CCF equal to 1 represents a perfect match between the two sets of data. Second, a successful reconstruction result was defined as having the peak locations of both underlying Gaussian plumes covered by regions with a relative concentration above 0.5 (CONCE50%) in the reconstructed maps. The relative concentrations were calculated by standardizing the reconstructed results with the highest concentration among each map so that the maximum was 1. The last indicator was the area of the CONCE50%, which was used to describe the uncertainty of the reconstruction results.
Results and Discussion
One example of the test distributions (SD = 2) and the reconstructed results is given in and c. Both test plumes were away from the origin (in pixels G and I). The CCFPIC was 1, indicating that it obtained the converged solution. The NNLS algorithm gave reasonably good estimates of the source locations. The area of CONCE50% was 138.3 square units (15.4% of the studied area) and covered both real-source locations. Similar results were also observed for the wide plumes (SD = 4; and e). The area of CONCE50% was 187.3 square units and covered both real-source locations. The overall reconstruction results for the test maps with SD = 2 are given in . The high CCFPIC values for both the successful and failed cases (0.93 ± 0.08 and 0.94 ± 0.05, respectively) indicated that the NNLS algorithm successfully found converged results. Among the 36 test maps, 32 of them were with the CONCE50% covering both plumes (success rate = 89%), and the average area for successful reconstructions was 174.0 ± 24.5 square units (<20% of the studied area). Better performance was observed for the large plumes. The CONCE50% covered both peak locations in all test maps (success rate = 100%) and the average area of CONCE50% was 204.6 ± 20.6 square units (22% of the studied area). Note that the area statistics obtained from the plumes with different sizes (i.e., SD = 2 vs. 4) should not be compared directly because a wider plume naturally yields a larger area of CONCE50%.
Table 1. Summary statistics of the NNLS reconstruction results for test maps with SD = 2
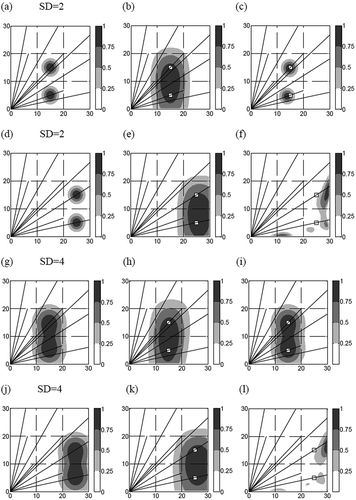
Figure 2 shows examples of two plumes in proximity of each other. Although the two real-source locations were covered by the CONCE50% in all four examples, the NNLS algorithm was not able to separate the two closely spaced plumes (, second column), especially for the ones with SD = 2. This was because the current beam geometry has relatively coarse pixels and did not have sufficient spatial resolution to differentiate the two plumes. In spite of the high CCFPIC values obtained (>0.99), the NNLS algorithm tended to merge the two small plumes into one large plume. Note that the pixel resolution was limited by the number of beam paths. On the other hand, the current beam geometry was adequate to reconstruct two plumes that were not adjacent to each other, as demonstrated in This suggests that the HRPM technique could be used as a screening tool to narrow down the area to search for the potential emission sources, rather than to map the exact spatial distributions of the plumes. In that type of application, it is not critical to separate the two plumes, and conventional point samplers could be employed in the follow-up survey to acquire more accurate source location estimation.
Figure 2.Examples of the reconstruction results for the test maps with two plumes in close proximity to each other. First column (a, d, g, j): Test maps. Second column (b, e, h, k): The NNLS reconstruction results. Third column (c, i): The SBFM reconstruction results; (f, l): the NNLS-GT reconstruction results. The white squares represent the real-source locations. The grayscale bars represent the relative concentration levels of the reconstructed plumes.
For the four cases with narrow plumes of which the NNLS failed to reconstruct both peak locations, three of them had one of the two reconstructed plumes located near the origin (, first row). One example of the failed reconstruction results is given in with one peak in pixel A (i.e., near the origin) and the other in pixel E (CCFPIC = 0.95). The CONCE50% only covered one of the real-source locations (in pixel E), although the source location in pixel A was still covered by the regions with relative concentration between 25% and 50% (). Similar phenomenon was also observed for the other two cases (Appendix 1). In , the low concentration detected by paths 1 and 2 prevented the algorithm from assigning a high concentration value in pixel A. Instead, a high concentration value was assigned in pixel E () to yield a high PIC for paths 3, 5, 6, and 7, leading to biased results. We further examined the other five test maps with one of the plumes in pixel A but with both peaks covered by CONCE50%. One such example is given in Although the CONCE50% covered both real sources (), its area was larger (201.5 square units, 22.4% of the studied domain) than the average value. On the other hand, this issue is less of a concern for larger plumes ( and j). In both cases, the CONCE50% covered both real sources ( and k) and the corresponding areas (197.3 and 205.5 square units) were close to the average value. The reason of getting better results for larger plumes is that they were detected by all the beam paths in pixel A, thus, the algorithm had sufficient information to identify them successfully.
Figure 3.Examples of the reconstruction results from the NNLS and SBFM algorithms for test maps with one of the simulated plumes close to the origin. First column: Test map. Second column: The corresponding NNLS reconstruction results. Third column: The corresponding SBFM reconstruction results. The white square represents the real-source location. The grayscale bars represent the relative concentration levels of the reconstructed plumes.
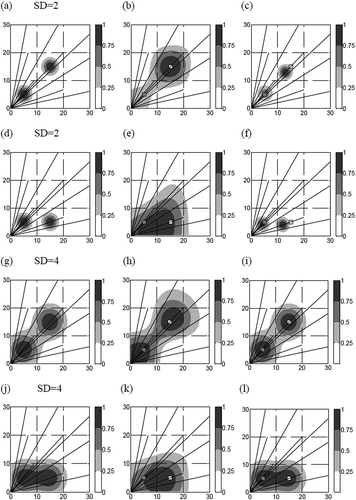
Our previous study demonstrated that the smooth basis function minimization (SBFM) algorithm is an alternative method for reconstructing plumes near the origin when only one plume existed in the studied area. In the SBFM algorithm, a known smooth basis function with unknown parameters is chosen to characterize the plume. By minimizing the error function between the observed and predicted PIC, the unknown parameters can be estimated (CitationDrescher et al., 1996; CitationHashmonay et al., 1999; CitationWu et al., 1999). We applied this algorithm to reconstruct the test maps with two plumes that were both close to the origin. For the two examples of narrow plumes in , the SBFM did not locate the two plumes accurately, either ( and f). This is because the current beam geometry did not have sufficient segmenting information to detect these narrow plumes. In a real-world application, we can judge whether there is a narrow plume near the origin by examining the collected PIC data in detail. That is, a high PIC value detected by the short paths of the beam geometry indicates a plume near the origin (CitationWu and Chang, 2011). Although in this case, the SBFM would work well for one plume, as demonstrated in previous studies (CitationWu and Chang, 2011), we cannot rule out the possibility of other plumes existing. In this circumstance, the beam geometry needed to be adjusted by moving the ORS instrument away from the plumes.
As discussed above, the NNLS tended to merge two adjacent plumes into one large plume (). We attempted to improve the reconstruction results with two different approaches. For the test maps in and g, the SBFM algorithm revealed two plumes ( and i). The uncertainty area also decreased (CONCE50% = 32.3 and 153 vs. 186.5 and, 205.5 square units from the NNLS algorithm).
When the sources were away from the origin ( and j), we attempted to incorporate the grid translation (GT) technique (CitationVerkruysse and Todd, 2004; CitationVerkruysse and Todd, 2005) into the original NNLS algorithm to further decrease the uncertainty (i.e., area of the CONCE50%). The SBFM was not considered in this case because the segmenting information was very limited when the plume was away from the origin (CitationWu et al., 1999; CitationWu and Chang, 2011). Previous studies have shown that combining the conventional CT with the GT technique provides a more accurate concentration estimate than using only the CT approach (CitationVerkruysse and Todd, 2005). In the GT technique, the pixels described in the experimental configuration were modified each time that a NNLS reconstruction was performed. In this study, the basis grid cells (i.e., pixels) were translated along the x and/or y directions by multiples of one-fifth of the width of the basis grid cell. Three examples of the translated grids are given in Appendix 2. The total number of translated grids was 25 (five times on the x-axis by five times on the y-axis). For each of the 25 translated grids, the NNLS reconstruction was implemented to estimate the concentration within each pixel. The reconstructed concentrations from these 25 grids were further interpolated by kriging to produce an overall map with a finer resolution. The results showed that adding the GT technique into the NNLS algorithm did not improve the ability of the HRPM technique to reconstruct the plumes ( and l). This was because the area of several translated pixels on the edges was small (Appendix 2) and the NNLS algorithm assigned high values in those small pixels when a plume was detected by a beam path near the edges. Good results were obtained by incorporating GT into the conventional CT technique because the multiple ORS instruments and scanning beam paths formed a complicated beam geometry. This guaranteed that all pixels were passed by an adequate number of beam paths even during the translation to provide additional information for confining the possible solutions.
For the sensitivity analysis, various levels of noise were added to the PIC data. Although generally the number of failed cases increased when more random error was added as expected, this number increased to just five cases for the narrow plumes at the 10% level and remained as zero for the wide plumes at the 20% level. In a previous report (CitationModrak et al., 2005) and in our own field quality assurance/quality control (QA/QC) evaluation, the accuracy for one of the common ORS instruments, the open-path Fourier transform infrared spectrometer (OP-FTIR), was estimated to be within ±5% to ±10%. This suggests that applying the NNLS algorithm on OP-FTIR data should provide reliable results during stable weather conditions. It is worth noting that fluctuating meteorological conditions may introduce additional errors, because in the real-world application the PIC data of each beam path usually are not collected simultaneously. The magnitude of this type of error could be partially reduced by calculating the moving average of the input PIC before the NNLS reconstruction, as described in the OTM-10 (EPA, 2006) and CitationHashmonay (2008). The mean area of the CONCE50% did not vary significantly at different noise levels (data not shown), indicating that the uncertainty was less affected by the added error.
To further evaluate the performance of the HRPM technique, the peak location of each plume in the test maps was shifted randomly within the original pixel of choice. This process was repeated three times for each map so 216 (3 × 2 × 36) additional test maps were generated. Among the three series of test maps with wide plumes (n = 36 each), 10, 7, and 6 of them did not have both peak locations covered by the CONCE50%. Nonetheless, all but one of these cases still had the peaks covered by the regions with relative concentration higher than 25%. On the other hand, among the three series of test maps with narrow plumes (n = 36 each), 9–13 of them had at least one peak not covered by the regions with relative concentration higher than 25%. The main reason of the poor performance on these narrow plumes is that many of them were not detected by any of the beam paths due to the shifted peak locations. Increasing the number of beam paths could solve this problem, although previous field studies suggested that plumes tended to disperse considerably (CitationHashmonay et al., 2002). Determining the optimal number of beam paths and pixel resolutions relative to the expected plume size would require further investigation.
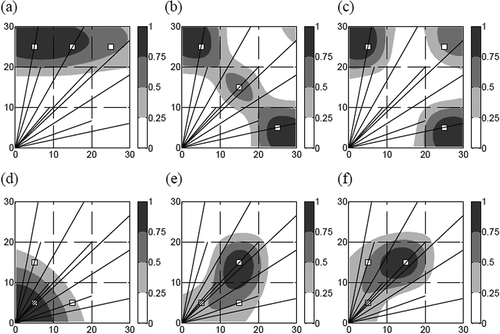
In addition to evaluating the test maps with two plumes, we also assessed the scenarios where three plumes existed simultaneously. Several examples are given in When the plumes were away from the origin (–c), the NNLS algorithm was able to locate the source locations within the region of the CONCE50%. Depending on whether the plumes were adjacent to or separated from each other, the NNLS algorithm reconstructed one large plume () or several small plumes ( and c), respectively. When one of the plumes was near the origin, the region of the CONCE50% did not always cover all three peak locations (–f), similar to the phenomenon observed for the two-plume scenarios.
Figure 4.Examples of the reconstruction results for test maps with three plumes. (a, b, c) The plumes are away from the origin. (d, e, f) The plumes are close to the origin. The white squares represent the real-source locations. The grayscale bars represent the relative concentration levels of the reconstructed plumes.
One limitation of this study was using simplified Gaussian distributions to generate test maps. In real-world applications, the plumes do not necessarily have identical distributions. For example, the concentration difference between the two plumes may compromise the ability of the HRPM technique to locate the peak locations correctly. The plume with the low concentration could be “ignored” by the algorithm because it contributes less to the collected PIC. However, identifying the major plume might be sufficient from the view of pollution control. More comprehensive studies should be conducted using both computational simulation and field experiments to further investigate how the concentration difference affects the ability of the HRPM technique to locate multiple emission sources. The issue of getting additional dispersive turbulence due to obstacles or nonflat topography (CitationThoma et al., 2010) also should be examined.
Conclusions
This paper presented the evaluation results of the application of the HRPM technique to locate multiple plumes. The NNLS algorithm was relatively robust enough to perform in most of the simulated situations when the size of the plumes was approximately the same or larger than the geometry's resolution. This supports the use of the NNLS-HRPM methodology described in OTM-10 of the EPA for source locating. Although under certain situations (e.g., vs. b) the SBFM algorithm gives better results, its implementation will be problematic at solving more than two Gaussian functions (>9 parameters to be retrieved), especially for nonsymmetric distributions, with the current nine-beam geometry. This simulation study also showed that for scenarios with a narrow plume near the origin (judged from the measurements of the short beam paths), the beam geometry should be adjusted and moved away from the plume. Further field experiments should be implemented to verify the simulation results.
uawm_a_710552_sup_27792985.pdf
Download PDF (23.7 KB)Acknowledgments
The authors greatly appreciate the financial support from the National Science Council of Taiwan under Contract NSC97-2221-E-002-073-MY3.
References
- Byer , R.L. 1979 . Two-dimensional remote air-pollution monitoring via tomography . Opt. Lett. , 4 : 75 – 77 . doi: 10.1364/OL.4.000075
- Drescher , A.C. , Gadgil , A.J. , Price , P.N. and Nazaroff , W.W. 1996 . Novel approach for tomographic reconstruction of gas concentration distributions in air: Use of smooth basis functions and simulated annealing . Atmos. Environ. , 30 : 929 – 940 . doi: 10.1016/1352-2310(95)00295-2
- Hashmonay , R.A. 2008 . Theoretical evaluation of a method for locating gaseous emission hot spots . J. Air Waste Manage. Assoc. , 58 : 1100 – 1106 . doi: 10.3155/1047-3289.58.8.1100
- Hashmonay , R.A. , Varma , R.M. , Modrak , M.T. , Kagann , R.H. , Segall , R.R. and Sullivan , P.D. 2007 . Radial plume mapping: A US EPA test method for area and fugitive source emission monitoring using optical remote sensing . Adv. Environ. Monit. , doi: 10.1007/978-1-4020-6364-0_2
- Hashmonay , R.A. , Wagoner , K. , Natschke , D.F. , Harris , D.B. and Thompson , E. 2002 . Radial computed tomography of air contaminants using optical remote sensing. Paper presented at Air & Waste Management Association's 95th Annual Conference & Exhibition Vol. June 23–27 , Baltimore , MD 2002
- Hashmonay , R.A. , Yost , M.G. and Wu , C.F. 1999 . Computed tomography of air pollutants using radial scanning path-integrated optical remote sensing . In Advanced Environmental Monitoring. Ed. Y.J. Kim. Netherlands: Springer ,
- Lawson , C.L. and Janson , R.J. 1995 . Solving Least Squares Problems , 158 – 165 . Philadelphia : Society for Industrial and Applied Mathematics .
- Modrak , M. , Hashmonay , R. , Varma , R. and Kagann , R. 2005 . Measurement of Fugitive Emissions at a Bioreactor Landfill , Washington , DC : U.S. Environmental Protection Agency Office of Research and Development .
- Oliver , M.A. and Webster , R. 1990 . Kriging: A method of interpolation for geographical information systems . Int. J. Geogr. Inf. Syst. , 4 : 313 – 332 . doi: 10.1080/02693799008941549
- Samanta , A. and Todd , L.A. 2000 . Mapping chemicals in air using an environmental cat scanning system: evaluation of algorithms . Atmos. Environ. , 34 : 699 – 709 . doi: 10.1016/S1352-2310(99)00331-3
- Thoma , E.D. , Green , R.B. , Hater , G.R. , Goldsmith , C.D. , Swan , N.D. , Chase , M.J. and Hashmonay , R.A. 2010 . Development of EPA OTM 10 for landfill applications . J. Environ. Eng. ASCE , 136 : 769 – 776 . doi: 10.1061/(ASCE)Ee.1943-7870.0000157
- U.S. Environmental Protection Agency . 2006 . Other Test Method 10: Optical Remote Sensing for Emission Characterization from Non-Point Sources , Washington , DC : U.S. Environmental Protection Agency .
- Verkruysse , W. and Todd , L.A. 2004 . Improved method “grid translation” for mapping environmental pollutants using a two-dimensional CAT scanning system . Atmos. Environ. , 38 : 1801 – 1809 . doi: 10.1016/j.atmosenv.2003.11.039
- Verkruysse , W. and Todd , L.A. 2005 . Novel algorithm for tomographic reconstruction of atmospheric chemicals with sparse sampling . Environ. Sci. Technol. , 39 : 2247 – 2254 . doi: 10.1021/es035231v
- Wolfe , D.C. and Byer , R.L. 1982 . Model studies of laser absorption computed tomography for remote air pollution measurement . Appl. Optics , 21 : 1165 – 1178 . doi: 10.1364/AO.21.001165
- Wu , C.F. and Chang , S.Y. 2011 . Comparisons of radial plume mapping algorithms for locating gaseous emission sources . Atmos. Environ. , 45 : 1476 – 1482 . doi: 10.1016/j.atmosenv.2010.12.016
- Wu , C.F. , Yost , M.G. , Hashmonay , R.A. and Park , D.Y. 1999 . Experimental evaluation of a radial beam geometry for mapping air pollutants using optical remote sensing and computed tomography . Atmos. Environ. , 33 : 4709 – 4716 . doi: 10.1016/S1352-2310(99)00218-6