Abstract
To guarantee good traffic and air quality during the 16th Asian Games in Guangzhou, China, the government carried out two traffic control Drills before the Games and adopted traffic control measures during the Games. Vehicle activities before and during the first and second Drills, and during the Games, were surveyed. Based on the data under investigation, the impacts of control measures on traffic volumes and driving characteristics were analyzed during the first and second Drills, and the Games. The emission reduction of traffic control measures was also evaluated during the three stages using the MOBILE-China model. The results show that there were significant effects of implementing temporary traffic control measures on transportation activity and vehicular emissions. During the first and second Drills, and the Games, the average traffic volumes in monitored roads decreased, and the average speed of vehicles increased significantly. The co-effects of traffic flow reduction, traffic congestion improvement, and the banning of high-emitting vehicles helped to greatly reduce the estimated emissions from motor vehicles in Guangzhou during the first and second Drills, and the Games. Estimated vehicular emissions were reduced by 38∼52% during the first Drill and 28∼36% for the second Drill. During the Asian Games, vehicular emissions of carbon monoxide (CO), hydrocarbon (HC), oxides of nitrogen (NOx), and particulate matter with an aerodynamic diameter <10 μm (PM10) reduced by an estimated 42%, 46%, 26%, and 30%, respectively, compared with those before the Games. Both the banning of high-emitting vehicles and the travel restrictions imposed by use of odd-even licenses had significant effects on the reduction of vehicular emissions of CO, HC, NOx, and PM10.
Motor vehicles have become the most prevalent source of emissions and subsequently air pollution within Chinese cities. Understanding the impacts that different control measures have on vehicular emissions is very important in order to be able to control vehicle emissions. The results of this study will be very helpful for the further control of vehicle emissions in Guangzhou in the future. In addition, the effects of temporary transportation control measures will provide important awareness to other cities that will be hosting large-scale activities similar to the Asian Games.
Introduction
Motor vehicles have become one of the most significant emission sources of air pollution in China where there has been a rapid increase in the number of motor vehicles on the roads, particularly in mega cities (CitationFu et al., 2001; CitationHao et al., 2000a, Citation200b; CitationHe et al., 2002; CitationLei et al., 2011). Guangzhou, which is the provincial capital of Guangdong Province in China, is a city where the population of motor vehicles increased rapidly following the fast development of the economy. By the end of 2009, the total number of motor vehicles in Guangzhou had reached about 2.0 million. Motor vehicles have been one of the most prominent concerns for the cause of air pollution in Guangzhou.
In 2004, the city of Guangzhou won the right to host the 2010 16th Asian Games. In order to guarantee good traffic and air quality during the Asian Games in Guangzhou, the government has implemented a series of measures to control vehicular emissions, including newer vehicular emission standards and cleaner fuel standards for motor vehicle fuel, etc. In particular, during the Asian Games, Guangzhou adopted temporary traffic control measures with reference to the successful experience of the international and Beijing Olympic Games (CitationFrantzeskakis and Frantzeskakis, 2006; CitationFriedman et al., 2001; CitationLee et al., 2005, Citation2007; CitationZhou et al., 2010).
To achieve the effects of alleviating traffic congestion and reducing pollution emissions while simultaneously minimizing the impact on the public's traveling in the city, the Guangzhou Government decided to carry out two Drills over traffic control measures on 17–20 July and 11–14 September, before the Asian Games were underway. There are some differences in the control measures used in the different Drills to highlight the impacts of the different measures taken. The final temporary traffic control measures that were implemented during the Asian Games were formulated based on the effects of the two Drills.
The purpose of this study is to evaluate the effects of the temporary control measures on vehicular emissions during the three stages: the first Drill, the second Drill, and the Asian Games. To achieve the purpose of this study, we carried out a study on vehicular activities both before and during the periods with traffic controls, and estimated and analyzed vehicular emissions during different stages using the MOBILE-China model. Going forward, the results of this study will provide important knowledge to other cities that will host large-scale activities in the future, and will also be an important basis for vehicle emission control in Guangzhou.
Methodology
The main control measures used during the first Drill, the second Drill, and the Asian Games are listed in . As shown in the table, the first measure, namely, vehicles without “Green Label” would be prohibited to drive in Guangzhou administrative district (we defined it as “prohibition measure”), was the same for the three stages. The main difference between the control measures used during the three stages is the time period of one day for vehicles that are limited by their license plate numbers. The time periods of travel restriction by odd-even licenses for the first Drill, the second Drill, and the Asian Games were 7:00 a.m.–10:00 p.m., 8:00 a.m.–8:00 p.m., and 8:00 a.m.–8:00 p.m., respectively.
Table 1. Main control measures during the Drills and the Asian Games
Traffic volume
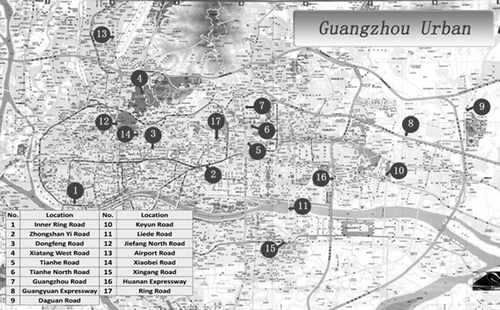
In order to assess the impact of the traffic control measures on traffic volume, traffic volume was monitored through traffic video surveillance systems that were established by the Traffic Police Detachment of Guangzhou Municipal Public Security Bureau (TDP/GMPSB). In order to characterize the typical situation of traffic in Guangzhou, the traffic volumes in 17 roads were selected to be monitored with the help of Guangzhou Municipal Environmental Monitoring Center and TDP/GMPSB. The roads should include important expressways and arterial roads throughout the city in different directions as well as typical secondary roads. At the same time, the selection of the roads should also consider the availability of the traffic video in the road. The locations of the monitoring in the 17 roads are shown in , comprising four expressways (Inner Ring Road, Guangyuan Expressway, Huanan Expressway, and Ring Road), 10 arterial roads (Zhongshan Yi Road, Dongfeng Road, Tianhe Road, Guangzhou Road, Daguan Road, Keyun Road, Liede Road, Jiefang North Road, Airport Road, and Xingang Road), and three secondary roads (Xiatang West Road, Tianhe North Road, and Xiaobei Road), which can basically represent the overall situation of road traffic in Guangzhou. The detailed traffic volume information hour by hour in the 17 roads during five stages including 10–13 July (before the first Drill), 17–20 July (during the first Drill), 4–7 September (before the second Drill), 11–14 September (during the second Drill), and 13–16 November (during the Asian Games) were recorded and analyzed. Based on the traffic videos in the 17 roads recorded by TDP/GMPSB, the traffic volumes by vehicle types were then quantified through manual reading.
Figure 1. Locations of traffic volume monitoring.
Driving patterns
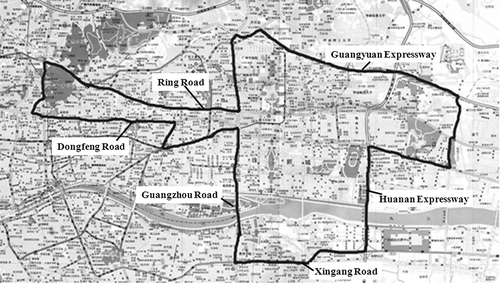
We applied a car-chasing technique in order to acquire the driving patterns of cars (CitationKent et al., 1978; CitationWang et al., 2008c). Professional drivers were employed to drive cars to follow the traffic in defined routes and a global positioning system (GPS) receiver was used in the cars to record the vehicle speed second by second (CitationWang et al., 2008c). One driver and one car were deployed before and during the first Drill and the second Drill, and during the Asian Games, individually. With the help of the staff of Guangzhou Municipal Environmental Monitoring Center, who are more familiar with the urban traffic, we determined the test routes, as shown in . The test routes are located in Yuexiu District, Haizhu District, and Tianhe District, including Guangyuan Expressway, Huanan Expressway, Ring Road, Dongfeng Road, Guangzhou Road, Zhongshan Road, Huangpu Road, Jiefang Road, Keyun Road, Xingang Road, Nonglinxia Road, and Panfu Road. The total length of the test routes is about 42 km, including about 13 km of freeways, about 26.5 km of arterial roads, and about 2 km of residential roads. The data collection was conducted on the same days as the recording of traffic volumes. Each day covered 15 hr (7:00 a.m.–10:00 p.m.). Each hour covered at least 40 min, and the total test time for every day was about 600 min.
Figure 2. Test routes for driving patterns.
Emission calculation
We used the following equation to estimate the total carbon monoxide (CO), hydrocarbon (HC), oxide of nitrogen (NOx), and particulate matter with an aerodynamic diameter <10 μm (PM10) emissions per day of vehicles in Guangzhou during each stage:
Emission factors of vehicles were calculated using MOBILE-China, a localized model based on U.S. Environmental Protection Agency (EPA) MOBILE5b and PART5 (Zhou et al., 2010). MOBILE-China was developed based on local research findings, such as fleet configuration, driving speed, and emission correction factors, and so on (CitationFu et al., 1999, Citation2000; CitationHao et al., 2001; CitationHu et al., 2006; CitationTang et al., 2000; CitationWu et al., 2002; CitationZhou et al., 2007). In the latest update, a portable emission measurement system was used to develop speed-dependent emission correction factors (CitationHu et al., 2004; CitationWang et al., 2008a; CitationYao et al., 2007). This model has already been used in several studies to derive emission factors for developing motor vehicle emission inventories in Beijing of China (CitationZhou et al., 2010; CitationWang et al., 2008b; CitationHao and Wang, 2005). We used the average test results in the 42-km test routes described in the previous section as the input of the average speeds in the MOBILE-China. The technology information of the vehicle fleet in Guangzhou was provided by TDP/GMPSB.
As for VKT, for the purpose of quantifying the baseline activity before the Drills and the Games, we obtained 20,683 samples from 11 motor vehicle testing stations located in Guangzhou with the help of Traffic Police Detachment of Guangzhou Municipal Public Security Bureau, and acquired 500 samples of taxi and 500 samples of bus from Guangzhou Municipal Traffic Management Committee. Based on the samples, the average VKT per day for different types of vehicles were estimated. The samples of the vehicles surveyed as well as the average vehicle kilometers traveled per day are listed in . The VKT during the Drills and the Games were estimated based on the average changes of the traffic volumes by vehicle types in the 17 monitoring roads as listed in and compared with those before the Drills and the Games.
Table 2. Number of samples acquired and average VKT per year for different types of vehicles
In addition, we estimated the effects of the measures of “Prohibition of vehicles without Green Label” and “Travel restriction by odd-even licenses” adopted individually. As for the estimated emission reduction caused by the odd-even license restriction individually, we involved the emissions of vehicles without Green Label and assumed that the change of VKT for vehicles without Green Label was the same as that of vehicles with Green Label. The change of VKT was calculated based on the average change of the traffic volumes in the 17 roads listed in .
Results
Impacts of traffic control measures on vehicle activity
Traffic volume
Based on the results of traffic volumes by vehicle types in the 17 monitoring roads listed in , average traffic volumes per hour in monitored roads during different stages were calculated, as shown in . As for the first Drill, the average traffic volumes in monitored roads during the Drill reduced by about 20% compared with those before the Drill. Especially for the 7:00 a.m.–10:00 p.m. time period—which is the time period when vehicles were limited by their plate numbers (odd-even ending numbers), the traffic volumes reduced by more than 22% during the Drill compared with those before the Drill.
Figure 3. Average traffic volumes in monitoring roads during different stages.
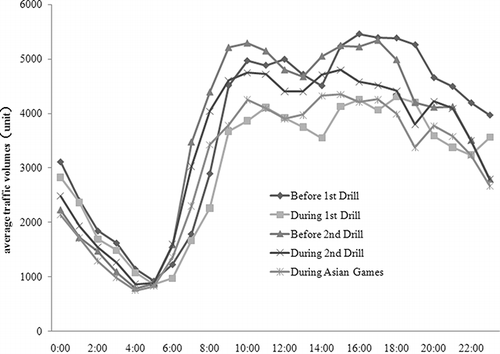
For the second Drill, the average traffic volumes in the monitored roads during the Drill reduced by about 7% compared with those before the Drill. The average traffic volumes from 7:00 a.m. to 10:00 p.m. during the Drill reduced by about 10% compared with those in the same time before the Drill. The effect of traffic control measures during the second Drill was less than that during the first Drill due to the less stringent control measures that were adopted during the second Drill, that is, the time period of travel restriction by odd-even licenses for the second Drill was adjusted to 8:00 a.m.–8:00 p.m. from the time period of 7:00 a.m.–10:00 p.m. that was adopted in the first Drill. In addition, the rainy weather may also be one factor that caused the decrease of traffic volumes during the second Drill.
During the Asian Games, the average traffic volumes in the monitored roads reduced by about 17% compared with those before the Games. Here, we used the data before the second Drill (4–7 September) to represent the situation before the Asian Games. The effect of control measures during the Asian Games was between the first Drill and the second Drill. It was caused by the time period of travel restriction by odd-even licenses for the Asian Games—7:00 a.m.–8:00 p.m.—which was between the first Drill and the second Drill.
As described above, the traffic control measures during the three stages caused the changes of total traffic volumes. At the same time, the traffic volumes by vehicle types and fleet composition were also different because of the difference of function for different kinds of vehicle. As for the traffic volumes based on vehicle types, the characteristics of traffic volumes varied differently according to the change of the vehicle types. During the first Drill, the volume for light-duty passenger cars (including cars and small buses) reduced by about 33%, which was the highest among all vehicle types, and increased by about 17% and 5% for taxis and buses, respectively, compared with that before the Drill. During the second Drill, the volume for light-duty passenger cars (including cars and small buses) reduced by about 15%, which was the highest among all vehicle types, and increased by about 9% and 8% for taxis and buses, respectively. During the Asian Games, the volume for light-duty passenger cars (including cars and small buses) reduced by about 28%, which was the highest among all vehicle types, and increased by about 10% and 4% for taxis and buses, respectively. The detailed information is listed in .
Table 3. Impacts of traffic control on volume by vehicle type during the first Drill, the second Drill, and the Asian Games
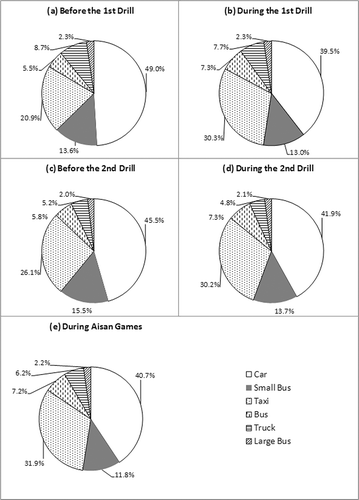
Based on the classification of vehicle counts at the 17 stations listed in , the vehicle fleet compositions for different stages were described in . As for the vehicle fleet composition during the first Drill compared with that before the first Drill, the share rate of cars decreased by 9% from 49% to 40%, and the share rates of taxis and buses increased to some extent. For vehicle fleet composition during the second Drill, compared with that before the second Drill, the share rate of cars changed from 45% to 42%, and the share rates of taxis and buses increased too. The share rate of cars decreased by about 6% during the Asian Games compared with that before the Games, and taxis and buses increased by about 7% and 3%, respectively. As for other types of vehicle, the impacts of control measures on the share rates were relatively small.
Figure 4. Vehicle fleet composition during different stages.
Driving cycles
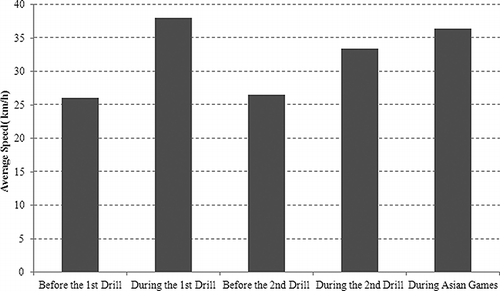
Based on the driving data recorded using a GPS during different stages, the average speeds in the test routes were calculated, as shown in . For the first Drill, the driving conditions during the Drill improved significantly due to the reduction of traffic volumes. As a result, the average speed during the first Drill increased by about 28% compared with that before the first Drill, and reached 36.5 km/hr. For the second Drill, the average speed increased by about 11% compared with that before the second Drill, and reached 32.5 km/hr. For the Asian Games, the average speed during the Games increased by about 23% compared with that before the Games, and reached 35.7 km/hr.
Figure 5. Vehicle average speeds during different stages.
Impacts of traffic control measures on vehicle emissions
Average estimated emission amounts and emission reduction rates of CO, HC, NOx, and PM10 per day for motor vehicles in Guangzhou during the first Drill, the second Drill, and the Asian Games were estimated, as listed in . During the first Drill, average emission amounts of CO, HC, NOx, and PM10 per day for motor vehicles in Guangzhou were 5.4 × 10², 86, 1.1 × 10², and 6.9 tons, respectively, reducing by about 50%, 52%, 38%, and 43%, respectively, compared with those before the first Drill. During the second Drill, average emission amounts of CO, HC, NOx, and PM10 per day were 8.0 × 10², 1.2 × 10², 1.3 × 10², and 7.9 tons, respectively, lower by about 28%, 32%, 28%, and 36%, respectively, than those before the second Drill. During the Asian Games, average emission amounts of CO, HC, NOx, and PM10 per day were 6.4 × 10², 1.0 × 10², 1.6 × 10², and 8.6 tons, respectively, lower by about 42%, 46%, 26%, and 30% than those before the Asian Games. During all the three stages with traffic controls, the emissions of vehicles in Guangzhou decreased significantly. The effect of the control measures during the first Drill was the highest, and that during the Asian Games was between the first and second Drills. This result was very similar to those for the impacts of control measures on vehicle activity, and was caused by the severity of control measures during the first Drill, the second Drill, and the Asian Games. During the first Drill, the control measures were the strictest. The measure during the Asian Games was the compromise of the traffic control measures during the two Drills, based on the effects of the two Drills. During the 2008 Olympics Games in Beijing, emissions of CO, HC, NOx, and PM10 reduced by about 56%, 57%, 46%, and 52%, respectively, (CitationZhou et al., 2010). The estimated reductions for the Beijing Olympics were higher than that estimated for the Asian Games in Guangzhou. The difference between the two is mainly because the control measures implemented in Guangzhou were not as strict as those in the Beijing.
Table 4. Average emissions and emission reduction rates of CO, HC, NOx, and PM10 per day for motor vehicles in Guangzhou during different stages with temporary control measures
During the first Drill, the second Drill, and the Asian Games, the most important control measures are “prohibition measure” and vehicles (excluding taxis and buses) being limited by their plate numbers (odd-even ending numbers) in Guangzhou administrative district. We evaluated the effects of the two measures on vehicular emissions during the three stages with traffic controls in Guangzhou. The emission reduction effects are shown in .
Table 5. Emission reduction effects of different control measures during different control stages
From , if the “prohibition measure” was adopted individually, the emission reductions for CO, HC, NOx, and PM10 were 18∼19%, 22%, 18∼23%, and 27∼30%, respectively. The emission reduction effects during the three stages were very close. That was because the total number of vehicles without a Green Label did not change much for the three stages and which was about 110,000 units. When the measure of “Travel restriction by odd-even licenses” was implemented individually, the emission reductions for CO, HC, NOx, and PM10 were 38%, 39%, 19%, and 22% for the first Drill, 19%, 21%, 17%, and 21% for the second Drill, and 33%, 33%, 10%, and 11% for the Asian Games. This result was the comprehensive effect of traffic volumes, fleet composition, and driving cycles caused by the travel restriction measure of odd-even licenses.
In this paper, the estimated emission reductions in different stages are subject to some uncertainties. The most important uncertainty comes from the limitations and errors of driving activity. In this study, due to the limited number of monitored stations and roads, the activities during different stages derived from them may bring some uncertainty. In addition, the input data and structure of the MOBILE-China model also bring some uncertainty. As described above, the measures during the first Drill were very similar to that in the 2008 Beijing Olympics Games. We compared the effects during the first Drill and the Beijing Olympics Games and find that their emission reductions are comparable. In addition, the effects are consistent with the strictness of control measures during the first and second Drills, and the Asia Games. In fact, it would be better to evaluate the accuracy of the estimation in this study if we can compare the estimated change in emissions with independent data, such as measured changes in air quality. Unfortunately, we did not obtain the near-road monitoring data. More discussion should be conducted if more data can be available.
Conclusions
Based on the comparison and analysis of traffic volumes, driving cycles, and emission estimates for vehicles in Guangzhou during the days with traffic control measures and without traffic control measures, we find that temporary traffic control measures have important effects on traffic volumes, driving cycles, and emissions for vehicles. The average traffic volumes on monitored roads during the first Drill, the second Drill, and the Asian Games reduced by about 20%, 7%, and 17%, respectively. The average speeds of vehicles in the three stages with control measures also improved evidently. The co-effects of traffic flow reduction, traffic congestion improvement, and the banning of high-emitting vehicles helped to reduce the direct emissions from motor vehicles in Guangzhou during the first Drill, the second Drill, and the Asian Games greatly. Vehicular estimated emissions of CO, HC, NOx, and PM10 in Guangzhou during the first Drill have been reduced by about 38∼50%, respectively, compared with those before the first Drill. During the second Drill, vehicular emissions reduced by about 28∼36%, respectively, compared with those before the second Drill. During the Asian Games, vehicular emissions reduced by about 26∼42%, respectively, compared with those before the Games. Both the banning of high-emitting vehicles and the travel restriction by odd-even licenses had important effects on the reduction of vehicular emission of CO, HC, NOx, and PM10. The transportation control measures adopted during the Asian Games provided important assurance for the improvement of air quality in Guangzhou. Although there are some uncertainties in the estimated emissions reductions, the experience of transportation control measures on vehicle emissions in Guangzhou will be useful for the vehicular emission control in Guangzhou and other cities in the future.
Acknowledgments
This work was supported by Guangzhou Environmental Protection Bureau, China. The authors thank the National Natural Science Foundation of China (20921140409) and Guangzhou Municipal Environmental Monitoring Center and the Traffic Police Detachment of Guangzhou Municipal Public Security Bureau for their help with acquiring data. In addition, the authors thank Zhang Minghui, Liu Rong, and Liu Lili at the School of Food and Chemical Engineering of Beijing Technology and Business University for their help with the tests on driving cycles.
References
- Frantzeskakis , J. and Frantzeskakis , M. 2006 . Athens 2004 Olympic Games: Transportation planning, simulation and traffic management . ITE Journal-Institute of Transportation Engineers , 76 : 26 – 32 .
- Friedman , M. , Powell , K. , Hutwagner , L. , Graham , L. and W. Teague . 2001 . Impact of changes in transportation and commuting behaviors during the 1996 Summer Olympic Games in Atlanta on air quality and childhood asthma . JAMA , 285 : 897 – 905 . doi: 10.1001/jama.285.7.897
- Fu , L. , Hao , J. , He , D. and He , K. 2000 . The emission characteristics of pollutants from motor vehicles in Beijing [in Chinese] . Environ. Sci , 21 : 68 – 70 .
- Fu , L. , Hao , J. , He , D. and He , K. 2001 . Assessment of vehicular pollution in China . J. Air Waste Manage. Assoc , 51 : 658 – 668 . doi: 10.1080/10473289.2001.10464300
- Fu , L. , Hao , J. , He , K. , He , D. and Wu , Y. 1999 . The new emission standard for light-duty motor vehicle in Beijing [in Chinese] . China Environ. Sci , 19 : 552 – 555 .
- Hao , J. , Fu , L. , He , K. and Wu , Y. 2000a . Urban Vehicular Pollution Control [in Chinese] , Beijing : China Environmental Science Press .
- Hao , J. , He , D. , Wu , Y. , Fu , L. and He , K. 2000b . A study of the emission and concentration distribution of vehicular pollutants in the urban area of Beijing . Atmos. Environ , 34 : 453 – 465 . doi: 10.1016/S1352-2310(99)00324-6
- Hao , J. and Wang , L. 2005 . Improving urban air quality in China: Beijing case study . J. Air Waste Manage. Assoc , 55 : 1298 – 1305 . doi: 10.1080/10473289.2005.10464726
- Hao , J. , Wu , Y. , Fu , L. , He , D. and He , K. 2001 . Source contributions to ambient concentrations of CO and NOx in the urban area of Beijing . J. Environ. Sci. Health A , 36 : 215 – 228 . doi: 10.1081/ESE-100102619
- He , K. , Huo , H. and Zhang , Q. 2002 . Urban air pollution in China: Current status, characteristics, and progress . Annu. Rev. Energy Environ , 27 : 397 – 431 . doi: 10.1146/annurev.energy.27.122001.083421
- Hu , J. , Hao , J. and Fu , L. 2006 . Impact of gas powered vehicles on vehicular emissions in Beijing [in Chinese] . J. Tsinghua Univ. Sci. Technol , 46 : 350 – 354 .
- Hu , J. , Hao , J. , Fu , J.L. and Wu , Y. 2004 . Study on on-board measurements and modeling of vehicular emissions [in Chinese] . Environ. Sci , 25 : 19 – 25 .
- Kent , J. , Allen , G. and Rule , G. 1978 . A driving cycle for Sydney . Transport. Res , 12 : 147 – 152 . doi: 10.1016/0041-1647(78)90117-X
- Lee , B. , Jun , N. and Lee , H. 2005 . Analysis of impacts of urban air quality by restricting the operation of passenger vehicles during Asian Game events in Busan, Korea . Atmos. Environ , 39 : 2323 – 2338 . doi: 10.1016/j.atmosenv.2004. 11.044
- Lee , J. , Son , J. and Cho , Y. 2007 . Benefits of mitigated ambient air quality due to transportation control on childhood asthma hospitalization during the 2002 Summer Asian Games in Busan, Korea . J. Air Waste Manage. Assoc , 57 : 968 – 973 . doi: 10.3155/1047-3289.57.8.968
- Lei , Y. , Zhang , Q. , He , K. and Streets , D. 2011 . Primary anthropogenic aerosol emission trends for China, 1990–2005 . Atmos. Chem. Phys , 11 : 931 – 954 . doi: 10:3155/1047-3289.57.8.968
- Tang , J. , Fu , L. , Hao , J. , Wu , Y. and He , K. 2000 . Development and application of database for Beijing vehicular emissions based on GIS [in Chinese] . Environ. Sci , 21 : 95 – 97 .
- Wang , H. , Fu , L. , Zhou , Y. , Lin , X. , Chen , A. , Ge , W. and Du , X. 2008a . Investigating of emission characteristics for light duty vehicles with a portable emission measurement system [in Chinese] . Environ. Sci , 29 : 2970 – 2974 .
- Wang , L. , Hao , J. , He , K. , Wang , S. , Li , J. , Zhang , Q. , Streets , D. , Fu , J. , Jang , C. , Takekawa , H. and Chatani , S. 2008b . A modeling study of coarse particulate matter pollution in Beijing: Regional source contributions and control implications for the 2008 summer Olympics . J. Air Waste Manage. Assoc , 58 : 1057 – 1069 . doi: 10.3155/1047-3289.58.8.1057
- Wang , Q. , Huo , H. , He , K. , Yao , Z. and Zhang , Q. 2008c . Characterization of vehicle driving patterns and development of driving cycles in Chinese cities . Transport. Res. D , 13 : 289 – 297 . doi: 10.1016/j.trd.2008.03.003
- Wu , Y. , Hao , J. , Li , W. and Fu , L. 2002 . Calculating emissions of exhaust particulate matter from motor vehicles with PART5 model [in Chinese] . Environ. Sci , 23 : 6 – 10 .
- Yao , Z. , Wang , Q. , He , K. , Ma , Y. and Zhang , Q. 2007 . Characteristics of real-world vehicular emissions in Chinese cities . J. Air Waste Manage. Assoc , 57 : 1379 – 1386 . doi: 10.3155/1047-3289.57.11.1379
- Zhou , Y. , Wu , Y. , Liu , Y. , Fu , L. , He , K. , Wang , S. , Hao , J. , Chen , J. and Li , C. 2010 . The impact of transportation control measures on emission reductions during the 2008 Olympic Games in Beijing, China . Atmos. Environ , 44 : 285 – 293 . doi: 10.1016/j.atmosenv.2009.10.040
- Zhou , Y. , Fu , L. and Cheng , L. 2007 . Characterization of in-use light-duty gasoline vehicle emissions by remote sensing in Beijing: Impact of recent control measures . J. Air Waste Manage. Assoc , 57 : 1071 – 1077 . doi: 10.3155/1047-3289.57.9.1071