Abstract
This paper updates the historic trends (1980–2010) in ambient ozone and ozone precursor concentrations in the South Coast Air Basin (SoCAB) and examines the evolution of the ozone-precursor relationship in the Basin. Whereas reductions in NOx (oxide of nitrogen) emissions have decreased nitrate and PM2.5 (particulate matter with an aerodynamic diameter ≤2.5 μm) concentrations in the Basin during the past decade, ozone levels have increased at the central basin locations since about 2005 following a reversal in the decline of volatile organic compound (VOC)/NOx ratios during the previous two decades. A chemical box model was used to simulate the effects of changes in precursor concentrations on ozone formation using day-of-week–specific initial precursor concentrations that were derived from measurements and projected to 2020 based on expected emission reductions from 2005 (−10% VOC and −50% NOx). Results show that peak ozone formation rates in 2020 will increase on weekdays by a factor of 3 relative to 2005 and will be comparable to 1995 weekday and 2005 Sunday rates. Ozone production will become precursor limited on Sundays in 2020, but with higher initial rates than 2005. Although a greater NOx reduction scenario in 2020 of −75% will result in even higher initial ozone formation rates, precursor limitation is reached quickly, leading to a further shift westward in the location of peak ozone levels. However, ozone levels will likely be lower in downwind areas where transport is more important than local production of ozone. The ambient versus emission inventory reconciliation indicates a factor of 2 underestimation of VOC emissions in 2009 relative to NOx. Other analyses suggest that there is an overall increase in VOC emissions on hot days that is not fully accounted for by emission inventory estimates. Air quality models using emission inventories that underestimate VOC emissions relative to NOx may lead to inaccurate forecasting of the consequence of emission reductions.
The rate and efficiency of ozone formation and accumulation in the SoCAB is more rapid than would be indicated by air quality model simulations based on the current inventory. Projected reductions in NOx emissions without concurrent reductions in VOC emissions will likely cause ozone to increase during the next decade within central regions of the SoCAB compared with a flat or slightly declining trend in far downwind locations. Air quality statistics that are commonly used to track progress toward attainment, such as basin-wide ozone design value and standard exceedances mask these varying trends within the Basin.
Introduction
California's South Coast Air Basin (SoCAB) () historically experiences the most severe air quality in the United States. Prior to the implementation of emission regulations beginning in the 1960s, hourly averaged ozone mixing ratios approaching 700 ppb were reported in the SoCAB, and Stage III episodes (ozone exceeding 500 ppb) were relatively frequent events. Four decades of progressively more stringent controls on emissions of oxides of nitrogen (NOx) and volatile organic compounds (VOCs) have significantly reduced the frequency and intensity of excessive ozone levels in the SoCAB. The Basin recorded 167 days exceeding the former National Ambient Air Quality Standard (NAAQS) of 120 ppb maximum hourly average in 1980, 131 days in 1990, 33 days in 2000, and only 7 days in 2010 (CitationCalifornia Air Resources Board [CARB], 2012a). The maximum hourly average mixing ratios of ozone in the SoCAB declined from 490 to 140 ppb during this 30-yr period and from 290 to 120 ppb for the maximum 8-hr average. Even with these achievements, the SoCAB continues to exceed the 2008 8-hr ozone NAAQS of 75 ppb on most summer days (102 days in 2010) and the trend for the past decade shows a flattening of ambient ozone (O3) levels despite continued reductions in precursor emissions.
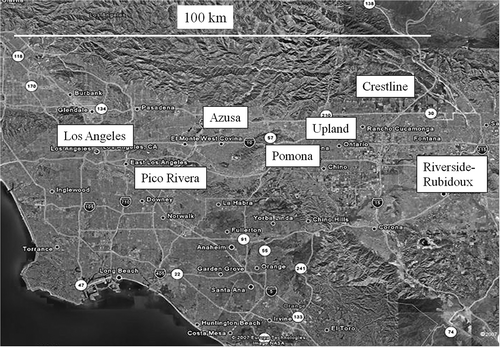
Figure 1. Map of the South Coast Air Basin with approximate locations of relevant air quality monitoring stations.
Much of the difficulty in addressing the ozone problem is related to its complex photochemistry in that the rates of ozone formation and accumulation are nonlinear functions of the mixture of VOCs and oxides of nitrogen NOx in the atmosphere (CitationStockwell et al., 2012). Thus, decreases in NOx or VOCs do not always lead to lower ozone levels and, under certain conditions, NOx reductions may result in higher peak ambient ozone levels. At high VOC/NOx ratios (NOx-limited), a decrease in NOx favors peroxy-peroxy radical reactions to form hydrogen peroxide and organic peroxides, which retard ozone formation by removing hydroperoxy radical (HO2) and other peroxy radicals from the system. However, at a low VOC/NOx ratio, HO reacts predominantly with NO2 to form nitric acid, which removes both radicals and NOx, and retards ozone formation. Under these conditions (VOC-limited), a decrease in NOx increases the rate and efficiency of ozone formation and may result in higher peak ozone levels in some locations within an air basin (“NOx disbenefit”). At a given level of VOC, there exists a NOx mixing ratio at which a maximum amount of ozone is produced. This optimum VOC/NOx ratio, expressed as a molar ratio of VOC in ppbC to NOx in ppbN, is about 10 and corresponds to the ridgeline in an isopleth plot of maximum ozone as a function of the initial VOC and NOx mixing ratios.
Since the mid-1970s many research studies have observed that ozone levels were higher on weekends than on weekdays in California's South Coast Air Basin (SoCAB) and other urban areas (San Francisco, Washington DC, Philadelphia, New York, and Chicago) even though the emissions of NOx, and to a lesser extent VOC, were lower on weekends (CitationElkus and Wilson, 1977; CitationHorie et al., 1979; CitationLevitt and Chock, 1976; CitationBlier et al., 1998; CitationAustin and Tran, 1999; CitationAltshuler et al., 1995; CitationPun et al., 2001; CitationFujita et al., 2003a, 2003b; CitationChinkin et al., 2003; CitationYarwood et al., 2003; CitationBlanchard and Tannebaum, 2004). Many of these studies have concluded that this weekend effect is associated with the nonlinearity in ozone formation and specifically to increases in VOC/NOx ratios on weekends relative to weekdays under VOC-limited conditions. Although ambient ozone levels have decreased substantially in the SoCAB since 1990, the magnitude and spatial extent of the weekend effect have become more pronounced within the Basin (CitationFujita et al., 2003b). By 2000, peak ozone levels in the central SoCAB were 30% and 50% higher on Saturdays and Sundays, respectively.
As motor vehicles are the largest category of both VOC and NOx emissions in an urban area, changes in ozone photochemistry, historic trends in ambient ozone levels, and the magnitude and spatial extent of the weekend ozone effect in the SoCAB have been closely linked to changes in vehicle emissions (CitationFujita et al., 2003b; CitationChinkin et al., 2003). However, past underestimations of VOC emissions relative to NOx have partly obscured these associations and expectations of future ambient trends based upon emission inventory projections. It is well established that mobile source emissions in the SoCAB for carbon monoxide and hydrocarbons were underestimated in past emission inventories by as much as a factor of 2–3 relative to NOx (CitationIngalls, 1989; CitationPierson et al., 1990; CitationFujita et al., 1992; CitationHarley et al., 1993). During the 1987 Southern California Air Quality Study (SCAQS) (CitationLawson, 1990), the on-road emission rates measured in the Van Nuys Tunnel were more than 2 times larger than those calculated by Emission Factors (EMFAC) (version 7E at the time) for hydrocarbons and CO (Ingall et al., 1989). Additionally, the ambient VOC/NOx ratios measured during SCAQS (∼8–10 in ppbC to ppb NOx) were about 2–2.5 times higher than the corresponding emission inventory ratios (∼4) (CitationFujita et al., 1992). Thus, the actual ambient VOC/NOx ratios were substantially greater (∼8–10 in ppbC to ppb NOx) than were indicated by the corresponding emission inventory (∼4).
The SCAQS database was used by the California Air Resources Board, the South Coast Air Quality Management District, and Carnegie Mellon University/California Institute of Technology for air quality model evaluations and all obtained predicted ozone values in 1987 that were much lower than measured values (CitationWagner and Wheeler, 1993; CitationChico et al., 1993; CitationHarley et al., 1993). Because ozone formation is most efficient at VOC/NOx ratios near 10, the actual rate of ozone formation was faster than expected from the base model results. Model performance was greatly improved in model sensitivity tests by increasing the total on-road motor vehicle nonmethane hydrocarbon (NMHC) emissions by a factor of 2.5 over the official inventory.
Modifications that were incorporated after the 1987 SCAQS into successive versions of EMFAC substantially increased all emissions (for a common base year). The ambient versus emission inventory reconciliation for the SoCAB was updated 10 yr later during the 1997 Southern California Ozone Study (SCOS97-NARSTO) (CitationCroes and Fujita, 2003) by comparing the ambient NMHC and nonmethan organic compound (NMOC) mixing ratios and NMHC/NOx and NMOC/NOx ratios with corresponding values from the Comprehensive Air Quality Model with Extensions (CAMx) model simulations of an ozone episode during the 1997 SCOS (CitationYarwood et al., 2003). Whereas the emission inventory NMHC/NOx ratios between 1987 and 1997 remained nearly constant at about 4, the ambient ratios dropped by more than a factor of 2 from 8.8 to about 4 due to greater reductions over this time of VOC emissions relative to NOx. The ambient ratios steadily decreased over the 10-yr period until they matched the emission inventory ratios, which had remained nearly constant over this same period. In contrast to the 1987 SCAQS, acceptable model performance was obtained during the 1997 SCOS. It appears from hindsight that the benefits of new vehicle emission standards and vehicle inspection and maintenance programs were overly optimistic in the 1980s and the expected reductions in VOC emissions from on-road motor vehicles may not have been fully realized until a decade later.
As part of an evaluation of the emission inventory and update of the 1987 and 1997 ambient versus inventory reconciliation analyses for the SoCAB, we conducted an on-road mobile source emissions study in August 2010 at the same traffic tunnel used in 1987 SCAS Tunnel Study (CitationFujita et al., 2012). The measured fleet-averaged, fuel-based emission factors were compared with the corresponding modeled factors using the U.S. Environmental Protection Agency (EPA) Motor Vehicle Emission Simulator (MOVES)2010a and MOBILE6.2 models, and CARB's EMFAC2007 emission model. A significant finding of the 2010 Van Nuys Tunnel Study was that measured NMHC-fuel-based emission factors were about 3.5 times higher during hot temperature periods (101–102 ˚F) than cool periods (71–72 ˚F). The increased emissions during hot periods were attributed to light hydrocarbons that are associated with headspace evaporative emissions. These results are generally consistent with an ambient source apportionment study that estimated a 6.5% ± 2.5% increase in the contributions of evaporative emissions from motor vehicles per degree Celsius increase in maximum temperature (CitationRubin et al., 2006). Although the NMHC emission rates predicted by all the three models were in good agreement with measurements during the cool periods, the running evaporative emissions for all three models exhibited insufficient sensitivity to temperature during hot periods, especially MOVES. The measured NMHC/NOx ratios were 3.1, 1.7, and 1.4 times higher than predicted by MOVES, MOBILE, and EMFAC, respectively, during hot periods. These results suggest that there is an overall increase in motor vehicle NMHC emissions on hot days that is not fully accounted for by the emissions models. Hot temperatures and concomitant higher ratios of NMHC emissions relative to NOx both contribute to more rapid and efficient formation of ozone.
This paper updates the historic trends (1980–2010) in ambient ozone and ozone precursor concentrations in the SoCAB and examines the evolution of the ozone-precursor relationship in the Basin. A chemical box model was used to simulate the effects of changes in precursor concentrations on ozone formation using day-of-week–specific initial precursor concentrations that were derived from measurements. This approach focuses the modeling solely on long-term changes in ozone formation chemistry (e.g., efficiency and rate of ozone formation) for the Basin by removing the effects of transport and inaccuracies in historic emission estimates on the estimated ozone mixing ratios. The objective of this retrospective analysis was to develop a conceptual model of ozone formation for the Basin based on ozone chemistry and historic trends in the temporal and spatial variations of ambient ozone levels within the Basin. In order to forecast future changes in ozone levels and chemistry, the current initial precursor concentrations for the box model were adjusted based on ratios of current and projected emissions. We also examined the potential uncertainties in the current emission inventory by reconciling the ambient VOC/NOx ratios with the corresponding ratios derived from the 2005 and 2009 emission data. Using the conceptual model of ozone formation in the Basin, we consider the implications of the observed discrepancies in the ambient and emission inventory VOC/NOx ratios on predictions of future ozone trends in the Basin.
Approach and Methods
Ambient ozone and precursor trends relative to past and future emission trends
The trends in daily maximum 8-hr average ozone mixing ratios from 1980 to 2010 were examined by day-of-week. Ambient ozone trends not only reflect changes in the temporal and spatial patterns of precursor emissions, but also the complex nonlinear relationship of the varying mixtures of VOC and NOx in the atmosphere with rates of ozone production and accumulation. We examined these historic changes by comparing the ozone trends for 1980–2010 by day of the week (Sunday and weekday) with the corresponding trends in ambient carbon monoxide (CO; and where available NMHC) and NOx, and CO/NOx and NMHC/NOx ratios for six SCAQMD monitoring stations in the SoCAB (). Sampling locations include downtown Los Angeles in the upwind western basin, three central basin sites in Azusa, Pomona, and Upland, a downwind eastern basin site in Riverside-Rubidoux, and a far downwind site at Crestline (1300 m elevation) in a forested area in the San Bernardino Mountains. The Basin design value for ozone is mostly driven by measurements at Crestline. These ambient trends in ozone precursors are also compared with historic trends in emission inventory data and future projections.
Modeling the relationships between ozone and its precursors
The EPA's chemical box model OZIPR (Ozone Isopleth Plotting Program, version R; CitationGery and Crouse, 1990) was used to examine the changes in the maximum ozone mixing ratios and rates of ozone formation that would be expected given the observed historic trends in the ambient VOC and NOx mixing ratios. The modeling procedure used examines changes in ozone photochemistry rather than the combined effects of chemistry and pollutant transport. These modeling results were used to examine the effects of historic changes in ozone precursor concentrations within the Basin on ozone chemistry and reconciled with past ambient ozone trends and used to project the effects of future changes in precursor emissions.
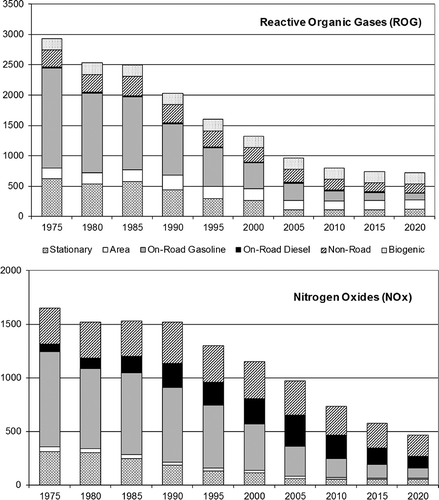
The initial and boundary conditions and other run conditions (e.g., mixing height, temperature, photolysis rate constants) within OZIPR were held constant from run to run, with the exception of the initial VOC and NOx mixing ratios and the scaled emissions based on these initial conditions. The Regional Acid Deposition Model Version 2 (RADM2) mechanism (CitationStockwell et al., 1988, Citation1991) was chosen for consistency with the ozone isopleth previously presented in CitationFujita et al. (2003a). The Sunday and weekday initial NMHC and NOx conditions were estimated for 1985, 1995, and 2005 by adjusting the eight-site mean ambient mixing ratios of NMHC and NOx measured on 11 summertime ozone episode days during the 1987 SCAQS ( in CitationFujita et al., 1992) by the trends in ambient CO and NOx relative to 1987. shows the historic and projected (1975–2020) summer reactive organic gas (ROG) and NOx emissions in the Basin with a base year of 2008 (CARB, 2012b). Extrapolations to 2020 are based on the CARB projected emission reductions from 2005 to 2020 of 10% for VOC and 50% for NOx. Additional simulations were made for 2020 with VOC and NOx reductions of 10% and 75%, respectively. Biogenic emissions were not included in these simulations because this study examined run-to-run variations due to change in anthropogenic emissions. Although this omission may underestimate the VOC/NOx ratio increases due to future NOx emission reductions, we expect the effects of this omission to be small. Isoprene mixing ratios are typically low during night and morning hours due the dependence of isoprene emissions on light and temperature (CitationFuentes, 2000) and only about a third of the daily isoprene emissions occur during the ozone accumulation period.
Ambient versus emission inventory reconciliation
The consistency between ambient concentrations and emission inventory data were examined by comparing early morning (6:00 a.m. to 9:00 a.m.) ambient CO/NOx and VOC/NOx ratios with the corresponding ratios derived from emission inventory data according to the same procedures used in the prior analyses in 1987 (CitationFujita et al., 1992) and 1997 (CitationYarwood et al., 2003). We compared the ambient 6:00 a.m. to 9:00 a.m. CO/NOx and VOC/NOx ratios measured at up to five South Coast Air Quality Management District (SCAQMD) monitoring stations with corresponding ratios from emission inventory data for all anthropogenic sources and for total on-road motor vehicle emissions. Hourly ambient CO and NOx data for SoCAB from 1980 to 2010 were obtained from the California Air Resources Board Aerometric Data Analysis and Management (ADAM) database. CO/NOx ratios were calculated as simple molar ratios of the hourly average values from selected sites for each day from May 1 to October 31. NMOC and NOx data from the Photochemical Assessment Monitoring Stations (PAMS) network were obtained from the EPA. Both CO/NOx and VOC/NOx ratios were calculated from all available data where NOx was >10 ppb. CO, VOC, and NOx mass emissions for the nine 5 × 5-km grid cells surrounding the AQMD monitoring sites and for the entire basin were obtained from the SCAQMD for Wednesdays, Saturdays, and Sundays for the month of July in years 2005 and 2009, as well as projections for 2014, and 2023. Molar VOC/NOx ratios were estimated from the emission inventory data using a molecular weight of 13.8 per carbon for VOC and the molecular weight of NOx was assumed to be for NO2.
Results and Discussion
Relationship between ambient ozone and precursor trends
shows trends in the four-site (Los Angeles N. Main, Azusa, Pomona, and Riverside-Rubidoux) 3-yr running average Wednesday and Sunday 6:00 a.m. to 9:00 a.m. ambient CO and NOx concentrations during May–October 1990–2010. CO steadily decreased during this period for both Sundays and Wednesdays, with total reduction of 77% on Wednesdays. NOx levels were relatively flat until about 2000, and then declined by 55% on Wednesdays, with 20% reduction between 1999 and 2003 and additional 30% reduction after 2007. The sharper decrease in recent years is likely related to the combined effects of the economic recession and implementation of the retrofit program for class 8 trucks operating in the Ports of Los Angeles and Long Beach. At the ports, the mean fleet age decreased from 12.7 yr in April 2008 to 2.5 yr in May of 2010, with a reduction in NOx emissions of 48% (CitationBishop et al., 2012). The trends in CO/NOx ratios show a steady decrease until about 2006, and then increased thereafter. The trend shown in of the average ambient NMOC levels measured at the SoCAB PAMS sites (Los Angeles N. Main, Azusa, Pomona, and Riverside-Rubidoux) shows that the decreasing trend on weekdays have leveled off after 2000. Combined with the decreasing trend in ambient NOx, the NMOC/NOx ratios have increased from about 4 in 2000 to about 5–6 in 2009.
Figure 3. Trends in four-site (Los Angeles N. Main, Azusa, Pomona, and Rubidoux) average summer (May–October 1990–2010) Wednesday and Sunday 6–9 a.m. ambient CO, NOx, and CO/NOx.
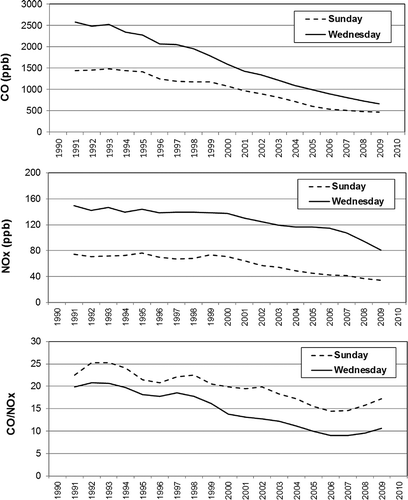
Figure 4. Trends in four-site (Los Angeles N. Main, Azusa, Pomona, and Rubidoux) average summer Wednesday and Sunday 6–9 a.m. ambient NMOC (ppbC) and NMOC/NOx ratios in the South Coast Air Basin.
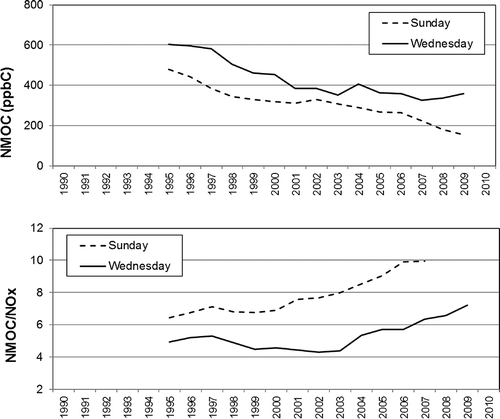
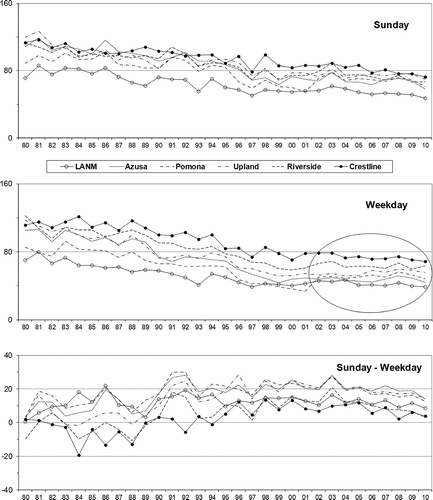
Figure 5 shows the 1980–2010 trends in summer mean daily maximum 8-hr ozone in the SoCAB on Sundays and weekdays. The trend for the most upwind site located in downtown Los Angeles is shown with open circles and data for the monitoring sites in the central basin are shown as broken lines. Ozone values are typically highest at the extreme downwind site at Crestline (shown with filled circles). Whereas the ozone trends at Crestline for both Sundays and weekdays show slight decreasing trends in the past decade, the weekday ozone levels at the central basin sites appear to be increasing in recent years. Note that the minima in the ozone trends at the central basin sites coincide with minima in the ambient VOC/NOx trends shown in The magnitude of the weekend ozone effect (Sunday to weekday) was at historic highs during this period. The weekend ozone effect has eased in recent years with increases in the ambient VOC/NOx ratios.
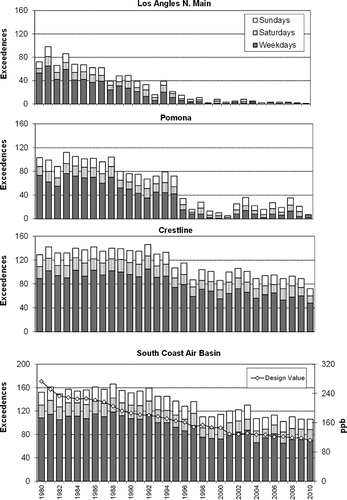
The trends of ozone exceedances, shown in , for Los Angeles N. Main, Pomona, and Crestline show that the Basin design values for ozone are mostly driven by measurements at Crestline. Whereas the numbers of exceedances continue to decline at Los Angeles N. Main and Crestline, the trend has reversed during the past decade at Pomona. Unlike the decade of the 1980s and most of the 1990s, a majority of the ozone exceedances at this central basin site occurred on weekends since the late 1990s. These observations illustrate how air quality statistics that are commonly used to track attainment of the ozone NAAQS (e.g., basin-wide design value, standard exceedances) can be potentially misleading indicators of basin-wide ozone trends.
Effect of changes in ambient VOC/NOx ratios on ozone formation
We present the results of a series of OZIPR simulations to show the effect of changes in precursor concentrations on the maximum ozone mixing ratios and formation rates in the South Coast Air Basin from 1980 to 2020. The trends in the initial VOC and NOx concentrations, which were estimated by methods previously described, are shown in The corresponding VOC/NOx ratios, which are also shown, is predicted to increase sharply between 2010 and 2020 (from 3.8 to 6.7 on weekdays and from 6.5 to 11.1 on Sundays). The OZIPR-simulated time-dependent ozone mixing ratios and ozone formation rates (ppb/hr) are shown in for a weekday and Sunday in 1985, 1995, 2005, and 2020. presents the ozone formation rates, maximum ozone mixing ratios, products of photooxidation of the OZIPR simulations, and the indicator ratios (CitationSillman, 1995), with those exceeding the threshold for NOx limitation with shaded background.
Table 1. Ozone, products of photooxidation, and indicator ratiosFootnote a predicted by box model simulations for 1985, 1995, 2005, and 2020 Footnote b
Figure 7. Mean 6–9 a.m. NMHC and NOx mixing ratios in the SoCAB during ozone episode days referenced to the 1987 SCAQS for 2010 and earlier based on ambient CO and NOx trends. Extrapolations to 2020 based on projected emissions from 2005 to 2020 of −10% NMHC and −40% NOx.
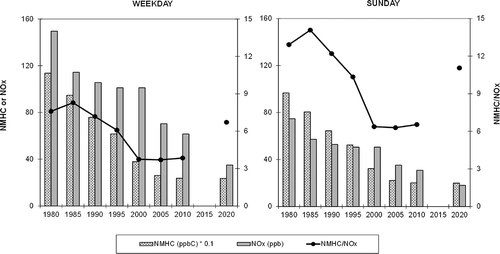
Figure 8. Predicted ozone mixing ratios (ppm) and formation rates (ppb/hr) from box model ozone simulations using the initial NMHC and NOx mixing ratios shown in Figure 7.
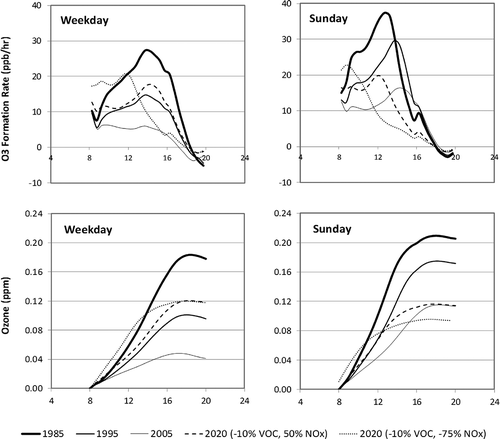
The relative changes in predicted ozone levels and magnitude of weekend-to-weekday differences agree well with the observed trends for 1985–2005. Note the evolution in the magnitude of weekend effect, with the largest effect in 1995 and 2005. The projected emission changes call for a much greater reduction in NOx than VOC. Weekday maximum 1-hr ozone levels in 2020 are projected to be similar to weekend levels in 2005, which appear to be consistent with the direction of the recent trends shown in These results are most applicable to the central basin where the maximum concentrations are most dependent on in situ production as oppose to location such as Crestline where transport of ozone from upwind areas of the Basin is more important.
Figure 5. Trends in summer Sunday, weekday, and Sunday minus weekday mean maximum 8-hr ozone (ppb) during May–October 1980–2010 at Los Angeles N. Main, Azusa, Pomona, Upland, Riverside, and Crestline.
The changes in emissions from 1985 to 2005 have successively decreased the rates of ozone formation on both weekdays and Sundays. The changes in the rates are reflected in the simulated maximum ozone mixing ratios and measured ambient trends. In contrast, the projected changes by 2020 of the base emission reduction scenario (−10% VOC and −50% NOx) sharply increases the maximum ozone mixing ratios and formation rates on weekdays by about a factor of 3 to pre-1995 weekday levels and 2005 Sunday levels. The larger NOx reduction scenario (−75% from 2005 to 2020) led to a precursor or chemically limited condition on both weekdays and Sundays. Although peak ozone formation rate is reached earlier in this case, the initial rates are greater than the 2020 base emission reduction scenario. Although the more aggressive NOx reduction scenario in 2020 will likely result in lower maximum ozone levels in far downwind areas such Crestline (the current ozone design value site), these projected changes in ozone formation rates suggest that peak ozone levels will shift to locations further west in the Basin. These results are consistent with the recent increasing ozone trends in the central basin shown in
Indicator ratios (NOy, H2O2/HNO3, O3/(NOy − NOx)) in suggest that ozone formation will approach NOx limitation on weekdays by 2020, which is consistent with most indicators switching from VOC sensitivity to NOx sensitivity on weekdays. However, the model results show that additional 25% NOx reductions between 2010 and 2020 from 50% to 75% will result in very little change in ozone on weekdays, with even greater shift in the location of peak ozone further west. Most indicator ratios on Sundays suggested NOx sensitivity during the 1980s and 1990s, which turned to VOC sensitivity during the past decade. By 2020, ozone formation is projected to return to NOx sensitivity on Sundays.
The estimated 1985, 1995, and 2005 and projected 2020 initial weekday and weekend VOC and NOx concentrations are plotted on the ozone isopleth diagram () previously presented in CitationFujita et al. (2003a) to illustrate the evolution of the ozone-precursor relationships in the SoCAB. We previously found that this O3 isopleth diagram was consistent with the historic ozone-precursor relationships from 1987 to 2000. This diagram is based on 650 box model simulations of the maximum ozone mixing ratio reached over a fixed irradiation period for typical midsummer conditions in Los Angeles for varying initial mixing ratios of VOC and NOx (CitationStockwell et al., 1988). The simulations represent the effects of only chemistry on ozone formation; additional emissions during the simulation period and the afternoon ventilation of the SoCAB are not included.
Figure 9. Ozone isopleth diagram for summer conditions in Los Angeles with initial weekday and Sunday NMHC and NOx mixing ratios from Figure 7. The two pairs of lines represent 2010 to 2020 changes of −10% VOC and −50% NOx (indicated by box) and −75% NOx (indicated by end of arrow). The left pair of lines represent an underestimation of VOC emission of a factor of 2 relative to the right pair of lines.
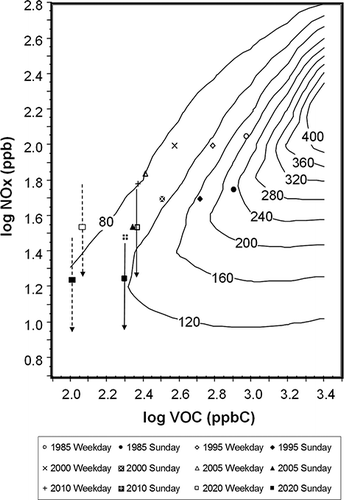
Figure 9 shows that reductions in hydrocarbon emissions led to sharp reductions in ozone for both weekends and weekdays during the period 1985–2005. Between 2005 and 2010, reductions in NOx and hydrocarbon emissions caused the system to move more parallel to the isopleths and therefore ozone decreases were much less than in previous years. These simulations are consistent with monitoring observations. Figures show that differences between the 2020 weekend and weekday ozone concentrations will be much less than they were in 2010, although the weekend ozone has a greater dependence on the NOx reductions than the weekday ozone.
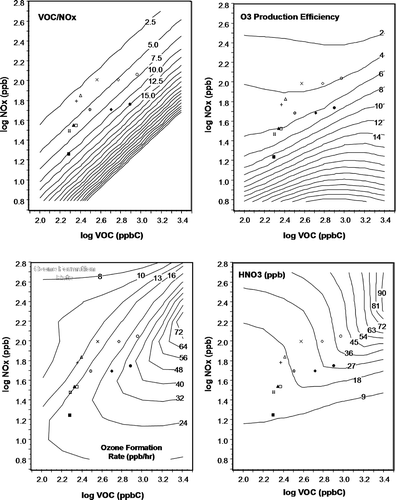
The initial VOC and NOx concentrations are similarly plotted on isopleths of VOC/NOx ratios, ozone production efficiency, rates of ozone formation, and maximum nitric acid concentrations () that were also previously presented in CitationFujita et al (2003a). The trend of increasing VOC/NOx ratios from 2005 to 2020 following decreasing VOC/NOx ratios during 1985–2005 mirrors the trends in ozone mixing ratios, production efficiency, and formation rates. The NOx emission reductions have resulted in sharp reductions in nitric acid () and associated particulate nitrate () during the past decade.
Ambient versus emission inventory reconciliation
compares the mean weekday ambient NMOC/NOx ratios measured at the SoCAB PAMS sites in the summer (July through September) of 2009 with the corresponding ratios derived from the average July 2009 emission estimates for the nine 5 × 5-km grid cells surrounding each monitoring site. The results of our prior analyses in 1987 and 1997, which are also shown in , apply to weekdays, as 10 of 11 measurement days during SCAQS were weekdays, and all 4 days during the August 4–7 SCOS97-NARSTO episode were weekdays. As noted in the introduction, the ambient NMOC/NOx ratios in the SoCAB were in agreement with the emission inventory ratios in 1997 after being more than a factor of 2 higher in 1987. Since 1997, the average ambient NMOC/NOx ratios increased from 3.9 in 1997 to 5.4 in 2009. At the same time, the average of the 9-cell emission inventory ROG/NOx ratios for the corresponding locations decreased from 3.7 in 1997 to 2.8 in 2009. As a consequence of the diverging trends in the ambient and emission inventory VOC/NOx ratios, the ambient ratios are again about a factor of 2 higher than the emission inventory ratios in 2009 (i.e., VOC emissions are underestimated by a factor of 2 relative to NOx). With greater projected reductions in NOx emissions relative to ROG, ROG/NOx ratios for the total SoCAB emission inventory is expected to increase to 3.0 in 2014 and to 4.0 in 2023 ().
Table 2. Comparisons of ambient NMOC/NOx ratios measured at the SoCAB Photochemical Assessment Monitoring Stations with corresponding emissions inventory (E1) ratios for the nine 5 × 5-km grid cells surrounding the monitoring site for the month of July in 2009
Table 3. Trends in NMHC/NOx ratios of the average emissions in the month of July for the nine 5 × 5-km grid cells surrounding each of the five PAMS sites, five-site mean, and for basin-wide total and on-road motor vehicle (ORMV) emissions
The lower emission inventory ROG/NOx ratios relative to the ambient ratios in 2009 may result from either overestimation of NOx emissions or underestimation of ROG emissions. With the continued decreases in exhaust emissions of hydrocarbons from on-road vehicles, evaporative emissions are an increasing fraction of the total motor vehicle hydrocarbon emission inventory, especially on hot, ozone conducive days. In the 2010 Van Nuys Tunnel Study, we found that the average measured NMHC fuel-based emission factors were 1.3–1.6 times higher than estimated by EMFAC2007 during warmer (92–103 ˚F) ambient condition (CitationFujita et al., 2012). The results suggest that the models, especially MOVES, may not fully account for running evaporative emissions at higher ambient temperature possibly due to an underprediction, at these higher temperatures, of the vapor venting, fuel permeation, or in combination with fuel system malfunctions, such as leaks, missing gas caps, or faulty canister purge valves.
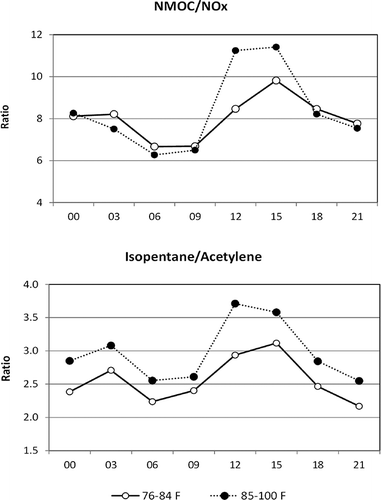
shows the combined mean of the diurnal variations in NMOC/NOx and isopentane/acetylene (ratio of a component of gasoline to a major combustion product in vehicle exhaust) at Los Angeles N. Main and Azusa during summer 2009 for days with daily maximum temperature at downtown Los Angles of less than versus greater than or equal to 85 ˚F. The midday NMOC/NOx and isopentane/acetylene ratios were both about 30% higher during the warmer days. The effect of ambient temperature on NMOC/NOx ratios and results of the 2010 Van Nuys Tunnel Study are generally consistent with an ambient source apportionment study that estimated a 6.5% ± 2.5% increase in the contributions of evaporative emissions from motor vehicles per degree Celsius increase in maximum temperature (CitationRubin et al., 2006). These results suggest that current differences in the ambient and emission inventory VOC/NOx ratios may be related to possible underestimation by motor vehicle emissions model of evaporative emissions during hot days.
Figure 12. The combined mean diurnal variations in NMOC/NOx and isopentane/acetylene at Los Angeles N. Main and Azusa during summer 2009 for days with daily maximum temperature at downtown Los Angles of less than versus greater than or equal to 85 ˚F.
Accurate emissions estimates are necessary to reliably forecast the response of ambient ozone levels to future reductions in VOC and NOx emissions. Reconciliation of ambient VOC/NOx ratios with the corresponding ratios derived from the 2005 and 2009 emission data shows that ambient ratios were about a factor of 2 higher than the emission inventory ratios in 2009. The two pairs of lines in illustrate the potential implications of this underestimation in VOC emissions. The VOC mixing ratios for the right pair of solid lines are a factor of 2 higher that the left pair of dotted lines. The lines represent the 2010 to 2020 changes due to a 50% NOx reduction (indicated by box) and 75% NOx reduction (indicated by end of arrow) for weekday (open box) and Sunday (filled box). Due to the nonlinearity in the ozone-precursor relationship, the four lines show differing ozone trends and absolute and relative changes between 2010 and 2020. The location of the end points relative to the ridgeline in the ozone isopleth is especially significant for a NOx-focused ozone control strategy. Air quality models using emission inventories that underestimate VOC emissions relative to NOx may lead to inaccurate forecasting of the consequence of emission reductions.
Conclusions
Historic changes in the spatial and day-of-week variations in ozone levels within the SoCAB are consistent with the expected changes in the rate and efficiency of ozone formation given the ambient trends in VOC and NOx concentrations and VOC/NOx ratios. The minima in NMOC/NOx ratios from about 2000–2004 coincided with historically low average ozone levels in the central basin and the strongest observed weekend ozone effect (see lower panel in ). Although ozone levels have slowly decreased during the past decade at Crestline, the site that dominates the Basin ozone design value, many central basin locations show measurable increases during the past 5 yr and concomitant decreases in the Sunday-to-weekday differences in ozone levels. These observations illustrate that the trend in the Basin design value can be a misleading indicator of the basin-wide ozone trends.
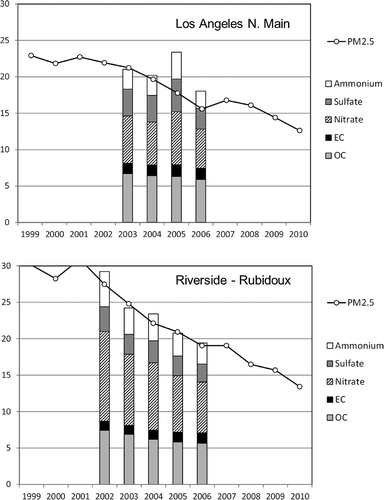
Based upon projected reductions in emissions in 2020 from 2010 (−10% VOC and −50% NOx), ozone formation in the Basin is predicted to be less HC-limited but still in the NOx-disbenefit region. Although the Basin maximum ozone levels will be nearly unchanged on weekends between now and 2020, ozone will likely increase during weekdays, especially in the central basin and will be equal to or slightly greater than on weekends. Weekdays in 2020 will be similar to Sunday in 2005. Although a greater NOx reduction scenario in 2020 of −75% will result in even higher initial ozone formation rates, precursor limitation is reached quickly, leading to a further shift westward in the location of peak ozone levels. However, ozone levels will likely be lower in downwind areas where transport is more important than local production of ozone. Future planned reductions in NOx should be accompanied by additional reductions in VOC to offset potential NOx disbenefit that could occur. Although reductions in NOx emissions in the Basin have resulted in substantial decreases in nitrate and PM2.5 concentrations, further reduction may level off during the next decade due to more efficient oxidant formation.
The ambient NMOC/NOx ratios in the SoCAB were in agreement with the emission inventory ratios in 1997 after being more than a factor of 2 higher in 1987. Since 1997, the average ambient NMOC/NOx ratios are again about a factor of 2 higher than the emission inventory ratios in 2009. The apparent underestimation of VOC emissions relative to NOx is consistent with the 2010 Van Nuys Tunnel Study, which suggests that there is an overall increase in motor vehicle VOC emission on hot days that is not fully accounted for by the mobile source emissions models. Air quality models using emission inventories that underestimate VOC emissions relative to NOx may lead to inaccurate forecast of the consequence of NOx emission reductions.
Acknowledgments
This project was funded by the Department of Energy Office of Vehicle Technologies (Dr. James Eberhardt, Chief Scientist) through the National Renewable Energy Laboratory. The authors thank Joe Cassmasi and Xinqiu Zhang of the South Coast Air Quality Management District for the modeling emission inventory data.
References
- Altshuler , S.L. , Arcado , T.D. and Lawson , D.R. 1995 . Weekend vs. weekday ambient ozone concentrations: Discussion and hypotheses with focus on Northern California . J. Air Waste Manage. Assoc , 45 : 967 – 972 . doi: 10.1080/10473289.1995.10467428
- Austin , J. and Hien , T. 1999 . A Characterization of the Weekend-Weekday Behavior of Ambient Ozone Concentrations in California , Sacramento , CA : Technical Support and Planning Division, California Air Resources Board .
- Blanchard , C.L. and Tanenbaum , S. February 24, 2004 2004 . VOC and NOx limitation of ozone formation at monitoring sties in Illinois , February 24, 2004 , Indiana, Michigan, Missouri, Ohio, and Wisconsin : Final report submitted by Envair to the Lake Michigan Air Directors Consortium . 1998–2002
- Bishop , G.A. , Schuchmann , B.G. and Stedman , D.H. 2012 . Emission changes resulting from the San Pedro Bay, California ports truck retirement program . Environ. Sci. Technol , 46 : 551 – 558 . doi: 10.1021/es202392g
- Blier , W. , Winer , A.M. , Hansen , D. and Chavira , R. February, 1998 1998 . Analysis of weekday/weekend differences in ambient air quality and meteorology in the South Coast Air Basin. Final report prepared by the Department of Atmospheric Sciences and Environmental Science and Engineering , February, 1998 , 95 – 334 . Sacramento , CA : University of California, Los Angeles for the California Air Resources Board . under contract no
- California Air Resources Board. 2012a. Ozone trend summary for the South Coast Air Basin http://www.arb.ca.gov/adam/trends/trends2.php (http://www.arb.ca.gov/adam/trends/trends2.php)
- California Air Resources Board. 2012b. Historic and projected (1975–2020) summer reactive organic gas and NOx emissions in tons per day for the South Coast Air Basin with 2008 base year http://www.arb.ca.gov/app/emsinv/fcemssumcat2009.php (http://www.arb.ca.gov/app/emsinv/fcemssumcat2009.php)
- Chico , T. , Bassett , M. , Cassmassi , J. , Mitsutomi , S. , Zhang , X. and Hogo , H. 1993 . “ Application of the Urban Airshed Model for a SCAQS episode in the South Coast Air Basin ” . In Proceedings, Southern California Air Quality Study—Data Analysis. A&WMA Specialty Conference, VIP-26 , Los Angeles, CA, July 21–23, 1992, 257 – 263 . Pittsburgh , PA : Air & Waste Management Association .
- Chinkin , L.R. , Coe , D.L. , Funk , T.H. , Hafner , H.R. , Roberts , P.T. , Ryan , P.A. and Lawson , D.R. 2003 . Weekday versus weekday activity pattern for ozone precursor emission in California's South Coast Air Basin . J. Air Waste Manage. Assoc , 53 : 829 – 843 . doi: 10.1080/10473289.2003.10466223
- Croes , B.E. and Fujita , E.M . 2003 . The 1997 Southern California Ozone Study (SCOS97-NARSTO): Introduction and perspective . Atmos. Environ , 37 ( Suppl. 2 ) : S3 – S26 . doi: 10.1016/S1352-2310(03)00378-9
- Elkus , B. and Wilson , K.R. 1977 . Photochemical air pollution: Weekend-weekday differences . Atmos. Environ , 11 : 509 – 515 . doi: 10.1016/0004-6981(77)90067-1
- Fuentes , J.D. , Lerdau , M. , Atkinson , R. , Baldocchi , D. , Botteneheim , J.W. , Ciccioli , P. , Lamb , B. , Gercon , C. , Gu , L. , Guenther , A. , Sharkey , T.D. and Stockwell , W.R. 2000 . Biogenic hydrocarbons in the atmospheric bounday layer. A review . Bull. Am. Meteorol. Soc , 81 : 1537 – 1575 . doi: 10.1175/1520-0477(2000)081<1537:BHITAB>2.3.CO;2
- Fujita , E.M. , Campbell , D.E. , Zielinska , B. , Chow , J.C. , Lindhjem , C.E. , DenBleyker , A. , Bishop , G.A. , Schuchmann , B.G. , Stedman , D.H. and Lawson , D.R. 2012 . Comparison of the MOVES2010a, MOBILE6.2 and EMFAC2007 mobile source emissions models with on-road traffic tunnel and remote sensing measurements. . J. Air Waste Manage. Assoc , 62 : 1134 – 1149 . doi: 10.1080/10962247.2012.699016
- Fujita , E.M. , Campbell , D.E. , Zielinska , B. , Sagebiel , J.C. , Bowen , J.L. , Goliff , W. , Stockwell , W.R. and Lawson , D.R. 2003a . Diurnal and weekday variations in source contributions of ozone precursors in California's South Coast Air Basin . J. Air Waste Manage. Assoc , 53 : 844 – 863 . doi: 10.1080/10473289.2003.10466226
- Fujita , E.M. , Croes , B.E. , Bennett , C.L. , Lawson , D.R. , Lurmann , F.W. and Main , H.H. 1992 . Comparison of emission inventory and ambient concentration ratios of CO, NMOG, and NOx in California's South Coast Air Basin . J. Air Waste Manage. Assoc , 42 : 264 – 276 . doi: 10.1080/10473289.1992.10466989
- Fujita , E.M , Stockwell , W.R. , Campbell , D.E. , Keislar , R.E. and Lawson , D.R. 2003b . Evolution of the magnitude and spatial extent of the weekend ozone effect in California's South Coast Air Basin, 1981–2000 . J. Air Waste Manage. Assoc , 53 : 802 – 815 . doi: 10.1080/10473289.2003.10466225
- Gery , M.W. and Crouse , R.R. 1990 . “ User's guide for executing OZIPR. EPA-9D2196NASA ” . In Research Triangle Park , NC : U.S. Environmental Protection Agency .
- Harley , R.A. , Russell , A.G. , McRae , G.J. , Cass , G.R. and Seinfeld , J.H. 1993 . Photochemical modeling of the Southern California Air Quality Study . Environ. Sci. Technol , 27 : 378 – 388 . doi: 10.1021/es00039a019
- Horie , Y. , Cassmassi , J. , Lai , L. and Gurtowski , L. 1979 . “ Weekend/weekday differences in oxidants and their precursors ” . In Report prepared by Technology Services Corporation for the U.S , Environmental Protection Agency under contract no . 68-02-2595
- Ingalls , M.N. , Smith , L.R. and Kirksey , R.E. June 1989 1989 . Measurements of on-road vehicle emission factors in the California South Coast Air Basin— , Volume I , June 1989 , Atlanta , GA : Regulated emissions. Report no. SwRI-1604, prepared by Southwest Research Institute for the Coordinating Research Council .
- Lawson , D.R. 1990 . The Southern California Air Quality Study . J. Air Waste Manage. Assoc , 40 : 156 – 165 . doi: 10.1080/10473289.1990.10466671
- Levitt , S.B. and Chock , D.P. 1976 . Weekend-weekday pollutant studies of the Los Angeles Basin . J. Air Pollut. Control Assoc , 26 : 1091 – 1092 . doi: 10.1080/00022470.1976.10470368
- Pierson , W.R. , Gertler , A.W. and Bradow , R.L. 1990 . Comparison of the SCAQS tunnel study with other on-road vehicle emission data . J. Air Waste Manage. Assoc , 40 : 1495 – 1504 . doi: 10.1080/10473289.1990.10466799
- Pun , B.K. , Seigneur , C. and White , W. June 2001 2001 . Data analysis for a better understanding of the weekday/weekend ozone and PM differences, Final report prepared by Atmospheric and Environmental Research, Inc , June 2001 , San Ramon , CA : under CRC contract no. A-36B for the Coordinating Research Council . Alpharetta, GA
- Rubin , J.I. , Keen , A.J. , Harley , R.A. , Millet , D.B. and Goldstein , A.H. 2006 . Temperature dependence of volatile organic compound evaporative emissions from motor vehicles . J. Geophys. Res , 111 : D03305 doi: 10.1029/2005JD006458
- Sillman , S. 1995 . The use of NOy, H2O2, and HNO3 as indicators for ozone-NOx-hydrocaron sensitivity in urban locations . J Geophys. Res , 100 : 14,175 – 14,188 . doi: 10.1029/94JD02953
- South Coast Air Quality Management District . July 2012 2012 . Draft 2012 air quality management plan , July 2012 , Diamond Bar , CA : South Coast Air Quality Management District .
- Stockwell , W.R. , Lawson , C.V. , Saunders , E. and Goliff , W.S. 2012 . A review of tropospheric atmospheric chemistry and gas-phase chemical mechanisms for air quality modeling . Atmosphere , 3 : 1 – 32 . doi: 10.3390/atmos3010001
- Stockwell , W.R. , Middleton , P. , Chang , J.S. and Tang , X. 1991 . The second generation regional acid deposition model chemical mechanism for regional air quality modeling . J. Geophys. Res , 95 : 16343 – 16367 . doi: 10.1029/JD095iD10p16343
- Stockwell , W.R. , Milford , J.B. , McRae , G.J , Middleton , P. and Chang , J.S. 1988 . Nonlinear coupling in the NOx-SOx-reactive organic system . Atmos. Environ , 22 : 2481 – 2490 . doi: 10.1016/0004-6981(88)90479-9
- Wagner , K.K. and Wheeler , N.J.M. 1993 . “ Multi-species evaluation of the Urban Airshed Model with the SCAQS database ” . In Proceedings of the International Specialty Conference on the Southern California Air Quality Study Data Analysis, Los Angeles, CA, July 21–23, 1992, VIP-26 , 264 – 269 . Pittsburgh , PA : Air & Waste Management Association .
- Yarwood , G. , Tran , C. , Lau , S. and Fujita , E. September 29, 2003 2003 . Impact of updates to on-road mobile source emission factor models (EMFAC) for the Los Angeles region: Ozone model sensitivity and ambient/inventory reconciliation , September 29, 2003 , Alpharetta , GA : Final report prepared for the Coordinating Research Council .
