Abstract
The 2012 Critical Review Discussion complements CitationWilson, (2012), provides pointers to more detailed treatments of different topics and adds additional dimensions to the area of “energy”. These include broader aspects of technologies driven by fuel resources and environmental issues, the concept of energy technology innovation, evolution in transportation resources, and complexities of energy policies addressing carbon taxes or carbon trading. National and global energy data bases are identified and evaluated and conversion factors are given to allow their comparability.
Introduction
The 2012 Critical Review (CitationWilson, 2012) summarized two important aspects of “energy technology”: (1) the evolution of technologies from a historical perspective, and (2) a non-tax policy option to incentivize the deployment of new technologies. These two topics are elements of a much bigger set of formidable topics dealing with energy and energy policy for the United States. The interactions between energy production and the environment are complex and often poorly understood. Data analysis and models applied by different researchers often achieve contradictory results, depending on the data used and the assumptions made.
This discussion provides pointers to more detailed treatments of different topics with the caveat that no single reference provides a complete and objective treatment of a given energy technology, let alone the trade-offs involved in substituting one technology for another. The discussants add some dimensions to the area of “energy.” These include broader aspects of technologies driven by fuel resources and environmental issues, the concept of energy technology innovation, and evolution in transportation resources.
Energy Units and Conversion Factors
Energy is expressed in a variety of different units that are not completely defined or equivalent. provides conversion factors and identifies some of the assumptions made in making the conversions. In the International System of Units (SI, metric), 1 joule (J) is defined as the energy (work) needed to accelerate a 1-kg mass at a rate of 1 m s−2 over a distance of 1 m. The British thermal unit (BTU), commonly used to rate the capacities of heating and cooling units, was originally defined as the amount of energy needed to raise the temperature of 1 lb (0.454 kg) of water from 39°F to 40°F (3.8°C to 4.4°C). The BTU was later defined more precisely as 1055 J. The SI counterpart is the calorie, the energy input to raise the temperature of 1 g of water by 1°C, and equals 4.1855 J. One watt (W), equal to 1 J s−1, is a unit of power, although it is often used as a unit of total energy in the form of kilowatt-hours (kW-hr) or megawatt-hours (MW-hr). Horsepower (HP) is also a unit of power defined as 746 W, which is expressed as HP-hr for total energy required or generated. HP-hr is commonly used to rate the energy produced by diesel engines, and diesel exhaust emission standards are defined with respect to this unit (CitationDieselNet, 2012a). CitationDickenson (1936) recounts how James Watt defined his steam engine royalties as 33% of the savings in coal for performing the same work with the less efficient Newcomen steam engine. To determine the cost to a brewer who previously raised water with horses, Watt determined that a brewery horse was capable of approximately 33,000 ft-lb min−1 of power output and specified his engine output in equivalent HP.
Table 1. Conversion factorsFootnote a among different units to measure energy content and output (CitationAPS, 2012; CitationBP, 2012; CitationNRC, 2008)
Conversions to equivalent tons of coal and oil require assumptions concerning fuel composition, specific density, and non-hydrocarbon content, some of which are expressed in the notes to and by the CitationUnited Nations (2010). The United States uses high heating values, the amount of heat produced by complete combustion of a unit quantity of fuel assuming that all combustion products are cooled to the temperature prior to combustion and that water vapor produced by the combustion has condensed to a liquid. China, on the other hand, uses low heating values that subtract the latent heat of water vaporization. Conversion factors are given in the notes to .
Databases for Energy Resources and Production
Energy trends are tracked for several countries in international and national databases. The CitationInternational Energy Agency (IEA, 2011) collects annual statistics in millions of metric tonnes of oil equivalent from most countries to provide an annual summary of worldwide primary energy supplies (coal/peat, oil, natural gas, nuclear, hydro, biofuels and waste, and other) from 1971 to near present. Summary information is presented for selected countries, with more detailed statistics, available by subscription, giving more specific uses of the different types of energy input. Estimates of regional CO2 emissions are made based on the fuels used. The United Nations Statistics Division (CitationUnited Nations, 2010) provides an annual worldwide report with limited country-specific information in several of the units. Especially useful is a set of conversion tables for country-specific energy statistics that amplifies the information in by showing different assumptions made by different countries. British Petroleum (CitationBP, 2011) publishes an annual compilation of energy extraction, consumption, and trade movements for oil, natural gas, coal, nuclear energy, hydroelectricity, and renewable energy with country-specific figures. Units are specific to the energy source, and conversion factors such as those in need to be applied for comparison among different sources.
The most accurate and detailed U.S. energy statistics are compiled and disseminated by the CitationEnergy Information Administration (EIA, 2012) in quadrillion BTUs. Detailed tables can be downloaded and analyzed for energy inputs and outputs, consumption by different energy sectors (e.g., industry, transportation, and domestic), costs of different energy sources, and projections based on different energy policies. Assumptions for future projections are specified. The Institute for Energy Research (IER, 2011) compares energy production and use for the United States, Canada, and Mexico and provides useful visual summaries, although much of the accompanying text is industry oriented. The European Commission (CitationEC, 2012) provides similar databases and annual reports on energy consumption and use in millions of metric tonnes of oil equivalent for members of the European Union.
Many other countries maintain Web-based energy databases, several of which are referenced by the aforementioned compilations. Of the rapidly developing economies, India (CitationTERI, 2012) and China (CitationNational Bureau of Statistics of China, 2012) are of greatest importance for global consumption and effects. The Indian database combines data from the EIA with country-wide information in a variety of units. The Chinese database reports in millions of metric tonnes of coal equivalent.
Prospectus on Energy Sectors
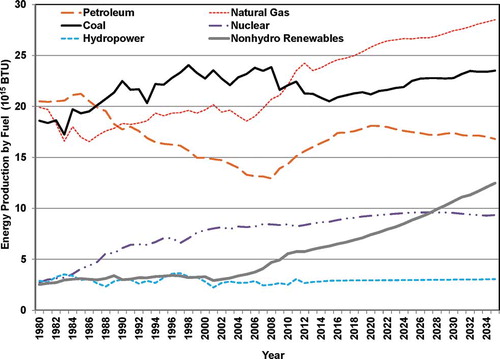
The review (CitationWilson, 2012) treated a portfolio of technologies, most of which are likely to be operational into the next 25 years. The review (CitationWilson, 2012) did not specify those technologies that should have priorities for development, but there is a large literature on such choices that vary with opinions of experts and the state of technology for the time (CitationAnadon et al., 2011; CitationEdmonds et al., 2007; CitationNRC, 2009a; Citation2010a; CitationRMI, 2012; CitationU.S. DOE, 2011). Projections in the 1970s and before indicated that fossil fuels would be the primary drivers for energy well into the mid-21st century (CitationHidy and Spencer, 1994; CitationLongwell et al., 1995). indicates that fossil fuels will continue to dominate future U.S. energy use, but the use of coal and the use of petroleum are estimated to level off as relatively inexpensive natural gas from shale deposits (CitationWeber and Clavin, 2012) comes to market and use of non-hydro renewables (including biofuels) increases (CitationDincer, 2000). The implications of this analysis are critical in thinking about the energy future of the United States and the deployment of new technologies aimed at addressing national security, environmental, and other issues.
Figure 1. U.S. Energy production by fuel, 1980–2035 (EIA, 2012). The major expansion of natural gas use is dependent on continued success with domestic shale sources and maintaining a low cost.
The issue of current and future availability of North American energy supplies from conventional and unconventional oil and gas is broader than has been suggested by the review (CitationWilson, 2012). The historical focus of energy supply has been on conventional reservoir-based oil and natural gas. Unconventional (by current standards) sources of oil and natural gas are emerging, such as those found in the oil sands and heavy oil deposits in Canada, of shale gas and shale oil deposits, and coal-bed methane. Considering the abundance of these resources, it is likely that North American energy supplies have been underestimated in the past (EIA, 2012; IER, 2011; CitationNRCAN, 2011). summarizes recent estimates of North American supplies and currently recoverable resources. The “recoverable” amount is highly dependent on differences between production costs and revenues; these numbers can change rapidly as improved technology reduces production costs, rising fuel prices affect demand, and new regulatory incentives come into play. For oil, ∼85% of the recoverable North American reserves are in Canada, with 90% of those found in the oil sands region of northern Alberta (CitationGray et al., 2009). IER (2011) estimates that if recoverable oil and natural gas resources were fully developed, North America not only could become energy independent, but could be a net energy exporter. Natural gas resources could be enhanced by the eventual extraction of natural gas from oceanic methane hydrates (CitationHester and Brewer, 2009; IER, 2011; CitationKvenvolden, 1988; CitationKvenvolden and Lorenson, 2001; CitationLee and Holder, 2001), estimated to contain more than 21 × 1015 m3 of natural gas.
Table 2. North American fossil fuel reservesFootnote a (IER, 2011)
Environmental challenges arising from North American production and use, while being recognized, need an innovative, integrated, and holistic management approach. For example, Alberta's Athabasca Oil Sands Region in Canada has established the Wood Buffalo Environmental Association (WBEA) (CitationMacEachern, 2010; CitationWBEA, 2011) as an independent, not-for-profit, community-based, multi-stakeholder association with representatives from government, industry, local communities, aboriginal groups, and nongovernmental organizations. WBEA's mission is to “monitor air quality and air quality related environmental impacts to generate accurate and transparent information which enables stakeholders to make informed decisions.” Its terrestrial and human exposure monitoring and research activities are science based, intended to advance knowledge and understanding for proactive environmental management beyond the minimum regulatory requirements set by government (CitationPercy, 2010, Citation2012).
Energy Technology Innovation
The review (CitationWilson, 2012) offers a partial view of energy-technology innovation (ETI) as it has contributed to vastly improved quality of energy services, reductions in primary energy forms for production of specific services, large reductions in real costs of these services, and in many cases large reductions in environmental impacts per unit of service provided. ETI is defined as a set of processes leading to new or improved energy technologies that can augment energy resources, enhance the quality of energy service, and reduce economic, environmental or political costs associated with energy supply and use. CitationGallagher et al. (2006) identify three major worldwide challenges that will require aggressive approaches to ETI in the future: (1) shrinkage of the economic vulnerability associated with oil dependence, balance-of-payment deficits, and foreign policy; (2) lack of modern, efficient energy services for more than 2 billion people worldwide; and (3) provision of energy without disruption of the global environment, including climate alteration by emissions from fossil fuel use. Post-1980 attempts to address these issues have led to some progress in national and international policies, but the results to date have achieved only marginal success for the developed and developing world.
ETI includes not only research and development (R&D), but also the steps to attain widespread acceptance. The latter depends strongly on cost and reliability and less on environmental protection. R&D investments have followed a portfolio approach as a hedge against projecting winners and losers in the marketplace (Edmonds et al., 2007). The investment in ETI by both the private and public sectors is a small fraction of the total cash flow of the energy sector. The introduction of new energy technologies into the supply sectors is capital intensive so that the private sector conventionally relies on investment from government resources to assist in these developments through demonstrations (Anadon et al., 2011; U.S. DOE, 2011). Similarly, technology “forcing” in the transportation sector has been promoted by government support, especially in areas of alternate fuels, efficiency, and electrification (CitationAmjad et al., 2010; CitationNRC, 2003, Citation2009b, Citation2010a, Citation2010b, Citation2011a). Anadon et al. (2011) conclude that government R&D and policies are seriously underfunded and propose large increases in public energy-related R&D funding. However, the investment neglects the question of market penetration with costs and reliability constraints. These constraints are critical to electricity generation, electricity distribution, and transportation. They do not include barriers associated with public risk and environmental protection, which have played an increasingly strong role in ETI.
ETI in electricity generation
Modernizing U.S. electricity generation and distribution is a good example of the investment barriers of capital-intensive ETI. Electricity is a high-grade energy that can be generated by multiple sources and used for multiple purposes. Electrons can be moved more efficiently over long distances than the raw fuels used to generate them. The public is accustomed to reliable electricity, and the United States has flourished with the availability of inexpensive electricity since the early 20th century. Fossil carbon fuels for electricity production have been under increasing regulatory stress for many years, despite attempts at deregulation (CitationBrunekreeft, 2004; CitationCudahy, 2002; CitationHammons, 2003; CitationPierce, 2002). The portfolio approach, along with long-term fuel-cost options and regulatory impact, has been followed by the electric utilities for their planning of generation options. compares levelized costs (i.e., total cost over plant economic life, converted to equal annual payments in real dollars adjusted to remove inflation) of various generation options. Capital costs as well as operations and maintenance costs (O&M) are included. From these estimates, natural gas generation combined cycle technology is a clear winner with or without carbon capture and storage (CCS) (CitationChow et al., 2003; CitationWhite et al., 2003) in the near term, assuming the natural gas supply expands and the fuel cost remains low for long term contracts. Geothermal and onshore wind offer cost advantages for minimal carbon cost accounting. In the absence of CCS, coal remains relatively low cost, but it produces greater environmental consequences than other fuels. does not account for projections of changes in costs beyond 2017. An example of capital cost projections for generation technologies suggests that photovoltaic (PV) technologies may see a larger decline than other technologies, including natural gas (RMI, 2012). Assessments of future PV market penetration suggest only limited progress in the decade, despite cost reductions (CitationCurtright et al., 2008).
Table 3. Estimated cost of new electricity generation resources for CY 2017 (EIA, 2012)
Cost estimates in do not consider the “life cycle assessment” (LCA) of alternative technologies (CitationKeoleian and Menerey, 1994; CitationWatson et al., 1994; CitationZhang et al., 2010). Interest in LCAs for new and old technologies has increased in association with evaluations of motor vehicle turnover and modernization (CitationGraedel and Allenby, 1998; CitationKagawa et al., 2011). Recent efforts to evaluate the LCA for electrical generation including CCS have been reported (e.g., CitationSchreiber et al., 2012; Whitaker et al., 2012). Factors adversely affecting the LCA for coal-fired power plants are the plant efficiency and energy penalty, CO2 capture, and the fuel origin and composition.
ETI in combining fuels and uses: Hybrid approaches
The review (CitationWilson, 2012) broached the subject of hybrid technologies using wind and solar resources. Innovative hybrids and integrations with current technologies can result in substantial cost and emissions benefits. Combining these technologies with conventional gas turbine combined cycles can improve economics and environmental benefits.
Solid oxide fuel cells (SOFCs) (CitationNesaraj, 2010; CitationWang et al., 2011) are a developing technology that also offers promise in combination with gas turbine power generation (CitationBurer et al., 2003; CitationOdukoya et al., 2011). SOFCs can operate at high temperatures (1000°C) and can directly use clean gaseous hydrocarbon fuels. They can be used in combination with gas turbine combustors as a source of vitiated, heated air that also directly produces electricity from the fuel. Conceptually, the SOFC is simple, with a solid electrolyte sandwiched between a porous ceramic anode and cathode . Fuel is introduced to the anode, flows through the electrolyte and discharges through the cathode. Another advantage for gas turbine applications is that they can operate at high pressure, using compressed air and natural gas to generate hot, vitiated gases for the gas turbine combustors. Clean hydrocarbons such as methane can be reformed within the porous anode to produce hydrogen, which is converted to water in the electrolyte. Overall cycle efficiencies approaching 70% with lower oxides of nitrogen (NOx) emissions have been estimated. A 220-kW prototype SOFC integrated with a microturbine was recently demonstrated and achieved a net electrical efficiency of 53%. Further work is needed to address issues such as high cost, mechanical strength and resistance to sulfur poisoning and thermal cycling. Proton capture SOFCs that operate at lower temperatures offer a potential solution to thermal cycling issues and are likely to be attractive where hydrogen fuel already exists.
Another hybrid system example integrates a gas turbine combined cycle plant with solar and wind energy. Conceptually, solar energy can be used to generate steam, thereby offsetting fuel consumption in the combined cycle plant, while wind energy supplements overall electricity production. This hybrid concept is already being demonstrated in a 500-MW plant under construction in Turkey, where 450 MW of natural gas, 50 MW of solar energy using a power tower technology, and 22 MW of wind energy will be operational in 2014. Solar and wind energy are subject to rapid and unexpected load swings. The response of combined cycle plants to load swings is usually slow, primarily to minimize thermomechanical shock to the heat recovery steam generator and steam turbine components. Recent advances in combined cycle plant control systems design allow for much faster startup/shutdown and load following. Such fast-response control technology enables a hybrid solar-wind-combined cycle natural gas plant to respond much more quickly to changes in solar and wind load while keeping overall plant electrical output steady. Overall electrical efficiency of this hybrid solar-wind-combined cycle natural gas plant, based on fuel chemical energy input alone, is projected to be 69% at design conditions. This is considerably higher than natural gas-only fired combined cycle systems, typically in the range of 55% for comparably sized units, representing a substantial reduction in fuel consumption and CO2 emissions per MW of generation. Another advantage is that the capital cost of solar and wind equipment is relatively small compared to the overall capital cost of the combined cycle plant. Combined with operational fuel savings, this increases the investment attractiveness of the hybrid plant compared with any of these technologies alone.
It is important to find acceptable technologies for converting coal and other traditional fuels to electricity because these fuels will remain dominant global energy resources for some time to come. The review (CitationWilson, 2012) touches on integrated gasification-combined cycle (IGCC) systems for electricity generation. Advances in gasifier design, as well as mercury removal and separation technologies, are now able to produce a clean, high-hydrogen fuel for combustion in a gas turbine combined cycle unit with low CO2 and air pollutant emissions. Because removing air pollutants and their gaseous precursors from the smaller volume of syngas to very low levels is more cost effective than from stack emissions after full combustion, IGCC plants are much more attractive than before, especially when compared to conventional fossil steam plants with multipollutant emission controls including CO2 capture.
Improvements in gas turbine combustion systems and control technologies have enabled use of syngas and fuels with a wider range of compositions and heating values. Modern low-NOx-emitting, lean premixed gas turbine combustors are very complex, utilizing multiple fuel injectors and fuel/air flow distributions that sequence through various modes during startup/shutdown and load changes to maintain flame stability and minimize combustion “dynamics” that create excessive vibration, air emissions, and/or equipment degradation. The operating envelope of each mode is relatively narrow; as such, unforeseen variations in fuel properties can create unfavorable combustion conditions leading to excessive dynamics or flame-out. Fuels with elevated and/or varying hydrogen content have been a particular challenge, especially in combination with other hydrocarbons, because of hydrogen's relatively fast diffusion rates leading to higher flame speeds. With resurging interest in IGCC plants, new combustor designs, sensors and control systems have been developed that considerably expand the range of fuel compositions useable in the gas turbine.
One of the first IGCC plants with carbon capture and sequestration in the United States is under development in California, where the captured CO2 will be injected into oil formations for enhanced crude oil production and long-term storage, and by-product streams will be utilized in urea fertilizer manufacture. Coal, petroleum coke, biomass, and other solids are planned as feedstocks. The gasifier system includes all of the conceptual elements mentioned in the review (CitationWilson, 2012). The gas turbine combined cycle unit will burn mostly low-carbon fuel diluted with nitrogen to moderate combustion temperatures, producing stack gas primarily consisting of water and nitrogen, while producing 400 MW of electricity. Natural gas also can be used for supplemental heat or fired when low-carbon fuel is not available from the gasifier.
A number of similar plants around the world also are in various stages of development. Still, economic viability remains challenging, and progress is slow due to economic headwinds from low natural gas prices, slow economic recovery, and due to inconsistent policies and regulations governing alternative energy development, CO2 storage, and other issues.
Incremental improvements are possible with existing systems. Boilers remain one of the predominant technologies for fossil fuel combustion in residential heating, industrial steam and process heating, electricity generation, and many other applications. Boilers are generally designed with exit gas temperatures as low as approximately 121°C to avoid condensation of water and acids that can corrode boiler and stack components. By using a cold-water heat exchanger to further cool the exit gas to below the water dew point, typically about 57°C for natural gas, up to 10% additional fuel heat input can be recovered from the sensible heat of the exhaust gas and latent heat of the condensed water vapor, yielding overall thermal efficiency exceeding 90%. The increase in efficiency results in CO2 emission reductions for a given amount of output. Air pollutants with low vapor pressures at these temperatures, such as sulfuric acid, condensable particulate matter, semivolatile organic compounds, and volatile metals, can be collected in the condensate where they can be removed and managed. The recovered heat can be integrated for boiler makeup water preheating, building heating and cooling, domestic hot water heating, process heating, and other purposes. So-called indirect contact “condensing economizers” have been available for decades, and a significant number are in use today. They have not reached widespread acceptance primarily because of acid corrosion issues and lack of economical use for the low-quality heat produced. Recent improvements in materials, coating methods, and construction techniques, and increasing drivers for fuel efficiency and CO2 emission reductions, may make condensing economizers considerably more reliable and attractive in both new and retrofit applications. Although economics are site specific, many industrial installations have reported a 2-year payback on investment in retrofit applications. While condensing heat exchangers are not considered a breakthrough technology for reductions in fossil fuel use and CO2 emissions, they are one example of existing technologies that with broader application stimulated by appropriate policy can provide significant incremental environmental and energy improvements in the near term as new alternative technologies evolve and take hold.
ETI in advanced transportation
The U.S. transportation sector is a major user of the petroleum products (), in the form of gasoline and diesel. There are substantial changes taking place in alternatives to petroleum-based fuels, vehicle design, and engine technology that will affect future energy use in the next decade. Fuel availability and use is expected to involve more alcohol (primarily ethanol) content and greater penetration of hybrid and plug-in vehicles in the light-duty vehicle (LDV) sector. The age of hydrogen fuels for transportation appears to remain beyond 2020, based on today's projections. Heavy-duty diesel vehicles (HDVs) are expected to use more biofuels as a replacement for diesel oil. Through vehicle design and engine technology, the historical light-duty characteristics are shown in . The HDV diesel fleet evolves more slowly than LDVs because the engines last longer and trucks are far more expensive to replace than LDVs.
Table 4. Trends in light-duty vehicle (LDV) characteristics for seven model years (EPA, 2012)
From 1975 to 2011, the LDV fleet has tended to reduce CO2 and other emissions, improve fuel economy with increased horsepower, and more or less stable weight. LDVs rely more on four- and six-cylinder engines and deploy new technologies including variable valve timing, cylinder deactivation, direct fuel injection, and continuously variable transmissions. Through 2011 the introduction of hybrid vehicles has been limited, but it is increasing. Diesel-powered LDVs also are increasing, but in a small fraction of the fleet.
Projections through 2020 suggest optimism for introduction of hybrid and plug-in electrical vehicles, with a large potential U.S. market. However, the CitationU.S. Environmental Protection Agency (EPA, 2012) is less optimistic, suggesting that manufacturers will continue to rely on gasoline-powered, internal combustion vehicle technologies with increased efforts to improve efficiency. Introduction of hybrid and electrical vehicle technology depends on competition with continuing improvements in efficiencies of gasoline-powered vehicles, as well as the travel range of battery-powered vehicles.
Any evaluation of future energy sources that power transportation must consider their ability to attain an 80% reduction in CO2 emissions to alleviate global warming, as well as meeting tailpipe emission standards to protect public health and other air-quality-related values (CitationPosada-Sanchez et al., 2012; CitationWilliams et al., 2012). This requires a multipollutant/multieffect air quality management strategy (CitationChow et al., 2010; Citation2012; CitationChow and Watson, 2011; CitationHidy et al., 2011; CitationHidy and Pennell, 2010). Transportation biofuels may reduce CO2 emissions over their life cycles (CitationAgusdinata et al., 2011; CitationHossain and Davies, 2010; CitationHsu et al., 2010; CitationMeyer et al., 2011; CitationOu et al., 2010; CitationYan et al., 2010; CitationYu and Tao, 2009; CitationZhai et al., 2009), but they may result in increased gaseous and particulate pollutant emissions (CitationBetha and Balasubramanian, 2011; CitationBugarski et al., 2010; CitationDi et al., 2009; CitationGuarieiro et al., 2009; CitationLiu et al., 2009; CitationYanowitz and McCormick, 2009). Some of these emission rates may be small when engines are certified, but emission controls deteriorate over time; the more complex the after treatment, the greater is the potential for deterioration. Recent experience with selective catalyst reduction on HDVs show that on-road low-speed operations increased nitrogen dioxide (NO2) emissions (CitationLowell and Kamakate, 2012).
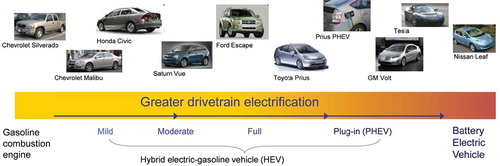
Reduction in the fuel carbon content is needed, as well as increased efficiency of the vehicles powered by combustion. To attain ∼0 g km−1 of greenhouse gases (GHGs) as well as attaining air quality emission standards, future policies must focus on electric drive coupled with renewable electricity generation (CitationAmjad et al., 2010; CitationChoi and Frey, 2010; CitationHausberger et al., 2012; NRC, 2010a; NRC, 2010b; NRC, 2011a; CitationShulock et al., 2012). This is illustrated in , which shows CO2 emission projections based on limits that have been adopted or proposed in different parts of the world. These technology-forcing limits have led to improvements that are likely to continue into the coming decades. Light-weight materials, lower rolling resistance tires, engine turbo charging, continuously variable transmissions (CVT), stop–start systems, and vehicle downsizing provide incremental improvements in fuel economy for vehicles powered by internal combustion engines (ICE), as shown in . However, ICE efficiencies will reach a plateau and there will be a transition to electric drive. This is already starting with hybrid electric-gasoline vehicles (HEV), plug-in hybrids (PHEV), and, to a limited extent, battery electric vehicles (). In terms of future fuels, low-carbon electricity as well as hydrogen, largely from renewable sources, for fuel-cell vehicles will be required. Remaining challenges include costs, availability of infrastructure, customer acceptance, and long-term performance. The United States has not shown a sustained commitment to addressing these challenges, often due to political rather than technical considerations.
Table 5. Potential GHG emission rate reductions from available technologies applied to internal combustion light-duty vehicles (CitationLutsey, 2010)
Figure 2. Future projections for light-duty vehicle (LDV) CO2 emission rates for different countries based on historical performance and proposed or enacted fuel efficiency standards (CitationCARB, 2008; CitationEC, 2009a; CitationEC, 2009b; CitationGCC, 2009; CitationJAMA, 2010; CitationNHTSA, 2011; CitationNHTSA, 2012; CitationNTC, 2012; CitationNTCAS, 2012; CitationTransport Canada, 2009; CitationU.S. EPA, 2010). Solid symbols and lines represent historical performance, solid symbols and dashed lines represent enacted targets, solid symbols and dotted lines represent proposed targets, and hollow symbols and dotted lines represent targets under study. China's target reflects gasoline-powered vehicles only. The target may be lower after new energy vehicles are considered. U.S., Canada, and Mexico LDVs include light-commercial vehicles. NEDC, New European Drive Cycle (CitationDieselNet, 2012b).
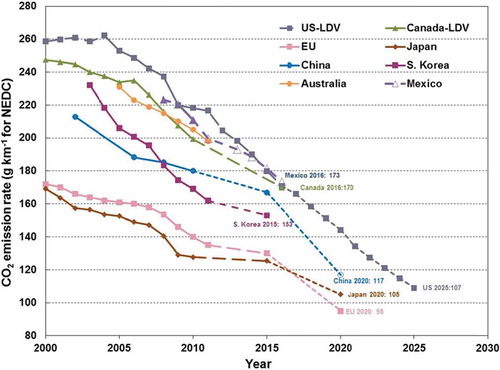
Figure 3. Technological evolution of LDV toward greater drivetrain electrification. Moving from left to right requires: (1) increased electrical complexity: battery size and electronic controls; (2) more frequent electric motor assist and electric-only propulsion; (3) increased capacity for regenerative power during braking; (4) increased accessory electrification (e.g., air conditioning, heating, power steering, lights, and audio); and (5) increased use of grid electricity or hydrogen/fuel cell with low life cycle GHG emissions.
There is a major opportunity to link energy production and transportation and to reduce dependence on fossil fuels. This transformation will not occur overnight, but planning is already underway. In Germany the decision to phase out nuclear energy engendered stronger efforts to replace it with renewable sources. A major challenge with intermittent solar, wind, and hydro energy sources is the need for energy storage. Batteries and hydrogen in advanced vehicles provide a large buffering opportunity when coupled with a smart electricity grid. These vehicles can be charged or hydrogen can be created when there is an abundance of renewable energy available, and that energy can be drawn back into the grid to meet peaking demands. CitationRifkin (2011) proposes an “energy Internet” that links buildings, transportation, and renewable energy sources to a smart grid. While there are many challenges to this concept, it has the elegance of leading to a new paradigm, and one that holistically addresses energy, environment, and sustainability, creating what CitationRifkin (2011) calls the “Third Industrial Revolution.”
Like surface vehicle transportation, aircraft technology has changed markedly over the past 25 years (CitationHaglind and Singh, 2006a; CitationHaglind and Singh, 2006b; CitationLee, 2010; CitationRutherford and Zeanali, 2009). Advancements have come from aircraft design, with heavy emphasis on evolution of jet engine technology. Jet engine efficiency has increased from ∼30% to >60% with increasing turbine inlet temperature and bypass ratios. This has been accompanied by reduced engine fuel consumption relative to the 1960s. Rutherford and Seanali (2009), however, indicate that the fuel burned per passenger-km traveled has remained flat for several years after declining between 1970 and 1990. This is associated with the low cost of fuel and the aging of the aircraft fleet since the 1980s. The high capital cost of new aircraft suggests a turnover rate in excess of 20–25 years. While this involves an extended time period of airframe improvement, it does not preclude modernization through replacement with more efficient engines. The retrofitting of older aircraft with winglets has increased fuel economy by ∼1%, which results in many tonnes of fuel saved over the worldwide fleet.
Marine vessels have long depended on diesel engine technology for propulsion, and rising economic and environmental constraints have engendered innovation (CitationBazari, 2007; CitationHaglind, 2008a; CitationHaglind, 2008b; CitationHaglind, 2008c; CitationWinebrake et al., 2007; CitationWinebrake et al., 2008; CitationAnonymous, 2010). Although the marine fleet turnover is in excess of 25 years, there are major opportunities for modernizing marine diesel technology. New hull designs for large ships employ an air bulb to water interface that reduces hull drag. Designs using propulsion through pods with counterrotating propellers are being employed. Retrofitting marine diesels is said to reduce CO2 emissions by 20%, while “slow running” at ∼14 knots instead of >20 knots is being employed as a fuel-savings measure. New engines entering the market employ “intelligent” electronic controlled technologies analogous to their land-based counterparts. Engines are being designed for dual fuel use—diesel oil and liquefied natural gas. This provides the opportunity to reduce CO2 as well PM2.5, sulfur dioxide (SO2), and NOx emissions.
Policies for Energy Generation and Use
The progressive fee approach as proposed by the review (CitationWilson, 2012), while interesting, is not realistic or practical to effectively control the use of fossil fuels, the resulting emissions, and the climate change challenges. The regulatory approach that has been taken by the Government of Alberta (GOA) in Canada presents an alternative. The approach evolved from Alberta's 2002 climate change strategy and action plan (CitationGOA, 2002), resulting in the Climate Change and Emissions Management Act (CCEMA) of 2003 that came into force in 2007 (CitationGOA, 2003; CitationGOA, 2008). Alberta became the first jurisdiction in Canada to impose regulations that require large facilities in multiple sectors to reduce GHG emissions. Facilities that emit >100,000 tonnes per year of GHG are required to reduce their emissions intensity by 12% per year. Compliance with the required reductions can be met by (1) reducing emissions at the facility with improvements in operations, (2) purchasing Alberta-based carbon offset credits (CitationGOA, 2012), or (3) paying $15 for per tonne of equivalent CO2 over the emissions reductions target. These taxes are placed into the Climate Change and Emissions Management Fund (CCEMF), which is managed and administered by the Climate Change Emissions Management Corporation (CCEMC) to sponsor development of new clean technologies and practical ways of implementing them. This mandate engenders (1) methods to conserve and use energy more efficiently; (2) carbon capture and storage; (3) transformation of energy production methods; and (4) cleaner, sustainable approaches to energy production. Supplemental regulations dictate reporting of emission reduction targets, guidelines for achieving compliance, and penalties for non-compliance. These regulations are (1) the Specified Gas Reporting Regulation, (2) the Specified Gas Emitters Regulation, and (3) the Administrative Penalty Regulation. Open communication and cooperation are key elements.
Additional Reviews on Energy Technology, Policy, and Prospects
The review (CitationWilson, 2012) provided some citations of evaluations and literature surveys for different energy technologies and policies. Complementary technology reviews, not all of them critical, are available for: (1) engines and turbines (CitationHaglind, 2008a; CitationHaglind, 2008b; CitationHaglind, 2008c; Hausberger et al., 2012; CitationLloyd and Cackette, 2001; NRC, 2010a; NRC, 2011a; CitationSahoo et al., 2009); (2) biofuels production and use (CitationAndrade et al., 2011; CitationBalat, 2009; CitationBalat and Balat, 2009; CitationCarriquiry et al., 2011; CitationCheng and Timilsina, 2011; CitationDeng et al., 2008; CitationHammerschlag, 2006; CitationHoekman, 2009; CitationHoekman and Robbins, 2012; CitationKralova and Sjoblom, 2010; CitationLin et al., 2011; CitationMa and Hanna, 1999; CitationMohan et al., 2006; CitationNRC, 2011b; CitationPitz and Mueller, 2011; CitationSahoo et al., 2009; CitationShahid and Jamal, 2011; CitationSparks and Ortmann, 2011; CitationStamenkovic et al., 2011; CitationWang et al., 2009; CitationWilliams et al., 2009); (3) petroleum extraction and refining, including the oil sands (CitationAlvarado and Manrique, 2010; CitationCharpentier et al., 2009; CitationCharpentier et al., 2011; CitationChhetri and Islam, 2008; CitationChung et al., 2012; CitationFinan and Kadak, 2010; CitationGray et al., 2009); (4) coal extraction, use, and environmental consequences (CitationHook and Aleklett, 2010; CitationLighty et al., 2000; CitationLongwell et al., 1995; CitationNRC, 2007a; CitationPatton et al., 2010; CitationYao et al., 2009); (5) natural gas (CitationBhandari et al., 2005; CitationSahoo et al., 2009; CitationWeber and Clavin, 2012); (6) carbon capture and sequestration (CitationChalmers and Gibbins, 2010; Citationde Coninck et al., 2009; CitationJin et al., 2010; CitationKhoo and Tan, 2006; CitationOrr, 2009; CitationPollak and Wilson, 2009; Schreiber et al., 2012; CitationWhite et al., 2003; CitationXiong et al., 2009; CitationZeman, 2007); (7) nuclear energy (CitationGoodfellow et al., 2011; CitationHultman, 2011; CitationLenzen, 2008; CitationMarques, 2010); (8) solar energy (CitationAlkilani et al., 2011; CitationAzzopardi and Mutale, 2010; CitationChidambaram et al., 2011; CitationEl Chaar et al., 2011; CitationJaisankar et al., 2011; CitationLiu et al., 2010; CitationParida et al., 2011; CitationShevaleevskiy, 2008; CitationSsen, 2004; CitationXie et al., 2011; ZhCitationou et al., 2010); (9) wind turbines (CitationAnderson, 1997; CitationDincer, 2011; CitationFoley et al., 2012; CitationJacobson and Delucchi, 2009; CitationMcgowan et al., 1988; CitationNRC, 2007b; CitationSahin, 2004; CitationSaidur et al., 2010; CitationU.S. DOE, 2008); (10) tidal energy (CitationDenny, 2009; CitationFalcao, 2010; CitationGraw, 2009; CitationMinguela et al., 2008; CitationZhang et al., 2009); (11) energy efficiency (CitationAnastas, 2009; CitationAyres et al., 2011; CitationBor, 2008; CitationCEC, 2007; CitationCooney, 2008; CitationDixit et al., 2010; Hausberger et al., 2012; CitationLee, 2010; NRC, 2010a; NRC, 2011a; CitationOmer, 2008; CitationTsao et al., 2010; CitationU.S. DOE, 2007a; CitationU.S. DOE, 2007b; CitationXu et al., 2010); and (12) smart electrical grid and energy applications (CitationBasu et al., 2011; CitationDunn et al., 2011; CitationGellings and Yeager, 2004; CitationWilson et al., 2010; CitationZahedi, 2011).
Although numerous, these represent only a small fraction of the resources on energy issues published since the 1970s energy crises. These reviews, of varying quality and level of bias, provide an entry point to those interested in more serious examination of an energy issue, as they contain lengthy citation lists. Most reflect the authors' point of view, and it is necessary to evaluate several of them to obtain a more complete understanding of the topic.
CitationYergin (2011) provides a good starting point with a nontechnical presentation of the history, policies, and technologies associated with different energy sources. Major sections address petroleum extraction and use, renewable sources (e.g., biofuels, solar, and wind), electricity generation, energy security, transportation technologies, and climate as a driving force. Well-documented arguments are made concerning how well-intentioned national policies have often thwarted market forces that might have led to more efficient energy sources and their distribution. There is discussion of California's deregulation experience, in which the cost to the consumer was regulated without respect to the wholesale prices paid by utilities, resulting in electricity shortages and bankrupt utilities. The Powerplant and Industrial Fuel Use Act of 1978 (repealed in 1987) excluded the use of natural gas in favor of coal, reasoning that U.S. natural gas resources were reaching their limit. The 1978 Natural Gas Policy Act set prices for different categories of use, in the name of “deregulation,” thereby favoring some uses over others for the exact same commodity.
CitationSmil (2010a) makes the case that economic globalization, including the transfer of energy sources, was made possible by modern diesel engines used in shipping, railways, and heavy-duty trucks, and by turbines used in large jets that allow just-in-time deliveries and closer cooperation among people and cultures. CitationSmil's (2010a) historical treatment complements that of the review (CitationWilson, 2012). In another book, which is more opinionated but well documented, CitationSmil (2010b) intends to identify and debunk “myths” relating to (1) the future of electric cars, (2) inexpensive nuclear electrical generation, (3) the world running out of oil, (4) economic and practical capture and sequestration of CO2 from fossil fuel combustion, and (5) the potential replacement of fossil fuels with renewable energy sources and conservation. This work provides an entertaining contrast to some of the more optimistic reviews cited above on these topics.
Errata
CitationCarriquiry et al. (2011), CitationDincer (2011), CitationLin et al. (2011), and CitationMarques (2010) were cited, but without reference listing, by CitationWilson (2012).
References
- Agusdinata , D.B. , Zhao , F. , Ileleji , K. and DeLaurentis , D. 2011 . Life cycle assessment of potential biojet fuel production in the United States . Environmental Science & Technology , 45 ( 21 ) : 9133 – 9143 . doi: 10.1021/es202148g
- Alkilani , M.M. , Sopian , K. , Alghoul , M.A. , Sohif , M. and Ruslan , M.H. 2011 . Review of solar air collectors with thermal storage units . Renewable & Sustainable Energy Reviews , 15 ( 3 ) : 1476 – 1490 . doi: 10.1016/j.rser.2010.10.019
- Alvarado , V. and Manrique , E. 2010 . Enhanced oil recovery: An update review . Energies , 3 ( 9 ) : 1529 – 1575 . doi: 10.3390/en3091529
- American Physical Society. 2012. Energy Units. College Park, MD http://www.aps.org/policy/reports/popa-reports/energy/units.cfm (http://www.aps.org/policy/reports/popa-reports/energy/units.cfm)
- Amjad , S. , Neelakrishnan , S. and Rudramoorthy , R. 2010 . Review of design considerations and technological challenges for successful development and deployment of plug-in hybrid electric vehicles . Renewable & Sustainable Energy Reviews , 14 ( 3 ) : 1104 – 1110 . doi: 10.1016/j.rser.2009.11.001
- Anadon, L.D., M. Bunn, G. Chan, M. Chan, C. Jones, R. Kemperer, A. Lee, N. Logar, and V. Narayanamurti. 2011. Transforming U.S. Energy Innovation. Cambridge, MA: Harvard Kennedy School, Belfer Center for Science and International Affairs http://belfercenter.ksg.harvard.edu/files/uploads/energy-report-january-2012.pdf (http://belfercenter.ksg.harvard.edu/files/uploads/energy-report-january-2012.pdf)
- Anastas , P.T. 2009 . The transformative innovations needed by green chemistry for sustainability . Chemsuschem , 2 ( 5 ) : 391 – 392 . doi: 10.1002/cssc.200900041
- Anderson, D. 1997. Renewable energy technology and policy for development. Annual Review of Energy and the Environment 22(1):187–215 http://energy.annualreviews.org/cgi/content/abstract/22/1/187 (http://energy.annualreviews.org/cgi/content/abstract/22/1/187) doi: 10.1146/annurev.energy. 22.1.187
- Andrade , J.E. , Perez , A. , Sebastian , P.J. and Eapen , D. 2011 . A review of bio-diesel production processes . Biomass & Bioenergy , 35 ( 3 ) : 1008 – 1020 . doi: 10.1016/j.biombioe.2010.12.037
- Anonymous. 2010. New trends in marine propulsion. Pacific Maritime Online, May 25 http://www.pmmonlinenews.com/2010/05/new-trends-in-marine-propulsion.html (http://www.pmmonlinenews.com/2010/05/new-trends-in-marine-propulsion.html)
- Ayres , R.U. , Peiro , L.T. and Mendez , G.V. 2011 . Exergy efficiency in industry: Where do we stand? . Environmental Science & Technology , 45 ( 24 ) : 10634 – 10641 . doi: 10.1021/es202193u
- Azzopardi , B. and Mutale , J. 2010 . Life cycle analysis for future photovoltaic systems using hybrid solar cells . Renewable & Sustainable Energy Reviews , 14 ( 3 ) : 1130 – 1134 . doi: 10.1016/j.rser.2009.10.016
- Balat , M. 2009 . Biodiesel fuel from triglycerides via transesterification: A review . Energy Sources Part A—Recovery Utilization and Environmental Effects , 31 ( 14 ) : 1300 – 1314 . doi: 10.1080/15567030802089573
- Balat , M. and Balat , H. 2009 . Biogas as a renewable energy source: A review . Energy Sources Part A—Recovery Utilization and Environmental Effects , 31 ( 14 ) : 1280 – 1293 . doi: 10.1080/15567030802089565
- Basu , A.K. , Chowdhury , S.P. , Chowdhury , S. and Paul , S. 2011 . Microgrids: Energy management by strategic deployment of DERs—A comprehensive survey . Renewable & Sustainable Energy Reviews , 15 ( 9 ) : 4348 – 4356 . doi: 10.1016/j.rser.2011.07.116
- Bazari , Z. 2007 . Ship energy performance benchmarking/rating: Methodology and application . Journal of Marine Engineering and Technology , : 11 – 18 .
- Betha , R. and Balasubramanian , R. 2011 . Particulate emissions from a stationary engine fueled with ultra-low-sulfur diesel and waste-cooking-oil-derived biodiesel . Journal of the Air & Waste Management Association , 61 ( 10 ) : 1063 – 1069 . doi: 10.1080/10473289.2011.608622
- Bhandari , K. , Bansal , A. , Shukla , A. and Khare , M. 2005 . Performance and emissions of natural gas fueled internal combustion engine: A review . Journal of Scientific & Industrial Research , 64 ( 5 ) : 333 – 338 .
- Bor , Y.J. 2008 . Consistent multi-level energy efficiency indicators and their policy implications . Energy Economics , 30 ( 5 ) : 2401 – 2419 . doi: 10.1016/j.eneco.2007.11.005
- BP. 2011. BP Statistical Review of World Energy. London, UK: BP www.bp.com/statisticalreview (http://www.bp.com/statisticalreview)
- BP. 2012. Conversion Factors. London, UK: BP http://www.bp.com/conversionfactors.jsp (http://www.bp.com/conversionfactors.jsp)
- Brunekreeft , G. 2004 . Electricity economics: Regulation and deregulation . Journal of Economic Literature , 42 ( 3 ) : 868 – 869 . doi: 10.1023/B:EJLE.0000028639. 88011.d2
- Bugarski , A.D. , Cauda , E.G. , Janisko , S.J. , Hummer , J.A. and Patts , L.D. 2010 . Aerosols emitted in underground mine air by diesel engine gueled with biodiesel . Journal of the Air & Waste Management Association , 60 ( 2 ) : 237 – 244 . doi: 10.3155/1047-3289.60.2.237
- Burer , M. , Tanaka , K. , Favrat , D. and Yamada , K. 2003 . Multi-criteria optimization of a district cogeneration plant integrating a solid oxide fuel cell-gas turbine combined cycle, heat pumps and chillers . Energy , 28 ( 6 ) : 497 – 518 . doi: 10.1016/S0360-5442(02)00161-5
- California Air Resources Board. 2008. Comparison of Greenhouse Gas Reductions for the United States and Canada under U.S. CAFE Standards and California Air Resources Board Greenhous Gas Regulations. Comparison of Greenhouse Gas Reductions. Sacramento, CA: California Air Resources Board www.arb.ca.gov/cc/ccms/reports/pavleycafe_reportfeb25_08.pdf (http://www.arb.ca.gov/cc/ccms/reports/pavleycafe_reportfeb25_08.pdf)
- California Energy Commission. 2007. California Energy Commission homepage. Sacramento, CA: California Energy Commission http://www.energy.ca.gov (http://www.energy.ca.gov)
- Carriquiry , M.A. , Du , X.D. and Timilsina , G.R. 2011 . Second generation biofuels: Economics and policies . Energy Policy , 39 ( 7 ) : 4222 – 4234 . doi: 10.1016/j.enpol.2011.04.036
- Chalmers , H. and Gibbins , J. 2010 . Carbon capture and storage: More energy or less carbon? . Journal of Renewable and Sustainable Energy , 2 ( 3 ) : 031006-1 – 031006-10 . doi: 10.1063/1.3446897
- Charpentier, A.D., J.A. Bergerson, and H.L. MacLean. 2009. Understanding the Canadian oil sands industry's greenhouse gas emissions. Environmental Research Letters 4(1):1–11 http://stacks.iop.org/1748-9326/4/i=1/a=014005 (http://stacks.iop.org/1748-9326/4/i=1/a=014005) doi: 10.1088/1748-9326/4/1/014005
- Charpentier , A.D. , Kofoworola , O. , Bergerson , J.A. and MacLean , H.L. 2011 . Life cycle greenhouse gas emissions of current oil sands technologies: GHOST model development and illustrative application . Environmental Science & Technology , 45 ( 21 ) : 9393 – 9404 . doi: 10.1021/es103912m
- Cheng , J.J. and Timilsina , G.R. 2011 . Status and barriers of advanced biofuel technologies: A review . Renewable Energy , 36 ( 12 ) : 3541 – 3549 . doi: 10.1016/j.renene.2011.04.031
- Chhetri , A.B. and Islam , M.R. 2008 . A critical review of electromagnetic heating for enhanced oil recovery . Petroleum Science and Technology , 26 ( 14 ) : 1619 – 1631 . doi: 10.1080/10916460701287607
- Chidambaram , L.A. , Ramana , A.S. , Kamaraj , G. and Velraj , R. 2011 . Review of solar cooling methods and thermal storage options . Renewable & Sustainable Energy Reviews , 15 ( 6 ) : 3220 – 3228 . doi: 10.1016/j.rser.2011.04.018
- Choi , H.W. and Frey , H.C. 2010 . Method for in-use measurement and evaluation of the activity, fuel use, electricity use, and emissions of a plug-in hybrid diesel-electric school bus . Environmental Science & Technology , 44 ( 9 ) : 3601 – 3607 . doi: 10.1021/es903330k
- Chow , J.C. , Watson , J.G. , Herzog , A. , Benson , S.M. , Hidy , G.M. , Gunter , W.D. , Penkala , S.J. and White , C.M. 2003 . 2003 Critical review discussion—Separation and capture of CO2 from large stationary sources and sequestration in geological formations . Journal of the Air & Waste Management Association , 53 ( 10 ) : 1172 – 1182 . doi: 10.1080/10473289.2003.10466274
- Chow , J.C. , Bachmann , J.D. , Kinsman , J.D. , Legge , A.H. , Watson , J.G. , Hidy , G.M. and Pennell , W.R. 2010 . Multipollutant air quality management: Critical review discussion . Journal of the Air & Waste Management Association , 60 ( 10 ) : 1151 – 1164 . doi: 10.3155/1047-3289.60.10.1154
- Chow , J.C. and Watson , J.G. 2011 . Air quality management of multiple pollutants and multiple effects . Air Quality and Climate Change Journal , 45 ( 3 ) : 26 – 32 .
- Chow , J.C. , Watson , J.G. and Cao , J.J. 2012 . A brief history of PM2.5 and its adverse effects . Journal of Earth Environment , 3 ( 4 ) in press
- Chung , T. , Bae , W. , Lee , J. , Lee , W. and Jung , B. 2012 . A review of practical experience and management of the SAGD process for oil sands development . Energy Sources Part A—Recovery Utilization and Environmental Effects , 34 ( 1–4 ) : 219 – 226 . doi: 10.1080/15567036.2011.588682
- Cooney , C.M. 2008 . Energy efficiency as an energy resource . Environmental Science & Technology , 42 ( 3 ) : 652 – 653 . doi: 10.1021/es087096y
- Cudahy , R.D. 2002 . Electric deregulation after California: Down but not out . Administrative Law Review , 54 ( 1 ) : 333 – 363 .
- Curtright , A.E. , Morgan , M.G. and Keith , D.W. 2008 . Expert assessments of future photovoltaic technologies . Environmental Science & Technology , 42 ( 24 ) : 9031 – 9038 . doi: 10.1021/es8014088
- de Coninck , H. , Stephens , J.C. and Metz , B. 2009 . Global learning on carbon capture and storage: A call for strong international cooperation on CCS demonstration . Energy Policy , 37 ( 6 ) : 2161 – 2165 . doi: 10.1016/j.enpol.2009. 01.020
- Deng , C.J. , Liu , R.H. and Cai , J.M. 2008 . State of art of biomass fast pyrolysis for bio-oil in China: A review . Journal of the Energy Institute , 81 ( 4 ) : 211 – 217 . doi: 10.1179/174602208X305219
- Denny , E. 2009 . The economics of tidal energy . Energy Policy , 37 ( 5 ) : 1914 – 1924 . doi: 10.1016/j.enpol.2009.01.009
- Di , Y.G. , Cheung , C.S. and Huang , Z.H. 2009 . Comparison of the effect of biodiesel-diesel and ethanol-diesel on the gaseous emission of a direct-injection diesel engine . Atmospheric Environment , 43 ( 17 ) : 2721 – 2730 . doi: 10.1016/j.atmosenv.2009.02.050
- Dickenson, H.W. 1936. James Watt: Craftsman and Engineer. Cambridge, UK: Cambridge University Press http://books.google.com/books?id=54fqzPz4n WAC&printsec=frontcover#v=onepage&q=HORSE-POWER&f=false (http://books.google.com/books?id=54fqzPz4n WAC&printsec=frontcover#v=onepage&q=HORSE-POWER&f=false)
- DieselNet. 2012a. Emission Standards: Summary of Worldwide Diesel Emission Standards. DieselNet http://www.dieselnet.com/standards/#asia (http://www.dieselnet.com/standards/#asia)
- DieselNet. 2012b. Emission Test Cycles: Summary of Worldwide Engine and Vehicle Test Cycles. Mississauga, ON, Canada: Ecopoint, Inc http://www.dieselnet.com/standards/cycles (http://www.dieselnet.com/standards/cycles)
- Dincer , F. 2011 . The analysis on wind energy electricity generation status, potential and policies in the world . Renewable & Sustainable Energy Reviews , 15 ( 9 ) : 5135 – 5142 . doi: 10.1016/j.rser.2011.07.042
- Dincer , I. 2000 . Renewable energy and sustainable development: A crucial review . Renewable & Sustainable Energy Reviews , 4 ( 2 ) : 157 – 175 . doi: 10.1016/S1364-0321(99)00011-8
- Dixit , M.K. , Fernandez-Solis , J.L. , Lavy , S. and Culp , C.H. 2010 . Identification of parameters for embodied energy measurement: A literature review . Energy and Buildings , 42 ( 8 ) : 1238 – 1247 . doi: 10.1016/j.enbuild.2010.02.016
- Dunn , B. , Kamath , H. and Tarascon , J.M. 2011 . Electrical energy storage for the grid: A battery of choices . Science , 334 ( 6058 ) : 928 – 935 . doi: 10.1126/science.1212741
- Edmonds, J.A., M.A. Wise, J.J. Dooley, S.J. Kim, S.J. Smith, P.J. Runci, L.E. Clarke, E.L. Malone, and G.M. Stokes. 2007. Global Energy Technology Strategy: Phase 2, Findings From an international Public-Private Sponsored Research Program. Richland, WA: Battelle Memorial Institute http://www.law.northwestern.edu/lawreview/Colloquy/2007/32/fn106. pdf (http://www.law.northwestern.edu/lawreview/Colloquy/2007/32/fn106. pdf)
- El Chaar , L. , Lamont , L.A. and El Zein , N. 2011 . Review of photovoltaic technologies . Renewable & Sustainable Energy Reviews , 15 ( 5 ) : 2165 – 2175 . doi: 10.1016/j.rser.2011.01.004
- Energy Information Administration. 2012. Annual Energy Outlook 2012 Early Release Overview. Washington, DC: U.S. Energy Information Administration http://www.eia.gov/forecasts/aeo/er/early_production.cfm (http://www.eia.gov/forecasts/aeo/er/early_production.cfm)
- European Commission. 2009a. Reducing CO2 emissions from passenger cars. Brussels, Belgium: European Commission http://ec.europa.eu/clima/policies/transport/vehicles/cars/index_en.htm (http://ec.europa.eu/clima/policies/transport/vehicles/cars/index_en.htm)
- European Commission. 2009b. Report from the Comission to the European Parliament, the Coundil, and the European Economic and Social Committee: Monitoring the CO2 emissions from new passenger cars in the EU: Data for 2009. Brussels, Belgium: European Commission http://eur-lex.europa.eu/LexUriServ/LexUriServ.do?uri=CELEX:52010DC0655:EN:HTML (http://eur-lex.europa.eu/LexUriServ/LexUriServ.do?uri=CELEX:52010DC0655:EN:HTML)
- European Commission. 2012. Energy: Satistics and market observatory. Luxemburg, Belgium: European Commission http://ec.europa.eu/energy/observatory/index_en.htm (http://ec.europa.eu/energy/observatory/index_en.htm)
- Falcao , A.F.D. 2010 . Wave energy utilization: A review of the technologies . Renewable & Sustainable Energy Reviews , 14 ( 3 ) : 899 – 918 . doi: 10.1016/j.rser.2009.11.003
- Finan , A.E. and Kadak , A.C. 2010 . Integration of nuclear energy into oil sands projects . Journal of Engineering for Gas Turbines and Power—Transactions of the ASME , 132 ( 4 ) doi: 10.1115/1.3098421
- Foley , A.M. , Leahy , P.G. , Marvuglia , A. and McKeogh , E.J. 2012 . Current methods and advances in forecasting of wind power generation . Renewable Energy , 37 ( 1 ) : 1 – 8 . doi: 10.1016/j.renene.2011.05.033
- Gallagher , K.S. , Holdren , J.P. and Sagar , A.D. 2006 . Energy-technology innovation . Annual Review of Environment and Resources , 31 : 193 – 237 . doi: 000242324900008. doi:10.1146/annurev.energy.30.050504.144321
- Gellings, C.W., and K.E. Yeager. 2004. Transforming the electric infrastructure. Physics Today December:45–51 http://www.physicstoday.org (http://www.physicstoday.org) doi: 10.1063/1.1878334
- Goodfellow , M.J. , Williams , H.R. and Azapagic , A. 2011 . Nuclear renaissance, public perception and design criteria: An exploratory review . Energy Policy , 39 ( 10 ) : 6199 – 6210 . doi: 10.1016/j.enpol.2011.06.068
- Government of Alberta. 2002. Albertans and Climate Change: Taking Action. Edmonton, AB, Canada: Government of Alberta (GOA) Ministry of Environment and Sustainable Development http://environment.gov.ab.ca/info/library/6123.pdf (http://environment.gov.ab.ca/info/library/6123.pdf)
- Government of Alberta. 2003. Climate Change and Emissions Management Act. Edmonton, AB, Canada: Government of Alberta (GOA) Ministry of Environment and Sustainable Development http://www.qp.alberta.ca/documents/Acts/C16P7.pdf (http://www.qp.alberta.ca/documents/Acts/C16P7.pdf)
- Government of Alberta. 2008. Climate Change and Emissions Management Amendment Act, Bill 8. Edmonton, AB, Canada: Government of Alberta (GOA) http://www.assembly.ab.ca/ISYS/LADDAR_files/docs/bills/bill/legi slature_27/session_1/20080414_bill-008.pdf (http://www.assembly.ab.ca/ISYS/LADDAR_files/docs/bills/bill/legi slature_27/session_1/20080414_bill-008.pdf)
- Government of Alberta. 2012. Carbon Offset Solutions. Edmonton, AB, Canada: Government of Alberta http://carbonoffsetsolutions.climatechangecentral.com/ (http://carbonoffsetsolutions.climatechangecentral.com/)
- Graedel , T. and Allenby , B. 1998 . Industrial Ecology and the Automobile , Upper Saddle River , NJ : Prentice Hall .
- Graw , K.U. 2009 . Wave energy: Resources and technologies—Principles, realised systems, state of the art [in German] . Wasserwirtschaft , 99 ( 3 ) : 12 – 17 .
- Gray , M. , Xu , Z.H. and Masliyah , J. 2009 . Physics in the oil sands of Alberta . Physics Today , 62 ( 3 ) : 31 – 35 . doi: 10.1063/1.3099577
- Green Car Congress. 2009. South Korea to Boost Vehicle Fuel Economy Standards http://www.greencarcongress.com/2009/06/korea-20090604.html (http://www.greencarcongress.com/2009/06/korea-20090604.html)
- Guarieiro , L.L.N. , de Souza , A.F. , Torres , E.A. and de Andrade , J.B. 2009 . Emission profile of 18 carbonyl compounds, CO, CO2, and NOx emitted by a diesel engine fuelled with diesel and ternary blends containing diesel, ethanol and biodiesel or vegetable oils . Atmosphere & Environment , 43 ( 17 ) : 2754 – 2761 . doi: 10.1016/j.atmosenv.2009.02.036
- Haglind , F. and Singh , R. 2006a . Potential of reducing the environmental impact of aviation by using hydrogen—Part II: Aero gas turbine design . Aeronautical Journal , 110 ( 1110 ) : 541 – 552 . doi: 10.1115/1.2179468
- Haglind , F. and Singh , R. 2006b . Potential of reducing the environmental impact of aviation by using hydrogen—Part III: Optimum cruising altitude and airport implications . Aeronautical Journal , 110 ( 1110 ) : 553 – 565 .
- Haglind , F. 2008a . A review on the use of gas and steam turbine combined cycles as prime movers for large ships. Part I: Background and design . Energy Conversion and Management , 49 ( 12 ) : 3458 – 3467 . doi: 10.1016/j.enconman. 2008.08.005
- Haglind , F. 2008b . A review on the use of gas and steam turbine combined cycles as prime movers for large ships. Part II: Previous work and implications . Energy Conversion and Management , 49 ( 12 ) : 3468 – 3475 . doi: 10.1016/j.enconman.2008.08.004
- Haglind , F. 2008c . A review on the use of gas and steam turbine combined cycles as prime movers for large ships. Part III: Fuels and emissions . Energy Conversion and Management , 49 ( 12 ) : 3476 – 3482 . doi: 10.1016/j.enconman.2008.08.003
- Hammerschlag , R. 2006 . Ethanol's energy return on investment: A survey of the literature 1990 - Present . Environmental Science & Technology , 40 ( 6 ) : 1744 – 1750 . doi: 10.1021/es052024h
- Hammons , T.J. 2003 . Electricity deregulation after California . Electric Power Components and Systems , 31 ( 4 ) : 349 – 378 . doi: 10.1080/15325000390112242
- Hausberger, S., M. Rexeis, J. Blassnegger, and G. Silberholz 2012. Evaluation of Fuel Efficiency Improvements in the Heavy-Duty Vehicle (HDV) Sector From Improved Trailer and Tire Designs by Application of a New Test Procedure. Washington, DC: International Council on Clean Transportation http://www.theicct.org/sites/default/files/publications/Final_Report_ICCT_VDA_FINAL2.pdf (http://www.theicct.org/sites/default/files/publications/Final_Report_ICCT_VDA_FINAL2.pdf)
- Hester , K.C. and Brewer , P.G. 2009 . Clathrate hydrates in nature . Annual Review of Marine Science , 1 : 303 – 327 . doi: 10.1146/annurev.marine.0109 08.163824
- Hidy , G.M. and Spencer , D.F. 1994 . Climate alteration: A global issue for the electric power industry in the 21st century . Energy Policy , 22 : 1005 – 1027 . doi: 10.1016/0301-4215(94)90016-7
- Hidy, G.M., and W.R. Pennell. 2010. Multipollutant air quality management: A critical review. Journal of the Air & Waste Management Association 60(6):645–674. http://pubs.awma.org/gsearch/journal/2010/6/10.3155-1047-3289.60.6.645.pdf (http://pubs.awma.org/gsearch/journal/2010/6/10.3155-1047-3289.60.6.645.pdf) doi: 10.3155/1047-3289.60.6.645
- Hidy , G.M. , Brook , J. , Demerjian , K. , Molina , L. , Pennell , W.R. and Scheffe , R. 2011 . Technical Challenges of Multipollutant Air Quality Management , New York , NY : Springer .
- Hoekman , S.K. 2009 . Biofuels in the US—Challenges and opportunities . Renewable Energy , 34 ( 1 ) : 14 – 22 .
- Hoekman , S.K. and Robbins , C. 2012 . Review of the effects of biodiesel on NOx emissions . Fuel Processing Technology , 96 : 237 – 249 . doi: 10.1016/j.fuproc. 2011.12.036
- Hook , M. and Aleklett , K. 2010 . A review on coal-to-liquid fuels and its coal consumption . International Journal of Energy Research , 34 ( 10 ) : 848 – 864 . doi: 10.1002/er.1596
- Hossain , A.K. and Davies , P.A. 2010 . Plant oils as fuels for compression ignition engines: A technical review and life-cycle analysis . Renewable Energy , 35 ( 1 ) : 1 – 13 . doi: 10.1016/j.renene.2009.05.009
- Hsu , D.D. , Inman , D. , Heath , G.A. , Wolfrum , E.J. , Mann , M.K. and Aden , A. 2010 . Life cycle environmental impacts of selected US ethanol production and use pathways in 2022 . Environmental Science & Technology , 44 ( 13 ) : 5289 – 5297 . doi: 10.1021/es100186h
- Hultman , N.E. 2011 . The political economy of nuclear energy . Wiley Interdisciplinary Reviews—Climate Change , 2 ( 3 ) : 397 – 411 . doi: 10.1002/wcc.113
- International Energy Agency. 2011. 2011 Key World Energy Statistics. Paris, France: International Energy Agency http://www.iea.org/textbase/nppdf/free/2011/key_world_energy_stats.pdf (http://www.iea.org/textbase/nppdf/free/2011/key_world_energy_stats.pdf)
- International Energy Agency. 2011. North American Energy Inventory. Washington, DC: Institute for Energy Research (IER) http://www.energyforamerica.org/wp-content/uploads/2012/06/Energy-InventoryFINAL.pdf (http://www.energyforamerica.org/wp-content/uploads/2012/06/Energy-InventoryFINAL.pdf)
- Jacobson , M.Z. and Delucchi , M.A. 2009 . A path to sustainable energy by 2030 . Scientific American , 301 ( 5 ) : 58 – 65 . doi: 10.1038/scientificamerican1109-58
- Jaisankar , S. , Ananth , J. , Thulasi , S. , Jayasuthakar , S.T. and Sheeba , K.N. 2011 . A comprehensive review on solar water heaters . Renewable & Sustainable Energy Reviews , 15 ( 6 ) : 3045 – 3050 . doi: 10.1016/j.rser.2011.03.009
- Japan Automobile Manufacturers Association. 2010. Motor Vehicle Statistics of Japan: 2010. Tokyo, Japan: Japan Automobile Manufacturers Association http://www.jama-english.jp/publications/MVS2010.pdf (http://www.jama-english.jp/publications/MVS2010.pdf)
- Jin , H.G. , Gao , L. , Han , W. and Hong , H. 2010 . Prospect options of CO2 capture technology suitable for China . Energy , 35 ( 11 ) : 4499 – 4506 . doi: 10.1016/j.energy.2009.05.031
- Kagawa , S. , Nansai , K. , Kondo , Y. , Hubacek , K. , Suh , S. , Minx , J. , Kudoh , Y. , Tasaki , T. and Nakamura , S. 2011 . Role of motor vehicle lifetime extension in climate change policy . Environmental Science & Technology , 45 ( 4 ) : 1184 – 1191 . doi: 10.1021/es1034552
- Keoleian , G.A. and Menerey , D. 1994 . Critical review: Sustainable development by design: Review of life cycle design and related approaches . Journal of the Air & Waste Management Association , 44 ( 5 ) : 645 – 668 . doi: 10.1080/1073161X.1994.10467269
- Khoo , H.H. and Tan , R.B.H. 2006 . Life cycle investigation of CO2 recovery and sequestration . Environmental Science & Technology , 40 ( 12 ) : 4016 – 4024 . doi: 10.1021/es051882a
- Kralova , I. and Sjoblom , J. 2010 . Biofuels-renewable energy sources: A review . Journal of Dispersion Science and Technology , 31 ( 3 ) : 409 – 425 . doi: 10.1080/01932690903119674
- Kvenvolden , K.A. 1988 . Methane hydrate—A major reservoir of carbon in the shallow geosphere . Chemical Geology , 71 ( 1–3 ) : 41 – 51 . doi: 10.1016/0009-2541(88)90104-0
- Kvenvolden , K.A. and Lorenson , T.D. 2001 . “ The global occurance of natural gas hydrates ” . In In Natural Gas Hydrates: Occurrence, Distribution and Detection , 3 – 18 . Washington, DC : American Geophysical Union .
- Lee , J.J. 2010 . Can we accelerate the improvement of energy efficiency in aircraft systems? . Energy Conversion and Management , 51 ( 1 ) : 189 – 196 . doi: 10.1016/j.enconman.2009.09.011
- Lee , S.Y. and Holder , G.D. 2001 . Methane hydrates potential as a future energy source . Fuel Processing Technology , 71 ( 1–3 ) : 181 – 186 . doi: 10.1016/S0378-3820(01)00145-X
- Lenzen , M. 2008 . Life cycle energy and greenhouse gas emissions of nuclear energy: A review . Energy Conversion and Management , 49 ( 8 ) : 2178 – 2199 . doi: 10.1016/j.enconman.2008.01.033
- Lighty , J.S. , Veranth , J.M. and Sarofim , A.F. 2000 . Critical review: Combustion aerosols: Factors governing their size and composition and implications to human health . Journal of the Air & Waste Management Association , 50 ( 9 ) : 1565 – 1618 . doi: 10.1080/10473289.2000.10464197
- Lin , L. , Zhou , C.S. , Vittayapadung , S. , Shen , X.Q. and Dong , M.D. 2011 . Opportunities and challenges for biodiesel fuel . Applied Energy , 88 ( 4 ) : 1020 – 1031 . doi: 10.1016/j.apenergy.2010.09.029
- Liu , L.Q. , Wang , Z.X. , Zhang , H.Q. and Xue , Y.C. 2010 . Solar energy development in China—A review . Renewable & Sustainable Energy Reviews , 14 ( 1 ) : 301 – 311 . doi: 10.1016/j.rser.2009.08.005
- Liu , Y.Y. , Lin , T.C. , Wang , Y.J. and Ho , W.L. 2009 . Carbonyl compounds and toxicity assessments of emissions from a diesel engine running on biodiesels . Journal of the Air & Waste Management Association , 59 ( 2 ) : 163 – 171 . doi: 10.3155/1047-3289.59.2.163
- Lloyd , A.C. and Cackette , T.A. 2001 . Critical review—Diesel engines: Environmental impact and control . Journal of the Air & Waste Management Association , 51 ( 6 ) : 809 – 847 . doi: 10.1080/10473289.2001.10464315
- Longwell , J.P. , Rubin , E.S. and Wilson , J. 1995 . Coal: Energy for the future . Progress in Energy and Combustion Science , 21 ( 4 ) : 269 – 360 . doi: 10.1016/0360-1285(95)00007-0
- Lowell, D., and F. Kamakate 2012. Urban Off-Cycle NOx Emissions From Euro IV/V Trucks and Buses: Problems and Solutions for Europe and Developing Countries. Washington, DC: International Council on Clean Transportation http://www.theicct.org/sites/default/files/publications/ICCT_WP18_urban_Nox_ emissions.pdf (http://www.theicct.org/sites/default/files/publications/ICCT_WP18_urban_Nox_ emissions.pdf)
- Lutsey, N. 2010. Review of Technical Literature and Trends Related to Automobile Mass-Reduction Technology. UCD-ITS-RR-10-10. Sacramento, CA: California Air Resources Board http://www.arb.ca.gov/msprog/levprog/leviii/meetings/051810/2010_ucd-its-rr-10-10.pdf (http://www.arb.ca.gov/msprog/levprog/leviii/meetings/051810/2010_ucd-its-rr-10-10.pdf)
- Ma , F.R. and Hanna , H.A. 1999 . Biodiesel production: A review . Bioresource Technology , 70 ( 1 ) : 1 – 15 . doi: 10.1016/S0960-8524(99)00025-5
- MacEachern , C. 2010 . “ The Wood Buffalo Environmental Association: Monitoring in the Athabasca Oil Sands Region ” . In In Proceedings, 103rd Annual Conference and Exhibition , 1 – 5 . Pittsburgh, PA : Air & Waste Management Association .
- Marques , J.G. 2010 . Evolution of nuclear fission reactors: Third generation and beyond . Energy Conversion and Management , 51 ( 9 ) : 1774 – 1780 . doi: 10.1016/j.enconman.2009.12.043
- Mcgowan , J.G. , Manwell , J.F. and Connors , S.R. 1988 . Wind diesel energy systems—Review of design options and recent developments . Solar Energy , 41 ( 6 ) : 561 – 575 . doi: 10.1016/0038-092X(88)90059-X
- Meyer , P.E. , Green , E.H. , Corbett , J.J. , Mas , C. and Winebrake , J.J. 2011 . Total fuel-cycle analysis of heavy-duty vehicles using biofuels and natural gas-based alternative fuels . Journal of the Air & Waste Management Association , 61 ( 3 ) : 285 – 294 . doi: 10.3155/1047-3289.61.3.285
- Minguela , P.R. , Martines , J.L.V. and Fernandez , F.S. 2008 . Wave energy: State of the art and future perspectives . Dyna , 83 ( 3 ) : 139 – 147 .
- Mohan , D. , Pittman , C.U. and Steele , P.H. 2006 . Pyrolysis of wood/biomass for bio-oil: A critical review . Energy & Fuels , 20 ( 3 ) : 848 – 889 . doi: 10.1021/ef0502397
- National Bureau of Statistics of China. 2012. China Statistical Data Base: Energy. Beijing, China: National Bureau of Statsitics of China http://219.235.129.58/reportYearQuery.do?id=1600&r=0.19546146661173958 (http://219.235.129.58/reportYearQuery.do?id=1600&r=0.19546146661173958)
- National Highway Traffic Safety Administration. 2011. 2017–2025 Model year light-duty vehicle GHG emissions and CAFE standards: Supplemental notice of intent. Federal Register 76(153):48748–48795 http://www.gpo.gov/fdsys/pkg/FR-2011-08-09/pdf/2011-19905.pdf (http://www.gpo.gov/fdsys/pkg/FR-2011-08-09/pdf/2011-19905.pdf)
- National Highway Traffic Safety Administration. 2012. CAFE—Fuel economy. National Highway Traffic Safety Administration http://www.nhtsa.gov/fuel-economy (http://www.nhtsa.gov/fuel-economy)
- National Research Council. 2003. Energy and Transportation: Challenges for the Chemical Sciences in the 21st Century. Washington, DC: National Academies Press www.nap.edu (http://www.nap.edu)
- National Research Council. 2007a. Coal: Research and Development to Support National Energy Policy. Washington, DC: National Academies Press http://books.nap.edu/catalog.php?record_id=12001 (http://books.nap.edu/catalog.php?record_id=12001)
- National Research Council . 2007b . Environmental Impacts of Wind-Energy Projects , Washington , DC : National Academies Press .
- National Research Council. 2008. Energy Futures and Urban Air Pollution Challenges for China and the United States. Washington, DC: National Academies Press http://books.nap.edu/catalog.php?record_id=12001 (http://books.nap.edu/catalog.php?record_id=12001)
- National Research Council. 2009a. America's Energy Future: Technology and Transformation. Washington, DC: National Academies Press http://www.nap.edu/catalog.php?record_id=12091 (http://www.nap.edu/catalog.php?record_id=12091)
- National Research Council. 2009b. Liquid Transportation Fuels from Coal and Biomass: Technological Status, Costs, and Environmental Impacts. Washington, DC: National Academies Press https://download.nap.edu/catalog.php?record_id=12620 (http://https://download.nap.edu/catalog.php?record_id=12620)
- National Research Council. 2010a. Technologies and Approaches to Reducing the Fuel Consumption of Medium- and Heavy-Duty Vehicles. Washington, DC: National Academies Press http://www.nap.edu/catalog.php?record_id=12845 (http://www.nap.edu/catalog.php?record_id=12845)
- National Research Council. 2010b. Transitions to Alternative Transportation Technologies—Plug-in Hybrid Electric Vehicles. Washington, DC: National Academies Press http://www.nap.edu/catalog.php?record_id=12826 (http://www.nap.edu/catalog.php?record_id=12826)
- National Research Council. 2011a. Assessment of Fuel Economy Technologies for Light-Duty Vehicles. Washington, DC: National Academies Press http://www.nap.edu/catalog.php?record_id=12924 (http://www.nap.edu/catalog.php?record_id=12924)
- National Research Council. 2011b. Renewable Fuel Standard: Potential Economic and Environmental Effects of U.S. Biofuel Policy. Washington, DC: National Academies Press http://www.nap.edu/catalog.php?record_id=13105 (http://www.nap.edu/catalog.php?record_id=13105)
- Natural Resources Canada (NRCAN) Oil and Gas Regulatory Affairs Division. 2011. Canadian Crude Oil,Natural Gas and Petroleum Products: Reviw of 2009 and Outlook to 2030. Ottawa, ON, Canada: Natural Resources Canada (NRCAN) Oil and Gas Regulatory Affairs Division http://www.nrcan.gc.ca/energy/publications/sources/oil-gas-review-outlook/1229 (http://www.nrcan.gc.ca/energy/publications/sources/oil-gas-review-outlook/1229)
- National Transport Commission. 2012. Carbon Dioxide Emissions From New Australian Vehicles 2011: Information Paper. Melbourne, Victoria, Australia: National Transport Commission http://www.ntc.gov.au/filemedia/Reports/C02EmissionsNewAustVeh2011InfoPa.pdf (http://www.ntc.gov.au/filemedia/Reports/C02EmissionsNewAustVeh2011InfoPa.pdf)
- National Technical Committee on Autmobile Standardization. 2012. National Autmomotive Standardization [in Chinese]. Beijing, China: National Technical Committee on Autmobile Standardization http://www.catarc.org.cn/ (http://www.catarc.org.cn/)
- Nesaraj , A.S. 2010 . Recent developments in solid oxide fuel cell technology—A review . Journal of Scientific & Industrial Research , 69 ( 3 ) : 169 – 176 .
- Odukoya , A. , Carretero , J.A. and Reddy , B.V. 2011 . Thermodynamic optimization of solid oxide fuel cell-based combined cycle cogeneration plant . International Journal of Energy Research , 35 ( 15 ) : 1399 – 1411 . doi: 10.1080/15435075.2011.602158
- Omer , A.M. 2008 . Green energies and the environment . Renewable & Sustainable Energy Reviews , 12 ( 7 ) : 1789 – 1821 . doi: 10.1016/j.rser.2006.05.009
- Orr , F.M. 2009 . CO2 capture and storage: Are we ready? . Energy & Environmental Science , 2 ( 5 ) : 449 – 458 . doi: 10.1039/b822107n
- Ou , X.M. , Zhang , X.L. and Chang , S.Y. 2010 . Alternative fuel buses currently in use in China: Life-cycle fossil energy use, GHG emissions and policy recommendations . Energy Policy , 38 ( 1 ) : 406 – 418 . doi: 10.1016/j.enpol.2009.09.031
- Parida , B. , Iniyan , S. and Goic , R. 2011 . A review of solar photovoltaic technologies . Renewable & Sustainable Energy Reviews , 15 ( 3 ) : 1625 – 1636 . doi: 10.1016/j.rser.2010.11.032
- Patton , R. , Steele , P. and Yu , F. 2010 . Coal vs. charcoal-fueled diesel engines: A review . Energy Sources Part A—Recovery Utilization and Environmental Effects , 32 ( 4 ) : 315 – 322 . doi: 10.1080/15567030802612440
- Percy, K.E. 2010. The Athabasca Oil Sands Region: Effects-based environmental monitoring in a multistakeholder air quality management context. In Proceedings, Leapfrogging Opportunities for Air Quality Improvement, 543. Pittsburgh, PA: Air & Waste Management Association http://www.dri.edu/conference-proceedings (http://www.dri.edu/conference-proceedings)
- Percy , K.E. 2012 . Alberta Oil Sands: Energy, Industry, and the Environment , Amsterdam , , The Netherlands : Elsevier Press .
- Pierce , R.J. 2002 . How will the California debacle affect energy deregulation? . Administrative Law Review , 54 ( 1 ) : 389 – 408 . ISI:000174806200009
- Pitz , W.J. and Mueller , C.J. 2011 . Recent progress in the development of diesel surrogate fuels . Progress in Energy and Combustion Science , 37 ( 3 ) : 330 – 350 . doi: 10.1016/j.pecs.2010.06.004
- Pollak , M.F. and Wilson , E.J. 2009 . Regulating geologic sequestration in the United States: Early rules take divergent approaches . Environmental Science & Technology , 43 ( 9 ) : 3035 – 3041 . doi: 10.1021/es803094f
- Posada-Sanchez, F., A. Bandivadekar, and J. German 2012. Estimated Cost of Emission Reduction Technologies for Light-Duty Vehicles. Washington, DC: International Council on Clean Transportation http://www.theicct.org/sites/default/files/publications/ICCT_LDVcostsreport_2012.pdf (http://www.theicct.org/sites/default/files/publications/ICCT_LDVcostsreport_2012.pdf)
- Rifkin , J. 2011 . Only an ‘energy internet’ can ward off disaster . The Financial Times , July 10
- Rocky Mountain Institute. 2012. Technology capital cost projections. Snowmass, CO: Rocky Mountain Institute http://www.rmi.org/RFGraph-technology_ capital_cost_projections (http://www.rmi.org/RFGraph-technology_ capital_cost_projections)
- Rutherford, D., and M. Zeanali 2009. Efficiency Trends for New Commercial Aircraft: 1960–2008. Washington, DC: International Council on Clean Transportation http://www.theicct.org/sites/default/files/publications/ICCT_ Aircraft_Efficiency_final.pdf (http://www.theicct.org/sites/default/files/publications/ICCT_ Aircraft_Efficiency_final.pdf)
- Sahin , A.D. 2004 . Progress and recent trends in wind energy . Progress in Energy and Combustion Science , 30 ( 5 ) : 501 – 543 . doi: 10.1016/j.pecs.2004.04.001
- Sahoo , B.B. , Sahoo , N. and Saha , U.K. 2009 . Effect of engine parameters and type of gaseous fuel on the performance of dual-fuel gas diesel engines-A critical review . Renewable & Sustainable Energy Reviews , 13 ( 6–7 ) : 1151 – 1184 . doi: 10.1016/j.rser.2008.08.003
- Saidur , R. , Islam , M.R. , Rahim , N.A. and Solangi , K.H. 2010 . A review on global wind energy policy . Renewable & Sustainable Energy Reviews , 14 ( 7 ) : 1744 – 1762 . doi: 10.1016/j.rser.2010.03.007
- Schreiber, A., P. Zapp, and J. Marx. 2012. Meta-analysis of life cycle assessment studies on electricity generation with carbon capture and storage. Journal of Industrial Ecology 16:S155–S168 http://onlinelibrary.wiley.com/doi/10.1111/j.1530-9290.2011.00435.x/pdf (http://onlinelibrary.wiley.com/doi/10.1111/j.1530-9290.2011.00435.x/pdf) doi: 10.1111/j.1530-9290.2011.00435.x
- Shahid , E.M. and Jamal , Y. 2011 . Production of biodiesel: A technical review . Renewable & Sustainable Energy Reviews , 15 ( 9 ) : 4732 – 4745 . doi: 10.1016/j.rser.2011.07.079
- Shevaleevskiy , O. 2008 . The future of solar photovoltaics: A new challenge for chemical physics . Pure and Applied Chemistry , 80 ( 10 ) : 2079 – 2089 . doi: 10.1351/pac200880102079
- Shulock, C., E. Pike, A.C. Lloyd, and R. Rose 2012. Vehicle electrification policy study: Task 1 report—Technology status. Washington, DC: International Council on Clean Transportation http://theicct.org/sites/default/files/publications/ICCT_VEPstudy_Mar2011_no1.pdf (http://theicct.org/sites/default/files/publications/ICCT_VEPstudy_Mar2011_no1.pdf)
- Smil , V. 2010a . Prime Movers of Globalization: The History and Impact of Diesel Engines and Gas Turbines , Cambridge , MA : MIT Press .
- Smil , V. 2010b . Energy Myths and Realities: Bring Science to the Energy Policy Debate , Washington , DC : AEI Press .
- Sparks , G.D. and Ortmann , G.F. 2011 . Global biofuel policies: A review . Agrekon , 50 ( 2 ) : 59 – 82 . doi: 10.1080/03031853.2011.589983
- Ssen , Z. 2004 . Solar energy in progress and future research trends . Progress in Energy and Combustion Science , 30 ( 4 ) : 367 – 416 . doi: 10.1016/j.pecs.2004.02.004
- Stamenkovic , O.S. , Velickovic , A.V. and Veljkovic , V.B. 2011 . The production of biodiesel from vegetable oils by ethanolysis: Current state and perspectives . Fuel , 90 ( 11 ) : 3141 – 3155 . doi: 10.1016/j.fuel.2011.06.049
- The Energy and Resources Institute. 2012. India energy portal. New Delhi, India: The Energy and Resources Institute (TERI) http://www.indiaenergyportal.org/energy_stats.php (http://www.indiaenergyportal.org/energy_stats.php)
- Transport Canada. 2009. CAFC Targets and Canadian Fleet Averages. Ottawa, ON, Canada: Transport Canada http://www.tc.gc.ca/eng/programs/environment-fcp-cafctargets-385.htm (http://www.tc.gc.ca/eng/programs/environment-fcp-cafctargets-385.htm)
- Tsao , J.Y. , Saunders , H.D. , Creighton , J.R. , Coltrin , M.E. and Simmons , J.A. 2010 . Solid-state lighting: An energy-economics perspective . Journal of Physics D—Applied Physics , 43 ( 35 ) doi: 10.1088/0022-3727/43/35/354001
- United Nations 2010. The United Nations Energy Statistics Database. New York, NY: United Nations Statistics Division http://unstats.un.org/unsd/energy/yearbook/default.htm (http://unstats.un.org/unsd/energy/yearbook/default.htm)
- U.S. Department of Energy. 2007a. Energy Efficiency and Renewable Energy. Washington DC: U.S. Department of Energy http://www.eere.energy.gov (http://www.eere.energy.gov)
- U.S. Department of Energy. 2007b. Energy Star homepage. Washington DC: U.S. Department of Energy http://www.energystar.gov/ (http://www.energystar.gov/)
- U.S. Department of Energy. 2008. 20% Wind Energy by 2030: Increasing Wind Energy's Contribution to U.S. Electricity Supply. DOE/GO-102008-2567. Washington, DC: U.S. Department of Energy http://www.nrel.gov/docs/fy08osti/41869.pdf (http://www.nrel.gov/docs/fy08osti/41869.pdf)
- U.S. Department of Energy. 2011. Report on the First Quadrennial Technology Review. Washington DC: U.S. Department of Energy http://energy.gov/sites/prod/files/QTR_report.pdf (http://energy.gov/sites/prod/files/QTR_report.pdf)
- U.S. Environmental Protection Agency. 2010. Light-Duty Automotive Technology, Carbon Dioxide Emissions, and Fuel Eonomy Trends: 1975 Through 2010. EPA-420-R-10-023. Ann Arbor, MI: U.S. Environmental Protection Agency http://www.epa.gov/otaq/cert/mpg/fetrends/420r10023.pdf (http://www.epa.gov/otaq/cert/mpg/fetrends/420r10023.pdf)
- U.S. Environmental Protection Agency. 2012. Light-Duty Automotive Technology, Carbon Dioxide Emissions, and Fuel Economy Trends: 1975 Through 2011. EPA-420-R-12-001. Ann Arbor, MI: U.S. Environmental Protection Agency http://www.epa.gov/otaq/cert/mpg/fetrends/2012/420r12001.pdf (http://www.epa.gov/otaq/cert/mpg/fetrends/2012/420r12001.pdf)
- Wang , F. , Xiong , X.R. and Liu , C.Z. 2009 . Biofuels in China: Opportunities and challenges . In Vitro Cellular & Developmental Biology—Plant , 45 ( 3 ) : 342 – 349 . doi: 10.1007/s11627-009-9209-7
- Wang , K. , Hissel , D. , Pera , M.C. , Steiner , N. , Marra , D. , Sorrentino , M. , Pianese , C. , Monteverde , M. , Cardone , P. and Saarinen , J. 2011 . A review on solid oxide fuel cell models . International Journal of Hydrogen Energy , 36 ( 12 ) : 7212 – 7228 . doi: 10.1016/j.ijhydene.2011.03.051
- Watson , J.G. , McManus , T. , Eklund , G. , Vigon , B. , Italiano , M. , Franklin , W. , Green , A.E.S. , Green , S. , Harper , G. and Keoleian , G.A. 1994 . 1994 critical review discussion—Sustainable development by design: Review of life cycle design and related approaches . Journal of the Air & Waste Management Association , 44 ( 9 ) : 1083 – 1088 . doi: 10.1080/10473289.1994.10467302
- Wood Buffalo Environmental Association. 2011. Wood Buffalo Environmental Association. Ft McMurray, AB, Canada http://www.wbea.org (http://www.wbea.org)
- Weber , C.L. and Clavin , C. 2012 . Life cycle carbon footprint of shale gas: Review of evidence and implications . Environmental Science & Technology , 46 ( 11 ) : 5688 – 5695 . doi: 10.1021/es300375n
- White , C.M. , Strazisar , B.R. , Granite , E.J. , Hoffman , J.S. and Pennline , H.W. 2003 . 2003 Critical review: Separation and capture of CO2 from large stationary sources and sequestration in geological formations-Coalbeds and deep saline aquifers . Journal of the Air & Waste Management Association , 53 ( 6 ) : 645 – 715 . doi: 10.1080/10473289.2003.10466206
- Williams , J.H. , DeBenedictis , A. , Ghanadan , R. , Mahone , A. , Moore , J. , Morrow , W.R. , Price , S. and Torn , M.S. 2012 . The technology path to deep greenhouse gas emissions cuts by 2050: The pivotal role of electricity . Science , 335 ( 6064 ) : 53 – 59 . doi: 10.1126/science.1208365
- Williams , P.R.D. , Inman , D. , Aden , A. and Heath , G.A. 2009 . Environmental and sustainability factors associated with next-generation biofuels in the US: What do we really know? . Environmental Science & Technology , 43 ( 13 ) : 4763 – 4775 . doi: 10.1021/es900250d
- Wilson , D.G. 2012 . Energy supplies and future engines for land, sea, and air . Journal of the Air & Waste Management Association , 62 ( 6 ) : 607 – 624 . doi: 10.1080/10962247.2012.675403
- Wilson , I.A.G. , McGregor , P.G. and Hall , P.J. 2010 . Energy storage in the UK electrical network: Estimation of the scale and review of technology options . Energy Policy , 38 ( 8 ) : 4099 – 4106 . doi: 10.1016/j.enpol.2010.03.036
- Winebrake , J.J. , Corbett , J.J. and Meyer , P.E. 2007 . Energy use and emissions from marine vessels: A total fuel life cycle approach . Journal of the Air & Waste Management Association , 57 ( 1 ) : 102 – 110 . doi: 10.1080/10473289. 2007.10465301
- Winebrake , J.J. , Corbett , J.J. , Falzarano , A. , Hawker , J.S. , Korfmacher , K. , Ketha , S. and Zilora , S. 2008 . Assessing energy, environmental, and economic tradeoffs in intermodal freight transportation . Journal of the Air & Waste Management Association , 58 ( 8 ) : 1004 – 1013 . doi: 10.3155/1047-3289.58.8.1004
- Xie , W.T. , Dai , Y.J. , Wang , R.Z. and Sumathy , K. 2011 . Concentrated solar energy applications using Fresnel lenses: A review . Renewable & Sustainable Energy Reviews , 15 ( 6 ) : 2588 – 2606 . doi: 10.1016/j.rser.2011.03.031
- Xiong , J. , Zhao , H.B. , Zheng , C.G. , Liu , Z.H. , Zeng , L.D. , Liu , H. and Qiu , J.R. 2009 . An economic feasibility study of O-2/CO2 recycle combustion technology based on existing coal-fired power plants in China . Fuel , 88 ( 6 ) : 1135 – 1142 . doi: 10.1016/j.fuel.2008.12.002
- Xu , J.Z. , Sui , J. , Li , B.Y. and Yang , M.L. 2010 . Research, development and the prospect of combined cooling, heating, and power systems . Energy , 35 ( 11 ) : 4361 – 4367 . doi: 10.1016/j.energy.2009.03.019
- Yan , X.Y. , Inderwildi , O.R. and King , D.A. 2010 . Biofuels and synthetic fuels in the US and China: A review of Well-to-Wheel energy use and greenhouse gas emissions with the impact of land-use change . Energy & Environmental Science , 3 ( 2 ) : 190 – 197 . doi: 10.1039/b915801d
- Yanowitz , J. and McCormick , R.L. 2009 . Effect of E85 on tailpipe emissions from light-duty vehicles . Journal of the Air & Waste Management Association , 59 ( 2 ) : 172 – 182 . doi: 10.3155/1047-3289.59.2.172
- Yao , Q. , Li , S.Q. , Xu , H.W. , Zhuo , J.K. and Song , Q. 2009 . Studies on formation and control of combustion particulate matter in China: A review . Energy , 34 ( 9 ) : 1296 – 1309 . doi: 10.1016/j.energy.2009.03.013
- Yergin , D. 2011 . The Quest: Energy, Security, and the Remaking of the Modern World , New York , NY : The Penguin Press .
- Yu , S.R. and Tao , J. 2009 . Economic, energy and environmental evaluations of biomass-based fuel ethanol projects based on life cycle assessment and simulation . Applied Energy , 86 : S178 – S188 . doi: 10.1016/j.apenergy.2009.04.016
- Zahedi , A. 2011 . A review of drivers, benefits, and challenges in integrating renewable energy sources into electricity grid . Renewable & Sustainable Energy Reviews , 15 ( 9 ) : 4775 – 4779 . doi: 10.1016/j.rser.2011.07.074
- Zeman , F. 2007 . Energy and material balance of CO2 capture from ambient air . Environmental Science & Technology , 41 ( 21 ) : 7558 – 7563 . doi: 10.1021/es070874m
- Zhai , H.B. , Frey , H.C. , Rouphail , N.M. , Goncalves , G.A. and Farias , T.L. 2009 . Comparison of flexible fuel vehicle and life-cycle fuel consumption and emissions of selected pollutants and greenhouse gases for ethanol 85 versus gasoline . Journal of the Air & Waste Management Association , 59 ( 8 ) : 912 – 924 . doi: 10.3155/1047-3289.59.8.912
- Zhang , D.H. , Li , W. and Lin , Y.G. 2009 . Wave energy in China: Current status and perspectives . Renewable Energy , 34 ( 10 ) : 2089 – 2092 . doi: 10.1016/j.renene.2009.03.014
- Zhang , Y. , Singh , S. and Bakshi , B.R. 2010 . Accounting for ecosystem services in life cycle assessment, Part I: A critical review . Environmental Science & Technology , 44 ( 7 ) : 2232 – 2242 . doi: 10.1021/es9021156
- Zhou , X.P. , Wang , F. and Ochieng , R.M. 2010 . A review of solar chimney power technology . Renewable & Sustainable Energy Reviews , 14 ( 8 ) : 2315 – 2338 . doi: 10.1016/j.rser.2010.04.018