
Abstract
An evaluation of the steady-state dispersion model AERMOD was conducted to determine its accuracy at predicting hourly ground-level concentrations of sulfur dioxide (SO2) by comparing model-predicted concentrations to a full year of monitored SO2 data. The two study sites are comprised of three coal-fired electrical generating units (EGUs) located in southwest Indiana. The sites are characterized by tall, buoyant stacks, flat terrain, multiple SO2 monitors, and relatively isolated locations. AERMOD v12060 and AERMOD v12345 with BETA options were evaluated at each study site. For the six monitor–receptor pairs evaluated, AERMOD showed generally good agreement with monitor values for the hourly 99th percentile SO2 design value, with design value ratios that ranged from 0.92 to 1.99. AERMOD was within acceptable performance limits for the Robust Highest Concentration (RHC) statistic (RHC ratios ranged from 0.54 to 1.71) at all six monitors. Analysis of the top 5% of hourly concentrations at the six monitor–receptor sites, paired in time and space, indicated poor model performance in the upper concentration range. The amount of hourly model predicted data that was within a factor of 2 of observations at these higher concentrations ranged from 14 to 43% over the six sites. Analysis of subsets of data showed consistent overprediction during low wind speed and unstable meteorological conditions, and underprediction during stable, low wind conditions. Hourly paired comparisons represent a stringent measure of model performance; however, given the potential for application of hourly model predictions to the SO2 NAAQS design value, this may be appropriate. At these two sites, AERMOD v12345 BETA options do not improve model performance.
Implications:
A regulatory evaluation of AERMOD utilizing quantile-quantile (Q–Q) plots, the RHC statistic, and 99th percentile design value concentrations indicates that model performance is acceptable according to widely accepted regulatory performance limits. However, a scientific evaluation examining hourly paired monitor and model values at concentrations of interest indicates overprediction and underprediction bias that is outside of acceptable model performance measures. Overprediction of 1-hr SO2 concentrations by AERMOD presents major ramifications for state and local permitting authorities when establishing emission limits.
Introduction
The Indiana Department of Environmental Management (IDEM) conducted an evaluation of the steady-state dispersion model AERMOD to determine its accuracy at predicting hourly ground-level concentrations of sulfur dioxide (SO2) by comparing model-predicted concentrations to a full year of monitored SO2 data. Of special interest is how the model performs at regulatory relevant concentrations, at or near the 75 ppb National Ambient Air Quality Standard (NAAQS) for SO2. The two study sites are comprised of three coal-fired electrical generating units (EGUs) located in southwest Indiana. The Gibson and Petersburg/Ratts (P/R) sites are characterized by tall, buoyant stacks, flat terrain, multiple SO2 monitors, and relatively isolated locations.
Although previous model validation work conducted by the U.S. Environmental Protection Agency (EPA) has demonstrated acceptable performance by AERMOD at sites similar to Gibson and P/R (CitationPerry et al., 2005), due to the precise nature of the hourly SO2 NAAQS, concerns about model accuracy have prompted recent validation studies (CitationDresser and Huizer, 2011; CitationChapman, 2011). An urban study conducted in northwest Indiana in 2011 reported overprediction of the 99th percentile 1-hr SO2 concentrations by as much as a factor of 10 (CitationChapman, 2011). Additionally, several investigators have indicated problems of overprediction by AERMOD (and other Gaussian steady-state dispersion models) at low wind speeds (CitationGoyal and Krishna, 2002; CitationPaine et al., 2012; Qian and Venkatram, 2012). These concerns, along with a review of statewide monitoring and model data, prompted an in-depth study of the Gibson and P/R sites.
Model performance criteria were taken from CitationCox and Tikvart (1990), CitationPerry et al. (2005), and the American Society for Testing and Materials method D6589 (ASTM, 2010). These measures are comprised of both paired (in time and space) and unpaired model performance statistics. IDEM conducted a “regulatory” and “scientific” evaluation (CitationCox and Tikvart, 1990; CitationChang and Hanna, 2004) at each of the sites. The regulatory evaluation focused on performance at the high end of the concentration range. These statistics include the 99th percentile design value (DV), the Robust Highest Concentration (RHC) statistic, and quantile-quantile (Q–Q) plots.
The scientific portion of the evaluation pairs model and monitor data in space and time and describes this relationship using widely accepted model performance measures. Some of the major limitations of an hourly model to monitor comparison are the uncertainties associated with atmospheric transport processes, input errors (errors in meteorological or emissions inputs), and uncertainties in model physical formulations (ASTM, 2010; Hanna, 2004). As noted in the EPA Guideline on Air Quality Models, uncertainty in wind direction by 5–10 degrees can result in concentration errors of 20–70%. Uncertainties in atmospheric transport processes (i.e., fluctuations in turbulent velocity) can also cause deviations in observed and predicted concentrations by as much as 50% (Code of Federal Regulations, title 40, section 51).
In spite of these uncertainties, and considering the proposed use of modeling data for attainment demonstrations under the 1-hr SO2 NAAQS standard, examination of both paired and unpaired data should be considered in a model evaluation. Thus, the scientific evaluation included a detailed hourly analysis of paired monitor to model data at each of the six sites. Data were examined in subsets by wind speed and atmospheric stability (according to Monin–Obukhov length) to examine model performance under various meteorological conditions. Hourly performance measures for these data sets are then compared to what previous investigators consider to be “acceptable” model performance measures (CitationChang & Hanna, 2004; CitationKumar et al., 2006).
AERMOD v12060 with regulatory default assumptions was initially used to model the two sites, but since this preliminary study, the EPA released an updated version of the model. AERMOD v12345, released in December 2012, incorporates two BETA options, LOWWIND1 and LOWWIND2, which can be used in conjunction with the AERMET v12345 ADJ_U* nondefault option (adjustment to surface frictional velocity). These modifications attempt to address poor model performance that has been documented at low wind speeds (EPA, 2012). The ADJ_U* option adjusts the surface frictional velocity under low wind speed/stable conditions. LOWWIND1 and LOWWIND2 increase the minimum sigma-v (standard deviation of horizontal velocity fluctuation) value from 0.2 m/sec to default values of 0.5 m/sec and 0.3 m/sec, respectively, and either turn off (LOWWIND1) or modify (LOWWIND2) the horizontal meander component. CitationPaine et al. (2012) found that BETA options improved model performance under low wind speed and stable conditions at low release points; however, they did not see significant improvement at tall stack releases. More details about these options can be found in the AERMOD user's guide addendum (EPA, 2012), model release notes (EPA, 2012), and from CitationQian and Venkatram (2011). This paper describes the results of a model performance analysis for both AERMOD v12060 and AERMOD v12345 with BETA options.
Description of Data
Site description
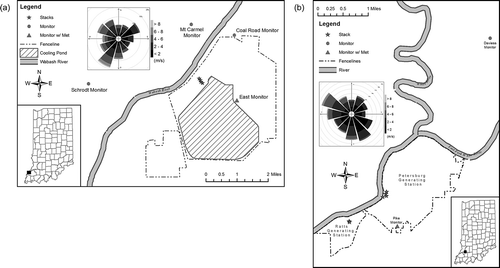
The Gibson site consists of one station operating five boilers with 3145 MW generating capacity. The Petersburg/Ratts (P/R) site is comprised of two stations: Petersburg, which operates four boilers at 1760 MW capacity, and the smaller Ratts station, which operates two boilers at 250 MW capacity and is located 1.34 km (0.83 miles) to the southwest of the Petersburg station. The Gibson and P/R sites are characterized by tall, buoyant stacks, flat terrain, multiple SO2 monitors, and relatively isolated locations ().
Figure 1. Site map of Gibson (a) and Petersburg/Ratts (b) study areas. The wind rose on the Gibson map represents wind speed and direction at the meteorological tower that is colocated with the East Road SO2 monitor and the wind rose on the Petersburg/Ratts map indicates wind speed and direction at the meteorological tower that is colocated with the Pike SO2 monitor.
Emissions data from 2010 were available for each stack from Continuous Emissions Monitoring Systems. These data were comprised of hourly values for each of the boilers and consisted of the following data: SO2 emission rate, stack exit temperature, and stack exit velocity ().
Table 1. Summary of emissions data for Gibson, Petersburg, and Ratts generating stations
Meteorological data
At each study site a full year of on-site (OS) meteorological data for 2010 was used. The data was processed with AERMET v11059 and v12345. The multilevel meteorological parameters that were available at the Gibson meteorological tower (colocated with the East Road SO2 monitor) included wind speed (WS), wind direction (WD), standard deviation of the horizontal wind direction (sigma-theta), temperature (T), solar radiation (rad), and atmospheric pressure (P) at 10, 25, and 60 m. Parameters at the P/R meteorological tower (colocated with the Pike SO2 monitor) consisted of WS, WD, and sigma-theta at 10 m. National Weather Service (NWS) surface data from the Evansville airport (KEVV) were used to fill in any missing data hours from the onsite towers and provided additional information such as cloud cover data. The KEVV tower is located 42 km (26 miles) southeast of Gibson and 59 km (37 miles) southwest of Petersburg/Ratts. The upper air sounding data was from the nearest NWS upper air station in Lincoln, Illinois (KILX). The upper air station at Lincoln is 240 km (149 miles) northwest of the Gibson facility and 255 km (158 miles) northwest of the Petersburg/Ratts facility. The 1-min ASOS wind speed and direction data from the KEVV tower were processed with the EPA AERMINUTE program version 11325.
AERSURFACE v08009 was used to estimate surface roughness in 30-degree wind sectors for a 1-km area upwind from the source. Bowen ratio and albedo were estimated using a 10 by 10 km domain centered on the source. Adjustments to monthly Bowen ratio values were determined by using soil moisture and precipitation data from National Climactic Data Center (NCDC) climatological data reports from KEVV. Adjustments to albedo, Bowen ratio, and surface roughness length during winter months were determined using NCDC snowfall data from KEVV, and the ratio of days with at least 1 inch of snow to days with no snowcover was used to adjust the values (EPA, 2011). Hourly boundary-layer parameters such as mixing height, surface heat flux, and convective velocity scale were calculated by AERMET using surface data from onsite and airport data, surface characteristics, and the morning sounding data from KILX for use in AERMOD ().
Table 2. Summary of surface characteristics for Gibson, P/R, and KEVV
AERMOD v12060/AERMET v11059 processing
Due to concerns with onsite meteorology, there were two different AERMET v11059 modeling runs at each site. The first model run used onsite tower data at Gibson and P/R and supplemented missing surface data with NWS 10-m tower data from KEVV. The second model run utilized only the KEVV 10-m data. The NWS only run was conducted because of suspected issues with sigma theta data at the Gibson–East Road meteorological tower. The tower is sited next to a large cooling pond, potentially yielding measured sigma theta values that are not representative of the modeling domain.
AERMOD v12345/AERMET v12345 processing
All of the meteorological and surface data files were processed with AERMET v12345 and AERSURFACE v13016. There were several modeling scenarios for the AERMOD v12345 analysis: scenario one used AERMET v12345 with No ADJ_U*, scenario two used the AERMET v12345 ADJ U* option, scenario three used the AERMET ADJ U* option plus the AERMOD LOWWIND1 option, and scenario four used the ADJ U* plus LOWWIND2 option. The BETA options were modeled with the default settings. Due to the suspected issues with onsite sigma theta values at Gibson, NWS meteorological data from KEVV were used for all the v12345 runs.
SO2 monitoring and background data
Hourly SO2 monitoring data from 2010 was downloaded from the EPA Air Quality System database for the six monitors located at the two sites. There are two SO2 monitor types associated with the monitoring towers at Gibson and Petersburg/Ratts. The Coal Road, Schrodt, and Daviess monitors are a Teledyne API 100A fluorescent SO2 analyzer utilizing Method EQSA-0495-100 (method detection limit of 0.4 ppb). The East Road, Mt. Carmel, and Daviess monitors operate a Thermo Environmental Instruments model 43i and 43c pulsed fluorescence SO2 analyzer using Method EQSA-0486-060 (method detection limit of 2 ppb) (EPA, 2013). Model receptor terrain heights were calculated by AERMAP, and receptors were placed at the same coordinates as each of the monitors so monitor and model results could be compared in time and space.
In order to make an accurate hourly comparison of monitor and model results, hourly background SO2 was added to model results. The Gibson site has four SO2 monitors, and thus a good degree of spatial coverage, so the minimum observed SO2 value for each hour was used to represent background at the Gibson site (CitationPaine et al. 1998; CitationHanna et al, 2012). The P/R site was limited to just two monitors and onsite background data for hours where at least one monitor was outside the 90-degree downwind area of influence from each of the sources was used (Code of Federal Regulations, title 40, section 51). For the remaining 1600 hr where no valid background level could be determined, the median background level of 3 ppb was used. The use of an annual median background as substitution for hours where monitors were source influenced is a simple, robust, and not overly conservative method for estimating hourly background. Professional judgment was used for hours that were theoretically not source-influenced (according to wind direction data) yet still had abnormally high readings, most likely due to source impacts during hours with low wind speed and subhourly wind shifts. For these hours a threshold that represented the 95th percentile of valid background data (in this case, 6 ppb) was used. Given the isolated nature of these sources, it is highly unlikely that a regional SO2 source would significantly impact these monitors.
Results
Regulatory model validation
The SO2 99th percentile design value (DV) was calculated by using the fourth highest daily max 1-hr value for the 2010 data year. The DV was calculated for both the observed and predicted values and compared using a DV ratio (predicted DV/observed DV). Design value ratios within a factor of two (0.5–2.0) are considered acceptable for the purpose of regulatory performance evaluation () (CitationPerry et al., 2005).
Table 3. DV ratios (predicted DV/observed DV) for 2010 at the six monitor–receptor sites under five modeling scenarios; “OS” and “NWS” refer to onsite and NWS meteorological data runs
For the six monitor–receptor pairs evaluated, AERMOD showed both overprediction and slight underprediction of the 99th percentile DV (0.92–1.99) when using NWS meteorology. A site-wide average DV of all monitor–receptor pairs in each study area resulted in DV ratios ranging from 1.08 to 1.38 at Gibson and from 1.13 to 1.40 at P/R for the five modeling scenarios using NWS meteorology. Results from model-predicted values when using onsite meteorology showed poor performance at the Gibson site, with predicted DVs three times that of the observed DVs at the Coal Road, East Road, and Mt. Carmel monitors. The disparity between predicted design values from onsite and NWS meteorology could be due to issues with siting of the East Road meteorological tower described earlier.
The RHC statistic is a smoothed estimate of the n highest concentrations, and is calculated by ranking the hourly data and using the 26 highest observed and predicted concentrations in the RHC equation:
Table 4. Robust Highest Concentration ratios (predicted RHC/observed RHC) for 2010 at the six monitor–receptor sites under five modeling scenarios; “OS” and “NWS” refer to onsite and NWS meteorological data
The RHC ratios demonstrate acceptable performance by AERMOD at all six sites when using NWS meteorology (ranged from 0.54 to 1.71). A site-wide average RHC of all monitor–receptor pairs in each study area resulted in RHC ratios ranging from 0.87 to 1.10 at Gibson and from 1.25 to 1.57 at P/R for the five modeling scenarios using NWS meteorology. RHC values calculated from the Gibson onsite meteorological data set showed poor model performance, with predicted RHC values up to 3.4 times the observed RHC values. Again, these values may be affected by the East Road meteorological tower data.
Q–Q plots display the unpaired quantile ratios of the ranked model concentrations versus the ranked monitor concentrations and are used to determine whether the two samples come from populations with the same probability distribution. The Q–Q plots in show the distribution of data at Gibson–Coal Road and P/R–Pike under each of the five modeling scenarios.
Figure 2. Q–Q plots of monitor vs. model hourly SO2 data for 2010 Gibson–Coal Road (a) and Petersburg/Ratts–Pike (b) data for five modeling scenarios: (1) AERMOD v12060, (2) AERMOD v12345 with No ADJ_U*, (3) AERMOD v12345 with ADJ_U*, (4) AERMOD v12345 with ADJ_U* and LOWWIND1, and 5() AERMOD v12345 with ADJ_U* and LOWWIND2. Coal Road and Pike data are presented because these two monitors are most often downwind of the source. Solid lines represent 1:1 agreement between the monitor and model, and the dotted lines represent a factor of 2 over- or underprediction.
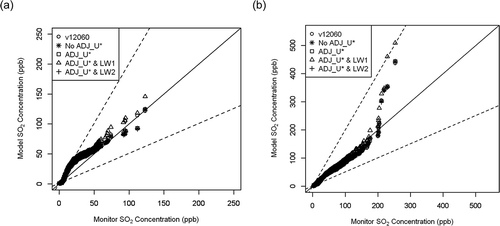
The Q–Q plots show similar distributions under all five modeling scenarios, although the ADJ_U* & LOWWIND 1 distribution indicates slight overprediction bias at Coal Road, while the ADJ_U* & LOWWIND 2 shows slight underprediction at higher concentrations at Coal Road. The Pike plot shows overpredictions by all modeling scenarios at high-end concentrations and by as much as a factor of 2 for the ADJ_U* & LOWWIND 1 scenario.
Scientific model validation
The paired (in time and space) performance analysis consisted of scatterplots of monitor versus model data, as well as a detailed hourly analysis using statistics such as model bias, fractional bias, factor of 2, normalized mean square error (NMSE), geometric mean, and geometric variance. The AERMOD v12345 No ADJ_U* run with NWS meteorology was chosen for presentation of AERMOD hourly performance results. A monitor threshold of 2 ppb was applied to each of the hourly data sets, and hourly background SO2 was added to modeled results.
As seen in , scatterplots show a very poor relationship between hourly predicted and observed concentrations at the Coal Road and Pike sites.
Figure 3. Hourly scatterplots of Gibson–Coal Road (a) and Petersburg/Ratts–Pike (b) for AERMOD v12345 with No ADJ_U* scenario.
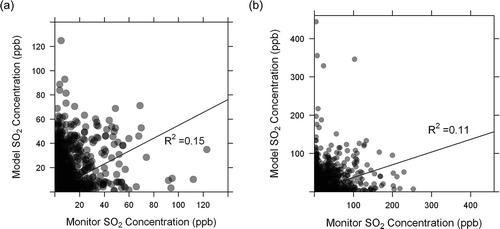
Table 5. Analysis of paired hourly monitor and model data using AERMOD v12345 No ADJ_U* model run with NWS meteorology (Cp = predicted concentration, Co = observed concentration)
Hourly performance measures using all hourly data above the 2 ppb monitor threshold indicate satisfactory performance by AERMOD at each of the six sites (). However, the model and monitor results are dominated by very low values approaching background and may give a biased description of the data sets. Thus, to further analyze model performance at concentrations of interest, paired hourly performance measures were used to analyze the upper 5% of monitor and model values at each of the six sites. The data subset was created by ranking all of the monitor and model data, and after designating the highest 5% percent of concentrations for each individual data set, each point was matched with its associated monitor or model pair for that hour. The data sets were then combined and, as with the full data set, a 2-ppb monitor threshold was applied to each data set and hourly background SO2 was added to all modeled data. Model performance statistics for this subset are presented in .
Table 6. A summary of performance measures for the top 5% of hourly monitor and model data at all six sites using AERMOD v12345 No ADJ_U* model run with NWS meteorology (Cp = predicted concentration, Co = observed concentration)
Analysis of the top 5% of concentrations shows that paired hourly monitor to model results for several performance measures are outside the range of what is accepted as a “good model.” The factor of 2 statistic describes the percentage of data where model-predicted concentrations are within a factor of 2 of observed data. This value ranges from 14 to 43% across the six sites, lower than the 50–80% requirement for a good model (CitationChang and Hanna, 2004; CitationKumar et al., 2006).
Wind speed and atmospheric stability regimes
The hourly data were broken down by wind speed (<2 m/sec, >2 m/sec, 2–4 m/sec, >4 m/sec, 4–6 m/sec, >6 m/sec, and 6–8 m/sec) and atmospheric stability class (stable, unstable, and neutral) using the Monin–Obukhov length (CitationBrode, 2007). In are the summary results of analysis of the upper 5% of monitor and model data at Coal Road and Pike, presented as a function of atmospheric stability and wind speed.
Table 7. A summary of performance measures for the top 5% of Gibson–Coal Road and P/R–Pike monitor and model concentrations using AERMOD v12345 No ADJ_U* model run with NWS meteorology (Cp = predicted concentration, Co = observed concentration) under various meteorological conditions
Analysis of hourly data at Coal Road indicates that, in general, model overprediction occurred during unstable conditions and model underprediction occurred during stable conditions. Overprediction occurred under both low (<2 m/sec) and higher wind speeds (>2 m/sec) at Coal Road, although the scatter was much larger at low wind speeds. Model performance statistics for Pike indicate that overprediction occurred under unstable conditions and underprediction occurred during stable conditions. Under neutral conditions the Pike data set showed underprediction, with a large negative fractional bias. At Pike, low wind speeds also caused overprediction and when in combination with unstable conditions caused substantial overprediction, with a large amount of scatter in the dataset. Low wind speeds combined with stable conditions caused severe underprediction as well, with a large negative bias and scatter in the data set. Given the closer location of the Pike monitor to the source (0.65 mi from Petersburg and 0.96 mi from Ratts, compared to 1.75 mi between Coal Road and Gibson stacks), and the larger emissions values at P/R, the effects of plume meander under low wind speeds may be more prominent at Pike.
Comparison of AERMOD v12060 and AERMOD v12345 BETA options
Hourly model performance statistics for the Gibson–Coal Road site were used to compare the five modeling scenarios: (1) AERMOD v12060 with regulatory default options, (2) AERMOD v12345 with No ADJ_U*, (3) AERMOD v12345 with ADJ_U*, (4) AERMOD v12345 with ADJ_U* plus LOWWIND 1 and (5) AERMOD v12345 with ADJ_U* plus LOWWIND 2. The model-predicted concentrations divided by the observed concentration (Cp/Co) were used to represent model performance under eight different meteorological conditions ().
Figure 4. Adjusted box and whisker plots of Cp/Co at Coal Road for the upper 5% of data for each of eight meteorological scenarios: (a) wind speed <2 m/sec, (b) wind speed >2 m/sec, (c) wind speed >4 m/sec, (d) unstable, (e) stable, (f) neutral, (g) low wind and unstable conditions, (h) low wind and stable conditions. The thick, dark line represents the median and the notches in each box represent the 95% confidence interval around the median. The unfilled circle corresponds to the population mean with error bars representing the 95% confidence interval around the mean. The shaded area represents the range of values acceptable for a “good model,” as defined by CitationChang and Hanna (2004) and CitationKumar et al. (2006).
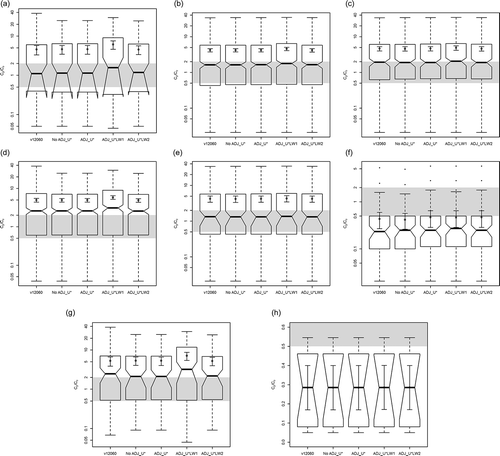
The adjusted boxplots show the central tendency, dispersion, and shape of each of the modeling scenarios. Visual inspection of the boxplots indicates that there is not a significant difference amongst these five modeling runs at the Gibson–Coal Road site and boxplots for the other sites (not shown here) show similar trends. These data indicate that the Cp/Co ratio under low wind speed and stable conditions demonstrates underprediction for all model scenarios. The combination of low wind speed and unstable conditions results in overprediction bias for all modeling scenarios.
Discussion
Based on the regulatory evaluation of AERMOD, the model performance measures (Q–Q plots, design value, and Robust Highest Concentration statistic) indicated performance within an “acceptable” range when appropriate meteorological data was used. Although Q–Q plots are within a factor of 2, examination of these plots indicates issues with overprediction at the high end of the concentration range. Further investigation utilizing a paired hourly analysis of monitor-to-model results for the top 5% of concentrations indicates both overprediction and underprediction that is outside of an acceptable range for hourly model performance measures. At Coal Road, hourly measures under unstable conditions demonstrate consistent model overprediction bias, while stable and neutral conditions result in consistent underprediction bias. At the Pike monitor–receptor pair, low wind speeds exacerbate both the overprediction bias and scatter under unstable conditions and the underprediction bias and scatter under stable conditions.
There are limitations of a study of this kind. Hourly paired comparisons represent an extremely stringent measure of model performance, as even small instrumentation errors or shifts in wind direction can cause a spatial displacement between model predictions and observations. This study represents a summary of model performance based on widely accepted performance measures; however, a more in-depth analysis identifying spatial patterns in model prediction errors would be informative at this site.
For the Gibson site, using NWS meteorology produces more accurate results than the onsite meteorological data set. Care should be taken when using onsite meteorological data as errors in siting or instrumentation can cause bias in model predictions. In this case, the design value and RHC statistic calculated using the onsite meteorological data indicated large overprediction bias when compared to the NWS meteorology. Nonetheless, this author does not anticipate NWS data to be the best meteorological information for use in all situations, and future evaluations should include an assessment of the reliability and appropriateness of using onsite versus NWS meteorological data and whether this should be considered on a case-by-case basis.
At these two study sites, characterized by tall, buoyant stacks and flat terrain, AERMOD v12345 BETA options are not statistically different from regulatory options, and therefore do not improve model performance. Under various meteorological conditions (including low wind) there is no statistical difference between these options. This is consistent with the findings of CitationPaine et al. (2012), who did not see performance improvements from BETA options under low winds at high release stacks, but found improvements at lower release stacks.
The implications of overprediction at the upper end of the concentration range remain a concern. Overprediction of the design value, although within the accepted regulatory model performance limit of a factor of 2, presents major ramifications for state and local permitting authorities when establishing emission limits. For example, it could be difficult to justify up to a 50% decrease in emissions limits for a source if there are known overprediction errors in the model.
Acknowledgment
The author recognizes the contributions to this project by Eric Bailey, Brian Callahan, and Mark Neyman, and helpful suggestions from Keith Baugues, Nathan Byers, Scott Deloney, Ken Ritter, and Brian Wolff.
References
- American Society for Testing and Materials . 2010 . Standard Guide for Statistical Evaluation of Atmospheric Dispersion Model Performance, D6589-05 , West Conshohocken , PA : American Society for Testing and Materials .
- Brode , R. May 2007 . AERMET Training Class , May , New London , CT : Presented by EPA, OAQPS, Air Quality Modeling Group to the NESCAUM Permit Modeling Committee, Annual Meeting . 31
- Chang , J.C. and Hanna , S.R. 2004 . Air quality model performance evaluation . Meteorol. Atmos. Phys , 87 ( 1–3 ) : 167 – 196 . doi: 10.1007/s00703-003-0070-7
- Chapman , L. 2011 . Ambient Sulfur Dioxide Concentrations in Northwest Indiana in 2008: A Comparison Study of Monitored Values and AERMOD Predicted Values , Porter , IN : OCS Environmental .
- Cox , W.M. and Tikvart , J.A. 1990 . A statistical procedure for determining the best performing air quality simulation model . Atmos.Environ , 24A(9) : 2387 – 2395 .
- Dresser , A. and Huizer , R. 2011 . CALPUFF and AERMOD model validation study in the near field: Martins Creek revisited . J. Air Waste Manage. Assoc , 61 : 647 – 659 . doi: 10.3155/1047-3289.61.6.647
- Goyal , P. and Krishna , R. 2002 . Dispersion of pollutants in convective low wind: A case study of Delhi . Atmos. Environ , 36 : 2071 – 2079 . doi: 10.1016/S1352-2310(01)00458
- Hanna , S.R. 2007 . “ A review of uncertainty and sensitivity analyses of atmospheric transport and dispersion models ” . In Developments in Environmental Science 6 , Edited by: Borrego , C. , Renner , E. , Modeling , Air Pollution and XVIII , Its Application . 331 – 349 . Oxford , UK : Elsevier . Ined.
- Hanna , S. , Egan , B. and Paine , B. 2012 . API comments on EPA air dispersion modeling. Presented at the 10th EPA Modeling Conference , 13 – 15 . NC : Research Triangle Park . March
- Kumar , A. , Dixit , S. , Varadarajan , C. , Vijayan , A. and Masuraha , A. 2006 . Evaluation of the AERMOD dispersion model as a function of atmospheric stability for an urban area . Environ. Prog , 25 : 141 – 151 . doi: 10.1002/ep.10129
- Paine , R. , Connors , J. and Szembek , C. 2012 . AERMOD low wind speed evaluation study. Presented at the 10th EPA Modeling Conference , 13 – 15 . NC : Research Triangle Park . March
- Paine , R.J. , Lee , R.F. , Brode , R. , Wilson , R.B. , Cimorelli , A.J. , Perry , S.G. , Weil , J.C. , Venkatram , A. and Peters , W.D. 1998 . Model evaluation results for AERMOD (draft document) , http://www.epa.gov/scram001/7thconf/aermod/evalrep.pdf (accessed June 15, 2013)
- Perry , S.G. , Cimorelli , A.J. , Paine , R.J. , Brode , R.W. , Weil , J.C. , Venkatram , A. , Wilson , R.B. , Lee , R.F. and Peters , W.D. 2005 . AERMOD: A dispersion model for industrial source applications. Part II: Model performance against 17 field study databases . J. Appl. Meteorol , 44 : 694 – 708 . doi: 10.1175/JAM2228.1
- Qian , W. and Venkatram , A. 2011 . Performance of steady-state dispersion models under low wind- speed conditions . Boundary Layer Meteorol , 138 : 475 – 491 . doi: 10.1007/s10546-010-9565-1
- Revision to the Guideline on Air Quality Models . 2005 . Adoption of a Preferred General Purpose (Flat and Complex Terrain) Dispersion Model and Other Revisions; Final Rule . Code of Federal Regulations , Title 40, Pt. 51, App. W
- U.S. Environmental Protection Agency. 2004. Addendum: User's Guide for the AMS/EPA Regulatory Model—AERMOD.accessed July 30, 2013). http://www.epa.gov/scram001/dispersion_prefrec.htm (http://www.epa.gov/scram001/dispersion_prefrec.htm)
- U.S. Environmental Protection Agency. 2011. Regional Meteorological Data Processing Protocol, EPA Region 5 and States (draft). May 6accessed July 30, 2013). http://www.pca.state.mn.us/index.php/view-document.html?gid=17386 (http://www.pca.state.mn.us/index.php/view-document.html?gid=17386)
- U.S. Environmental Protection Agency. 2012. AERMOD Model Change Bulletin: MCB#8accessed May 1, 2013). http://www.epa.gov/ttn/scram/models/aermod/aermod_mcb8.txt (http://www.epa.gov/ttn/scram/models/aermod/aermod_mcb8.txt)
- U.S. Environmental Protection Agency. 2013. List of Designated Reference and Equivalent Methods. U.S. EPA National Exposure Research Laboratory. June 27. Research Triangle Park, NCaccessed July 30, 2013). http://www.epa.gov/ttn/amtic/criteria.html (http://www.epa.gov/ttn/amtic/criteria.html)