
Abstract
The biowaste fractions in municipal solid waste (MSW) are the main odor sources in landfill and cause widespread complaints from residents. The ammonia (NH3) and hydrogen sulfide (H2S) generation processes were simulated and compared between four typical biowaste fractions individually and combined in the mixed MSW. Food waste was found to be the main contributor to odor emission in mixed MSW, with H2S generation potential of 48.4 μg kg−1 and NH3 generation potential of 4742 μg kg−1. Fruit waste was another source for NH3 generation, with 3933 μg kg−1 NH3 generation potential. Meanwhile, nitrogen (N) was released in a faster way than sulfur (S) in waste, since 31% and 46% of total NH3 and H2S were generated in the first 90 days after disposal, with 1811 and 72 μg kg−1, and more emphasis should be placed in this initial period.
Implications: Monitoring of odor generation from biowastes in MSW on a laboratory scale showed that food waste is the main source for NH3 and H2S generation, whereas waste fruit is another main contributor for NH3 released. Generally, N was released in a faster way than S from mixed-waste landfilling.
Introduction
Landfills are the predominated method for municipal solid waste (MSW) disposal. In China, around 78% of MSW was landfilling, with 95.9 Mt MSW in 2010 (National Bureau of Statistics of China, Citation2011). Odors are considered to be the greatest nuisance associated with landfills and cause considerable annoyance and impact both on the environment and amenities in proximity (Chiriac et al., Citation2011; Orzi et al., Citation2010; Karak et al., Citation2013).
Odor emission from MSW is influenced by the waste compositions, the operating conditions, and the weather conditions greatly. Around 47–200 trace components (with less than 1 vol. % of typical landfill gas) have been reported in landfill gas, including hydrocarbons, aromatics, halogenated, etc., which exerts a disproportionate environmental burden (Zou et al., Citation2003; Dincer et al., Citation2006; Scheutz et al., Citation2008; Chiriac et al., Citation2011; Orzi et al., Citation2010). Furthermore, Duan et al. (Citation2014) reported that oxygenated compounds were the most abundant compounds among the measurement factors in landfill, i.e., sulfur compounds, oxygenated compounds, aromatics, hydrocarbons, halogenated compounds, and terpenes. Isobutane, ethyl alcohol, limonene, butane, toluene, and trichlorofluoromethane were recognized as the main compounds on the landfill working surface. Yue et al. (Citation2014) claimed that dimethyl disulfide dominated in the sulfide compounds, accounting for up to 73.6% of the total detected sulfide, and H2S was one of the main biogas components from the landfill operation areas (Yue et al., Citation2014). Field results showed that ammonia was the dominant compound at Laogang Refuse Landfill, with the value of 1800–70,000 ppb (Fang et al., Citation2012). Although amounts of volatile organic compounds, reduced sulfur compounds, carbonyls, nitrogenous compounds, and fatty acids were measured and reported, NH3 and H2S were regarded as the two notable odor components released from landfill due to the high contents in landfill gas (Chiriac et al., Citation2011; Ding et al., Citation2012; Fang et al., Citation2012). Meanwhile, a positive association between ambient H2S concentrations and neighbors’ ratings of landfill malodor was established using conditional fixed-effects regression models, when the wind was blowing in the direction of the community. H2S was one of the landfill gases, which can trigger irritant and physical symptoms (Heaney et al., Citation2011). Thus, both of them were chosen as the target odor components.
Odor generated through the MSW decomposition under the prevailing anaerobic condition has been investigated in some studies (Komilis et al., Citation2004; Staley et al., Citation2006; Orzi et al., Citation2010; Zhang et al., Citation2012a, Citation2012b). Zhang et al. (Citation2012a, Citation2012b) found that lipids and proteins were the main sources for the nonmethane organic compound (NMOC) generation, and the effect of lipids on NMOC quantity lasted longer than that of proteins. NMOCs from refuse, paper, yard waste, and food waste were around 151, 16, 38, and 221 mg C kg−1 dried matter in 320 running days, respectively (Staley et al., Citation2006). Odor emission depends fundamentally on both the quantity and the characteristics of waste compositions, especially for the readily biodegradation fractions, such as food waste, yard waste, etc. (Staley et al., Citation2006; Ko et al., Citation2007; Orzi et al., Citation2010). Nonsource separation collection of waste was operated in most of developing countries (Lou et al., Citation2009), and the different fractions in the mixed MSW without source separation would influence the degradation process of MSW greatly. In order to establish the correlation between the specific groups of odor emissions and the individual MSW fraction, it’s important to identify the contributions of these biowaste fractions to odor emission in the actual landfill, especially in East Asia, where food waste occupies more than half of the total mixed MSW (Lou et al., Citation2009).
The main objective of this study was to evaluate the relationship between the individual MSW fraction and the potential odorant emission, and the typical odors, i.e., NH3 and H2S, from these typical biowaste fractions were measured. The degradation processes of these biofractions were identified and compared in terms of N and S, and the contribution process of the individual biowaste fractions for the NH3 and H2S generation was qualified.
Materials and Methods
Landfill lysimeters
Odor emissions from landfill were simulated in landfill lysimeters with a diameter and height of 300 by 500 mm. Wastes were disposed in the lysimeter of 300 mm height and run under anaerobic condition with a cap sealed in the top column. The gas generation was pumped out by a gas pumping daily and then absorbed by sulfuric acid (H2SO4) and cadmium hydroxide (Ca(OH)2) successively. The gas emitted was collected from a gas sampling port with 0.4 m height on the sidewall in the reactor. Mixed MSW tested was collected from a waste container in the transfer station; mixed MSW consisted of kitchen waste (including food waste and fruit waste, with the ratio of 9:1), stone, paper, glass, wood, plastic, cloth, metals, and residues, with the percentages of 50%, 4%, 12%, 8%, 2%, 15%, 7%, 1%, and 1% (wet basis), respectively.
The biological components in MSW were the main odor sources, and the typical fractions, i.e., food waste (from the canteen in a campus), yard waste (street waste and cleansing waste in a campus, including leaves, branches, weeds, and dusts), paper (including newspaper, cardboard, bathroom tissues), and fruit waste (from the waste bin in a fruit market), were collected and applied in landfill lysimeters, with the corresponding weights of 2.2, 3.9, 2.0, 2.3, and 2.4 kg (wet basis), respectively. The wastes were disposed in landfill lysmeters and kept running at a constant temperature of 37 ± 2 °C after stripped with the protection gas of N2 to guarantee an anaerobic condition.
Analysis methods
The generation rate and cumulative amounts of typical odorants, i.e., H2S and NH3, were measured using Nessler’s reagent colorimetric method (GB/T 14668-1993; Ministry of Environmental Protection, People’s Republic of China) and methylene blue spectrophotometry, respectively (Ministry of Environmental Protection of the People’s Republic of China, Editorial Board of Air and Emission Monitoring and Analysis Methods, Citation2003). “Olfacomat” dynamic dilution olfactometer (XP-329-III odor level indicator; New Cosmos Electric Co., Ltd., Japan) was used to determine the odor concentration.
Gas chromatography instrument (Agilent 3000 Micro GC, HP5890 II; Agilent Technologies, Wilmington, DE, USA), equipped with CPWAX 30 × 0.32 mm column, was used for volatile fatty acid (VFA) analysis using an external standard. N2 was used as the carrier gas, with flow rate at 2 mL min−1. The oven temperature was initially set at 110 °C for 5 min and then increased to 220 °C for 2 min with the predetermined rate of 10 °C min−1. The duration times of the typical VFAs, i.e., acetate, propionate, isobutyrate, butyrate, isovalerate, and valerate, were at 4.4, 5.3, 5.6, 6.3, 6.8, and 7.5 min, respectively.
Waste samples were dried at 105 °C in the furnace until a stable weight was obtained and were then crushed and grinded to pass through the screen with a 200 mesh sieve (0.074 mm). The samples were quartered until a sample size of about 100 g remained. Triple samples were applied and measured with CHNS model using element analyzer (Vario EL III; Elementar Analysen System GmbH, Hanau, Germany).
Results
General characteristics of biowaste fractions
The main biowaste fractions in the mixed MSW could be classified as food waste, fruit waste, yard waste, and paper, and the general characteristics of these wastes are shown in . A neutral pH of 7.4 was obtained in the mixed MSW, whereas that in food waste, fruit waste, and paper was 4.4, 5.7, and 7.8, respectively, meaning that food waste and fruit waste were the readily biodegradable matters, and both were present in the acidification phase after several hours’ stay at the generation points. The bulky density of food waste was at the highest value of 492 kg m−3, compared with the other biowaste fractions. Moisture contents in the mixed MSW, food waste, and fruits waste were very high, and those in yard waste and paper were low, which resulted in a slow degradation process.
Table 1. Characteristics of MSW in the landfill lysimeters
C, H, O, N, and S were the main contents in these wastes according to the element analysis results, and other elements were omitted due to the low contents. C/N ratio in the food waste was 10.5, and the introduction of the food waste decreased the C/N ratio in the mixed MSW. The higher N content in these biowastes might result in a higher NH3 concentration released, compared with S and H2S contents. Fruit waste and yard waste presented a high ash content of 19.9% and 18.3%, respectively.
Molecular formula could be used to predict the theoretical odor emission, and an apparent molecular formula was simulated based on the element analysis results. The apparent molecular weight of waste could be assigned as , and S was chosen as the standard element for the molecular formula simulation here. It was found that the corresponding typical molecular formulas of biowaste fractions were
of mixed waste,
of food waste,
of paper,
of yard waste, and
of fruit waste. The apparent molecular formula of these five wastes varied greatly; thus, the corresponding NH3 and H2S emission potentials were different.
Odor emissions from MSW landfilling
The generation rates and cumulative volumes of H2S and NH3 from five biowaste fractions under the test periods are shown in .
Figure 1. The generation rates and the cumulative amounts of NH3 and H2S from landfill lysimeters.
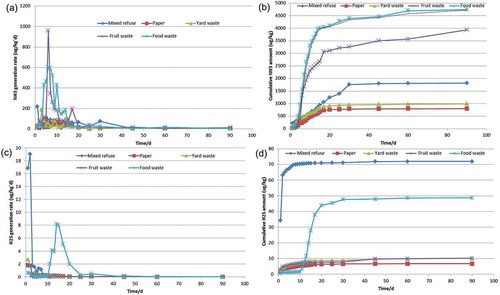
NH3 generation rates from food waste and fruit waste were 4 and 2 times, respectively, higher than that from mixed MSW (with food waste of 45%). The maximum generation rates were observed during the period between 4 and 10 days after landfilling, generation rates then reached a low value after 45 days of reaction. The NH3 generation processes of these four wastes were also different, and those in fruit waste and food waste were faster, with the highest values of 3915 and 1946 μg kg−1 on the 6th day, whereas the maximum NH3 generation rates of 106 μg kg−1 (5th day) and 154 μg kg−1 (14th day) were present in paper and yard waste, meaning that fruit waste and food waste were more readily degradable materials, especially for the N removal. The cumulative NH3 amount increased from 5.9 to 3964 μg kg−1 and 15.8 to 2610 μg kg−1 in the first 14 days in food waste and fruit waste reactors, respectively. The generation rate increased after 20 days in the paper and yard waste fractions, whereas that in mixed MSW increased after 30 days, meaning that NH3 released in a more rapid rate from the food waste and fruit waste reactions.
A great variation of H2S generation was observed in the test period, and a maximum generation rate was obtained immediately after landfilling. The cumulative H2S generation reached a stable value after 9 days in mixed MSW, 10 days in paper, 12 days in yard waste, and 9 days in fruit waste, respectively. For food waste, H2S emission increased from 1.6 to 43.9 μg kg−1 in the period of 10–20 days, and the inhibition of high content of salt in food waste might relieve after the natural cultivation. Maximum H2S amount was obtained in mixed MSW, with the value of 71.9 μg kg−1 (wet waste), followed by 48.8 μg kg−1 (wet waste) in food waste. It could be predicted that food waste and other non-bio-MSW, such as the waste gypsum in the construction and demolition waste, might be the main contributors for H2S generation from landfill. It should be pointed out that pH in these lysimeters were also different. pH in leachate from mixed waste, food waste, fruit waste, and yard waste were 7.7, 3.99, 4.29, and 5.72, whereas pH in paper was undetectable due to the less of leachate, as shown in . The lower pH value might be also helpful for the formation of H2S that escaped from the lysimeters.
Table 2. VFA concentration from individual waste components
The odor concentration from these waste fractions was also characterized by olfactometery, as shown in . It could be that odor from food waste was more intense, compared with fruit waste, mixed waste, yard waste, and papers.
Figure 2. Olfactometery values from landfill lysimeters with the individual MSW fractions.
VFA concentration and leachate properties from landfill lysimeters
VFAs were expected upon decomposition of organic matter containing carbohydrates and proteins and thus could be regarded as one of the promising odor indicators (Qamaruz-Zaman and Milke, Citation2012). VFAs in leachate are shown in . All the six typical VFAs could be found in the food waste and mixed MSW, and the total concentration in food waste was higher than all the other biowastes. Both propionic acid and butyrate concentrations were in the high level in the food waste fraction, meaning that this lysimeter was in the acid accumulative phase, with a pH of 4.4.
Leachate amount could also be referred as the indictor for the waste degradation phase. Leachate of 90 and 0 mL with low VFA concentration was generated in the landfill lysimeters of yard waste and paper, respectively, indicating that both degraded in a slower way. Chemical oxygen demand (COD) in leachate from food waste and mixed MSW was 56,000 and 17,760 mg L−1, respectively, which would also contribute to the odor emission in landfill.
Discussion
The generation and distribution process of NH3 and H2S from waste landfilling
N/S ratios of the mixed waste, food waste, yard waste, fruit waste, and paper were 1.5, 5.7, 6.7, 5.1, and 6.6, respectively, according to the element analysis results, whereas the corresponding N/S ratios of NH3 and H2S emissions were 22, 85, 85, 338, and 104 (M M−1), respectively. N in waste was easier to be decomposed and converted into NH3, compared with S under the test conditions, even pH values in these systems were in acid or neutral range. N in fruit waste might release in a faster way, compared with the other biowaste fractions, since N/S ratio from fruit waste was 66 times higher than that in the mixed MSW, whereas those in other fractions were 12.7–15.8 times higher. These results were also tested in Fang’s field measurement of Laogang Refuse Landfill, where ammonia was the dominant compound in landfill (Fang et al., Citation2012), and nitrogen in waste can easily be converted to ammonia (Archer et al., Citation2005).
Total nitrogen (TN) was present at 1267 and 1295 mg L−1 in leachate from mixed MSW and food waste, respectively, whereas that in fruit waste was 430 mg L−1. Therefore, around 446, 788, 184, 3.9, and 1.5 mg N (including N in leachate and landfill gas) were generated from mixed waste, food waste, fruit waste, yard waste, and paper in the test period, which occupied around 0.8%, 0.5%, 0.4%, <0.01%, and <0.01% of total N contents in the respective raw wastes, and most of N in those biowastes was still present in the residual wastes after 90 days of decomposition. The ratios of N in the leachate/landfill gas were 133, 50, and 22 in the mixed MSW, food waste, and fruit waste, respectively, indicating that N released preferred to be present in the liquid phase due to the acidification phase in the landfill lysimeters. The other fractions in mixed MSW might also influence N distribution process greatly, which resulted in more N generated in leachate, compared with the other biowaste fractions (Lou et al., Citation2009).
Landfill gas generation process could be roughly modeled using the theoretical first-order kinetic model, such as Scholl Canyon model (Thompson and Tanapat, Citation2005). As two of the landfill biogas components, H2S and NH3 generation was supported to follow the first-order kinetic model. The maximum cumulative generation of NH3 and H2S could reach around 5852 and 158 μg kg−1 (wet basis), respectively, in the mixed MSW in Shanghai, China, whereas 1811 and 72 μg kg−1 of NH3 and H2S were generated in the test period, which were about 31% and 46% of the maximum cumulative generation, respectively. More emphasis should be placed in the landfill in the initial period (i.e., the first 3 months) after waste disposal, to reduce the NH3 and H2S emissions. Particularly, the odor emissions varied as the MSW landfilling ages extended, and the concentrations of oxygenated compounds increased, whereas those of sulfur compounds decreased significantly. Closure operation in landfill was useful and efficient in reduction of the malodorous gas (Solan et al., Citation2010).
The contribution of individual biowastes to the odor emission
According to the Ding’s report based on the filed measurement of Tianziling landfill site, Hangzhou, China, H2S (56.58–579.84 µg m−3) and NH3 (520–4460 µg m−3) were the notable odor components, contributing 4.47–10.92% and 83.91–93.94% of total odor concentrations, respectively, and both of them varied with different locations in the landfill site, which were significantly affected by environmental factors, including temperature, air pressure, and wind direction. Thus, understanding NH3 and H2S generation processes will benefit the development of potential odor control process.
Food waste, fruit waste, paper, and yard waste (including wood and the residues) occupied around 45%, 6%, 12%, and 3% of the mixed MSW according to the practical experiences in Shanghai. These four biowaste fractions were the main readily biodegradation fractions in the mixed MSW and contributed to the odor emission greatly. The generation rates of NH3 and H2S were around 798, 990, 3933, and 4742 μg kg−1 and 6.7, 10.2, 10.2, and 48.8 μg kg−1 in the paper, yard waste, fruit waste, and food waste (wet basis) after 90 days, respectively.
Total amounts of NH3 and H2S could be around 2476 and 23.8 μg kg−1 based on the individual contribution of these four biowastes in mixed MSW, whereas around 1811 μg kg−1 NH3 and 71.9 μg kg−1 H2S were generated from the actual mixed MSW tested. The four biowaste fractions contributed 136% and 33% of NH3 and H2S generation from the mixed MSW, and food waste individually contributed around 118% and 31% of the total NH3 and H2S emissions from landfill. Therefore, biowastes predominated in NH3 emission in landfill gas, and food waste was the main source for NH3 and H2S, and some of the H2S in mixed MSW might be generated from the other S content components. Moreover, the mixture of other substances in mixed MSW might influence the NH3 generation rate and N distribution ratios between landfill gas and leachate greatly. Some components in the mixed MSW, such as heavy metals and salt, might inhibit the NH3 generation rate and thus delay NH3 release from waste in the initial period (Östman et al., Citation2006). It was also found that around 199.2, 75.6, 1.9, and 0.7 mg kg−1 N (including NH3 in landfill gas and TN in leachate) were released from food waste, fruit waste, yard waste, and paper in the test period, with a total N of 94.4 mg kg−1 released based on the actual MSW compositions. The total N generated from mixed MSW was 1994 mg kg−1, and around 47.3% of total N was released from those four biowaste fractions. More N was released in terms of leachate from mixed MSW due to the influence of the other fractions.
It should be pointed out the odor compositions will be different if the operation conditions changed. Komilis et al. (Citation2004) identified and quantified volatile and semivolatile organic compounds (VOCs) produced during composting of the organic fraction of MSW under the controlled aerobic conditions. It was found that paper primarily produced alkylated benzenes, alcohols, and alkanes. Yard wastes primarily produced terpenes, alkylated benzenes, ketones, and alkanes, whereas food wastes primarily produced sulfides, acids, and alcohols. Approximately 6.5, 0.83, and 0.33 mg dry kg−1 of 13 volatile and semivolatile aromatic organic compounds combined generated from the mixed paper, yard wastes, and food wastes. All VOCs were emitted early during the composting process, and their production rates decreased with time at thermophilic temperatures. Therefore, the VOCs in waste should also be considered in the future.
Conclusions
The apparent molecular formula of those five wastes was modeled based on the element analysis, and the theoretic NH3 and H2S amounts generated could be estimated through the assumption that most of S and N will converse into H2S and NH3 under the anaerobic digestion process. Biowastes were the main contributors for the odor emission. Food waste and fruit waste have the higher NH3 generation potential, and food waste was also the main contributor for H2S released, compared with the other biowastes in mixed MSW. Around 31% and 46% of the total theoretic NH3 and H2S amounts were released in the test period, and more emphasis should be considered for odor abatement after waste landfilling, especially in the first 30 days. For the typical odor sources, the degradation rate of N was faster than that of S in the mixed MSW, and N preferred to be present in the liquid phase, such as leachate. The prohibition of food waste and fruit waste into the landfill will reduce odor emission from landfill greatly, just as the European Union (EU) has done in Council Directive 99/31/EC.
Funding
This work was financially supported by National Nature Science Foundation of China (nos. 41173108, 51278350), Shanghai Rising-Star Program (14QA1402400), SMC–New Artist Scholar Award Plan (B), Key Project of Science and Technology Commission of Shanghai Municipality (no. 13DZ0511600), and National Key Technology R&D Program (no. 2014BAL02B03-4).
Additional information
Funding
Notes on contributors
Ziyang Lou
Ziyang Lou is an associate professor at the School of Environmental Science and Engineering, Shanghai Jiaotong University, Shanghai, People’s Republic of China.
Mingchao Wang
Mingchao Wang is a master’s degree student at The State Key Laboratory of Pollution Control and Resource Reuse, School of Environmental Science and Engineering, Tongji University, Shanghai, People’s Republic of China.
Youcai Zhao
Youcai Zhao and Renhua Huang are professors at The State Key Laboratory of Pollution Control and Resource Reuse, School of Environmental Science and Engineering, Tongji University, Shanghai, People’s Republic of China.
Renhua Huang
Youcai Zhao and Renhua Huang are professors at The State Key Laboratory of Pollution Control and Resource Reuse, School of Environmental Science and Engineering, Tongji University, Shanghai, People’s Republic of China.
References
- Archer, E., A. Baddeley, A. Klein, J. Schwager, and K. Whiting. 2005. Mechanical biological treatment: A guide for decision makers process, policies and markets. In Annexe A Process Fundamentals, 53–54. Uley, England: Juniper Consultancy Services Ltd. http://www.cti2000.it/Bionett/BioG-2005-004%20MBT_Annexe%20A_Final_Revised.pdf (accessed February 24, 2015).
- Chiriac, R., A.M.J. De, J. Carre, R. Bayard, J.M. Chovelon, and R. Gourdon. 2011. Study of the VOC emissions from a municipal solid waste storage pilot-scale cell: Comparison with biogases from municipal waste landfill site. Waste Manage. 31:2294–2301. doi:10.1016/j.wasman.2011.06.009
- Dincer, F., M. Odabasi, and A. Muezzinoglu. 2006. Chemical characterization of odorous gases at a landfill site by gas chromatography-mass spectrometry. J. Chromatogr. 1122:222–229. doi:10.1016/j.chroma.2006.04.075
- Ding, Y., C.Y. Cai, B. Hu, Y.E. Xu, X.J. Zhe, Y.X. Chen, and W.X. Wu. 2012. Characterization and control of odorous gases at a landfill site: A case study in Hangzhou, China. Waste Manage. 32:317–326.
- Duan, Z., W. Lu, D. Li, and H. Wang. 2014. Temporal variation of trace compound emission on the working surface of a landfill in Beijing, China. Atmos. Environ. 88:230–238. doi:10.1016/j.atmosenv.2014.01.051
- European Union Council Directive 99/31/EC, 1999. http://www.decimpianti.com/corporate/docs/EU_DIRECTIVE_1999.13.EC.pdf
- Fang. J., N. Yang, D. Cen, L. Shao, and P. He. 2012. Odor compounds from different sources of landfill: Characterization and source identification. Waste Manage. 32:1401–1410. doi:10.1016/j.wasman.2012.02.013
- Heaney, C.D., S. Wing, R.L. Campbell, D. Caldwell, B. Hopkins, D. Richardson, and K. Yeatts. 2011. Relation between malodor, ambient hydrogen sulfide, and health in a community bordering a landfill. Environ. Res. 111:847–852.
- Karak, T., P. Bhattacharyy, T. Das, R.K. Paul, and R. Bezbaruah. 2013. Non-segregated municipal solid waste in an open dumping ground: A potential contaminant in relation to environmental health. Int. J. Environ. Sci. Technol. 10:503–518. doi:10.1007/s13762-013-0184-5
- Ko, J.Y., Phae, C.G., and Park, J.S. 2007. Effect of food waste direct landfilling prohibition on characteristics of landfill gas and leachate. J. Ind. Eng. Chem. 18:612–617.
- Komilis, D.P., R.K. Ham, and J.K. Park. 2004. Emission of volatile organic compounds during composting of municipal solid wastes. Water Res. 38:1707–1714. doi:10.1016/j.watres.2003.12.039
- Lou, Z., Y. Zhao, X. Chai, T. Yuan, Y. Song, and D. Niu. 2009. Landfill refuse stabilization process characterized by nutrient change. Environ. Eng. Sci. 26:1655–1660. doi:10.1089/ees.2008.0128
- Ministry of Environmental Protection of the People’s Republic of China Editorial Board of Air and Emission Monitoring and Analysis Methods. 2003. Air and Emission Monitoring and Analysis Methods. Beijing: China Environmental Science Press.
- National Bureau of Statistics of China. 2011. China Statistical Yearbook (2010). Beijing: China Statistics Press.
- Orzi, V., E. Cadena, G. D’Imporzano, A. Artola, E. Davoli, M. Crivelli, and F. Adani. 2010. Potential odour emission measurement in organic fraction of municipal solid waste during anaerobic digestion: Relationship with process and biological stability parameters. Bioresour. Technol. 101: 7330–7337. doi:10.1016/j.biortech.2010.04.098
- Östman, M., O. Wahlberg, S. Ågren, and A. Mårtensson. 2006. Metal and organic matter contents in a combined household and industrial landfill. Waste Manage. 26:29–40. doi:10.1016/j.wasman.2005.01.012
- Qamaruz-Zaman, N., and M.W. Milke. 2012. VFA and ammonia from residential food waste as indicators of odor potential. Waste Manage. 32: 2426–2430. doi:10.1016/j.wasman.2012.06.023
- Scheutz, C., J. Bogner, J.P. Chanton, D. Blake, M. Morcet, C. Aran, and P. Kjeldsen. 2008. Atmospheric emissions and attenuation of non-methane organic compounds in cover soils at a French landfill. Waste Manage. 28:1892–1908. doi:10.1016/j.wasman.2007.09.010
- Solan, P.J., V.A. Dodd, and T.P. Curran. 2010. Evaluation of the odour reduction potential of alternative cover materials at a commercial landfill. Bioresour. Technol. 101:1115–1119. doi:10.1016/j.biortech.2009.09.030
- Staley, B.F., F. Xu, S.J. Cowie, M.A. Barlaz, and G.R. Hater. 2006. Release of trace organic compounds during the decomposition of municipal solid waste components. Environ. Sci. Technol. 40:5984–5991. doi:10.1021/es060786m
- Thompson, S., and S. Tanapat. 2005. Modeling waste management options for greenhouse gas reduction. J. Environ. Informatics 6:16–24. doi:10.3808/jei.200500051
- Yue, D., B. Han, Y. Sun, and T. Yang. 2014. Sulfide emissions from different areas of a municipal solid waste landfill in China. Waste Manage. 34: 1041–1044. doi:10.1016/j.wasman.2013.07.020
- Zhang, Y., D. Yue, J. Liu, L. He, and Y. Nie. 2012a. Effect of organic compositions of aerobically pretreated municipal solid waste on non-methane organic compound emissions during anaerobic degradation. Waste Manage. 32:116–1121. doi:10.1016/j.wasman.2012.01.005
- Zhang, Y., D. Yue, J. Liu, P. Lu, Y. Wang, J. Liu, and Y. Nie. 2012b. Release of non-methane organic compounds during simulated landfilling of aerobically pretreated municipal solid waste. J. Environ. Manage. 101:54–58. doi:10.1016/j.jenvman.2011.10.018
- Zou, S.C., S.C. Lee, C.Y. Chan, K.F. Ho, X.M. Wang, L.Y. Chan, and Z.X. Zhang. 2003. Characterization of ambient volatile organic compounds at a landfill site in Guangzhou, South China. Chemosphere 51:1015–1022. doi:10.1016/S0045-6535(03)00004-3