
Abstract
Nitrous acid (HONO) plays a key role in tropospheric photochemistry, primarily due to its role as a source of hydroxyl (OH) radicals via its rapid photolysis. OH radicals are involved in photooxidation processes, such as the formation of tropospheric O3 and other secondary atmospheric pollutants (peroxyacetyl nitrate [PAN] and secondary particles). Recent field and modeling studies have postulated the occurrence of a strong and unknown daytime HONO source, but there are still many significant uncertainties concerning the identification and formation mechanisms of these unknown sources. Up to now, five HONO formation pathways are known: direct emission, homogeneous gas-phase reactions, heterogeneous reactions, surface photolysis, and biological processes. In this review paper, the HONO sources proposed to explain the observed HONO budget, especially during daytime, are discussed, highlighting the knowledge gaps that need further investigation. In this framework, it is crucial to have available accurate and reliable measurements of atmospheric HONO concentrations; thus, a short description of HONO measurement techniques currently available is also reported. The techniques are divided into three basic categories: spectroscopic techniques, wet chemical techniques, and off-line methods.
Implications:
As important OH radical precursor, HONO plays a key role in the atmosphere. OH radicals are involved in photo-oxidation processes, resulting in the formation of tropospheric O3 and secondary pollutants (PAN and secondary particles). The identification of species affecting the oxidation capacity of the atmosphere is crucial for the understanding of the tropospheric chemistry and in determining effective pollution control strategies. Current models underestimate HONO, especially during daytime, since sources are lacking. Although significant uncertainties still exist, some additional sources contributing to HONO budget have been discussed. Advantages and limitations of the currently HONO measurement techniques are also reported.
Introduction
Since the late 1970s, nitrous acid (HONO) has been identified as atmospheric key species due to its role of direct source of hydroxyl (OH) radicals (Perner and Platt, Citation1979). The OH radicals are involved in the formation of ozone (O3) and peroxyacetylnitrates (PANs), causing the so-called “photochemical smog” in polluted regions and contribute to the oxidation of volatile organic compounds (VOCs), forming secondary oxygenated gaseous and particulate species. In the past, the HONO photolysis (R1; 300 < λ < 405 nm) was considered a dominant source of OH radicals in the early morning, when other primary HOx (OH + HO2) sources, such as the photolysis of O3 and formaldehyde (HCHO), are still weak.
Alvarez et al. (Citation2013) showed that the HONO photolysis may be an important indoor OH source under certain conditions (such as direct solar irradiation inside the room), causing indoor OH concentrations similar to the urban outdoor OH levels.
HONO is also proposed as a toxic and harmful pollutant. Short-term exposures to elevated HONO concentrations may damage mucous membranes, the respiratory system of asthmatics (Rasmussen et al., Citation1995). HONO is also precursor of the mutagenic and carcinogenic nitrosamines by its reaction with secondary and tertiary amines (Pitts et al., Citation1978; Sleiman et al., Citation2010).
In the last few decades, field experiments have been carried out at remote, rural, and urban locations, reporting atmospheric HONO concentrations to range from a few ppt in remote and clean areas (Beine et al., Citation2001; Zhou et al., Citation2001; Honrath et al., Citation2002; Liao et al., Citation2006; Villena et al., Citation2011b) up to 15 ppb in a polluted urban site (Elshorbany et al., Citation2009, Citation2010; Spataro et al., Citation2013). Recent studies highlighted a daytime unknown HONO source, having strength in the order of 90, 500–600, and 2 ppb hr−1 in polar, rural, and urban environments, respectively (Kleffmann et al., Citation2005; Acker et al., Citation2006; Villena et al., Citation2011b; Wong et al., Citation2011; Li et al., Citation2012; Spataro et al., Citation2013). Rappenglück et al. (Citation2014) daytime HONO source strength reaching up to 10 ppb hr−1 near snow surface at relatively low altitudes and under extreme conditions.
The formation mechanisms of HONO in the atmosphere are still under discussions. Kleffmann (Citation2007) reported that HONO is mainly produced by heterogeneous processes, such as the NO2 conversion on different surfaces. However, the HONO sources, especially during daytime, are still elusive.
This article reviews the recent progresses in understanding of HONO formation and sink processes in the troposphere, especially during daytime. The contribution of different reactions to the HONO budget is discussed, evaluating the cognitive gaps related to this pollutant. Finally, recommendations of further researches needed to better understand and define the HONO budget are also reported.
HONO Formation Rate and Photostationary State (PPS)
The atmospheric HONO concentrations are affected by several processes, which can cause its formation or removal in the troposphere. The HONO formation rate can be expressed by the following equation, including HONO source/production (Pi) and losses (Li) processes (Spataro et al., Citation2013):
indicates the HONO sources including the known HONO sources (Pi, known) and the missing daytime HONO sources (Punknown). The second one, , indicates the HONO losses including three processes: the R1 (Lphoto) and R2 (LHONO+OH) reactions and the dry HONO deposition (Ldep). The third term,
, includes the vertical (TV) and horizontal (Th) transport processes (Su et al., Citation2008b, Sörgel et al., Citation2011, Spataro et al., Citation2013). According to the modeling analysis by Czader et al. (Citation2012), Tv and Th can reach appreciable amounts. TV and Th can be sources or sinks depending on the HONO concentration in advected air compared with the HONO concentration at the measurement site (and height) (Sörgel et al., Citation2011). If HONO is formed at the ground or near surface aerosol, TV means a sink because vertical mixing dilutes HONO formed near the ground.
Ldep can be estimated by dividing the dry deposition velocity (Harrison et al., Citation1996) with the boundary layer height. TV can be estimated as in Dillon et al. (Citation2002). During daytime, when more turbulence occurs in the atmosphere and Lphoto is high, both Ldep and TV are small compared with Lphoto and they can be neglected (Su et al., Citation2008b, Sörgel et al., Citation2011, Spataro et al., Citation2013). During nighttime, the boundary layer is stable and Lphoto is small. Both Ldep and TV cannot be neglected, because this would result in the Punknown underestimation (Sörgel et al., Citation2011). Su et al. (Citation2008b) reported that Th can be ignored assuming weak horizontal transport effects of HONO. This last simplification is reliable in a relatively homogeneous atmosphere with low wind speeds (Su et al., Citation2008b, Sörgel et al., Citation2011).
Assuming that the daytime HONO concentrations reach an instantaneous photoequilibrium around midday, as a photostationary state (PSS approach; d[HONO]/dt ≈ 0), the HONO production rate related to the unknown source (Punknown) can be determined as follows:
Great care must be exercised using PSS method to quantify the unexplained secondary HONO source strength. Since the model input data can vary significantly on short time scale, the PSS approach might not be correct (Kleffmann et al., Citation2005; Lee et al., Citation2013).
Formation Pathways of HONO
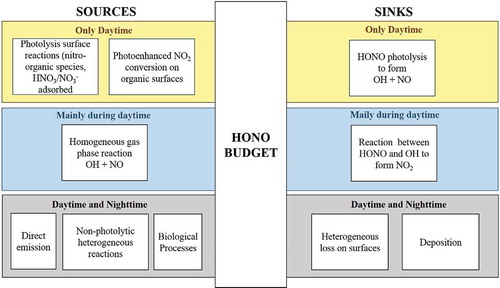
Despite the importance of HONO for atmospheric chemistry and its potential effects on the human health, the HONO sources are still not completely identified. There are five HONO formation pathways actually known: direct emission, homogeneous gas-phase reactions, heterogeneous reactions, surface photolysis, and biological processes (Kleffmann, Citation2007; Su et al., Citation2011). The major HONO source and loss pathways are reported in . In the following, a short description and discussion of the presently established formation pathways is reported.
Figure 1. A schematic sketch over the chemical processes acting as sources and sink for nitrous acid (HONO) in the lower atmosphere. The processes occurring only in presence of solar radiation are reported in the yellow section, whereas the processes producing and removing HONO mainly during daytime are showed in the blue section. Finally, the gray section includes the sources and sinks of HONO operating similarly both during daytime and nighttime.
Direct emission
HONO can be directly emitted into the troposphere by combustion processes such as biomass burning, vehicle exhaust, domestic heating, and industrial burn. The quantitative determination of direct HONO emission was mainly focused to quantify the contribution related to vehicle tailpipes.
Pitts et al. (Citation1984) found that cars with three-way catalyst emitted lower HONO and NO levels than station wagons equipped with leaded gasoline engine. The HONO to nitrogen oxides (NOx) ratios (HONO/NOx) ranged between 1 × 10⁻³ and 8 × 10⁻³, with higher ratios associated with older light-duty motor vehicles without emission control devices.
Kichstetter et al. (Citation1996) determined HONO/NOx ratios ranging between 2.4 × 10⁻³ and 3.4 × 10⁻³ at the Caldecott Tunnel (San Francisco Bay). These values were comparable to the HONO/NOx ratios reported by Pitts et al. (Citation1984). Similarly, Kurtenbach et al. (Citation2001) measured simultaneously HONO, nitrogen dioxide (NO2), nitrogen monoxide (NO), and carbon dioxide (CO2) in the Wuppertal Kiesbergtunnel (Germany), determining the direct HONO emission from both single vehicles (such as a truck, a diesel passenger car, or a gasoline passenger car) and a traffic fleet. Higher HONO concentrations were measured during higher density traffic and were related to the using conditions of the single vehicles. The heterogeneous HONO formation on tunnel walls was investigated and determined to be strongly dependent on the residence time of an air parcel and on the surface-to-volume (S/V) ratio in the tunnel. The authors concluded that during high traffic density, direct HONO emission was more important than heterogeneous NO2 into HONO conversion on tunnel walls. In contrast, during low traffic density, the HONO concentration was dominated by heterogeneous NO2 conversion on tunnel walls. The calculated average HONO/NOx ratio of (8 ± 1) × 10−3 was higher than that obtained by Kirchstetter et al. (Citation1996), (2.9 ± 0.3) × 10−3. The difference can be related to the type of vehicles, which in the Kiesbergtunnel was mainly composed by diesel-fueled vehicles.
These traffic tunnel studies showed that on average only 0.3–0.8% of the total traffic-induced NOx (NO + NO2) can be attributed to direct emitted HONO, suggesting that direct traffic emission can contribute significantly to the tropospheric HONO budget only in areas with high traffic volume. The atmospheric HONO/NOx ratios observed in the atmosphere are usually higher than those calculated for direct emission, indicating that HONO is mostly secondarily formed. Rappenglück et al. (Citation2013, Citation2014) reported that current mobile emission models underestimate the HONO/NOx ratios and found HONO traffic emissions up 1.7% of the total traffic NOx emissions, likely due to heavy-duty diesel (HDD) vehicles, which previous tunnel studies may not have included, as there might have been some restrictions for HDD vehicles in those tunnels.
Homogeneous gas-phase reactions
Several gas-phase reactions have been proposed as HONO formation mechanisms, but kinetic studies indicated them to be not important HONO sources due to their small rate constants and competing daytime photolysis (Stockwell and Calvert, Citation1983; Tyndall et al., Citation1995; Mochida and Finlayson-Pitts, Citation2000; Finlayson-Pitts et al., Citation2003).
Up to now, only few homogeneous gas-phase mechanisms have been accounted for the atmospheric HONO concentrations. The most important homogeneous gas-phase reaction producing HONO is the reaction R3:
Lee et al. (Citation2013) used the PSS to explain the observed HONO, NO, and NO2 concentrations at Houston and showed that the comparison between the modeled and measured concentrations might not be reliable. The PSS approach assumes that HONO concentrations reach an instantaneous photoequilibrium; however, the chemistry and dilution of boundary layer can affect the assumptions necessary to reach PSS. If the transport time for the pollutants from the source to the measurement site is lower than the time required to reach PSS, discrepancies between measured and modeled values can be recognized (Lee et al., Citation2013). The HONO concentration associated with this PSS can be determined by the following equation (E4), assuming d[HONO]/dt ˜ 0:
Very high OH levels have been observed in Chinese environments, with daily maxima ranging between 15 × 106 molecules cm−3 (0.610 ppt) and 26 × 106 molecules cm−3 (1.057 ppt), and nighttime values ranging between 1 × 10⁶ molecules cm−3 (0.041 ppt) and 5 × 10⁶ molecules cm−3 (0.203 ppt) during the summer period. Therefore, in highly polluted Chinese environments, with significant amount of nighttime OH and NO concentrations, the contribution of R3 to the nocturnal HONO formation cannot be negligible (Qin et al., Citation2006; Hofzumahaus et al., Citation2009; Li et al., Citation2012; Lu et al., Citation2012, Citation2013; Zhang et al., Citation2012; Spataro et al., Citation2013).
Bejan et al. (Citation2006) studied the HONO formation by the photolysis of different gaseous nitrophenols using two glass flow-tube reactors with significantly different surface-to-volume (S/V) ratios and volumes. HONO formation (at ppb levels) was observed when mixtures of nitrophenols (at ppm levels) were irradiated by six ultraviolet-visible (UV-Vis) lamps (300–500 nm). This HONO production was linearly correlated with the light intensity, nitrophenol concentration, and photolysis time, indicating that any intermolecular reaction between two nitrophenol molecules occurred (because a quadratic concentration dependency should result). Any dependence of HONO formation from S/V ratio was recognized, supporting that the process proceeded in the gas phase. Assuming that the ortho-nitrophenol concentration of 1 ppb was representative of an urban site, Bejan et al. (Citation2006) estimated the HONO production rate of 100 ppt hr−1. Thus, the photolysis of ortho-nitrophenols can contribute to the daytime HONO budget, but its strength source is not enough to explain the observed HONO concentrations. These results were obtained by extrapolating the laboratory data; thus, further field investigations should be needed to verify the reliability of this estimate.
Li et al. (Citation2008a) suggested the reaction between electronically excited NO2 (λ > 420 nm) and water vapor (H2O) to form HONO and OH (R4–R6):
When NO2 absorbs radiation at wavelengths longer than ˜420 nm (λ > 420 nm), it forms electronically excited NO2 (NO2*) (R4), having fluorescence lifetimes of 40–60 msec. Most of this NO2* will be quenched by collisions with any nonreactive molecule (M) that causes NO2* to relax to a lower energy state (R5). The molecule M can be N2 or O2 or water vapor (H2O) for which the quenching rate constants are known to be 2.7 × 10⁻¹¹, 3.0 × 10⁻¹¹, and ˜1.7 × 10⁻¹⁰ cm3 molecule−1 sec−1, respectively. Since the atmosphere is mainly composed by N2 and O2, most of the NO2* will be quenched by collisions with these species. However, H2O is a relatively abundant trace gas in the troposphere and some of NO2* can collide with it. NO2* can also react directly with H2O producing HONO and OH (R6). Li et al. (Citation2008a) determined a reaction rate for R6 of 1.7 × 10⁻¹³ cm3 molecule−1 sec−1. The HONO production rate, which is the same as OH production rate, can be expressed by the equation E6:
Three- and one-dimensional modeling studies (Li et al., Citation2010, Citation2011; Czander et al., Citation2012, Citation2013; Gonçalves et al., Citation2012; Zhang et al., Citation2012) confirmed that R3 cannot explain the observed daytime HONO levels and that the comparison between measured and simulated HONO concentrations improved when additional HONO sources (direct emission, heterogeneous NO2 conversion, and the reactions R4–R6) were included into the model. The results indicated that the HONO budget was only slightly affected by NO2*, suggesting that it was not an important HONO source.
In conclusion, homogeneous gas-phase processes, such as R3 and the reaction between NO2* and water vapor, act as atmospheric HONO sources, but they cannot explain the observed HONO concentrations. Laboratory investigations focused on the determination of the rate constant k6 should be needed. Finally, the real contribution of photolysis of nitrophenols to the daytime HONO budget should be quantified.
Heterogeneous reactions
It is currently accepted that heterogeneous processes involving conversion of NO2 on humid surfaces (R7) are the predominant formation pathways of nocturnal HONO:
Table 1. Main reaction mechanisms proposed for the heterogeneous NO2 hydrolysis
Jenkin et al. (Citation1988) suggested that the reaction between NO2 and water vapor, both adsorbed on the surface, formed the water complex NO2·H2O. NO2·H2O reacted with gaseous NO2, producing gaseous HONO and adsorbed HNO3. However, this mechanism was not consistent with other experimental results. Finlayson-Pitts et al. (Citation2003) proposed the formation of the dimer of nitrogen dioxide (N2O4) on the reactive surface. N2O4 isomerizes to the asymmetric form, ONONO2, which either can autoionize to generate the complex NO+NO3−, or can react with gaseous NO2 to form symmetric N2O4. The complex NO+NO3−, reacts with H2O, producing HNO3 and HONO. HNO3 on the surface generates NO2+, which reacts with HONO, forming NO. HONO either can be released by the surface or can undergo secondary reactions to produce NO, NO2, and small amounts of nitrous oxide (N2O). Studies performed by Gustafsson et al. (Citation2009) indicated that the HONO formation acid on mineral surfaces through reaction R7 does not involve an N2O4 intermediate. Ramazan et al. (Citation2004) investigated the HONO formation from NO2 hydrolysis in a borosilicate glass cell in the presence and absence of UV radiation (320–400 nm). They proposed a similar mechanism to Finlayson-Pitts et al. (Citation2003), eliminating the NO2 adsorption on the surface (not observed) and including two more reactions: the competitive adsorption between water vapor and HONO on the surface, which caused HONO desorption from the surface, and the reaction between HONO and HNO3, producing NO2. The results reported by Ramazan et al. (Citation2004) highlighted that R7 is not photoenhanced; thus, it proceeds through the same mechanism in light and dark conditions. Both Finalyson-Pitts et al. (Citation2003) and Ramazan et al. (Citation2004) performed their experiments at high gaseous NO2 concentrations (40–100 ppm), but their proposed mechanism could not explain the observations at low NO2 concentrations (Kleffmann et al., Citation1998a; Kleffamann, Citation2007). Kleffmann et al. (Citation1998a) investigated the heterogeneous NO2 conversion on different humid surfaces and measured the observed uptake coefficient (γ), which is defined as the net probability that a molecule undergoing a gas-kinetic collision with a surface is actually taken up at the surface. The γ value is function of the mass accommodation, gas- and liquid-phase diffusion, Henry’s law solubility, and liquid and surface chemistry (Crowley et al., Citation2010). Kleffmann et al. (Citation1998a, Citation1998b) determined γ values for NO2 of about 10−6 and 10−7 for surface with adsorbed pure water and acidic solutions, respectively.
In order to account R7 for the HONO budget, the average nighttime conversion frequency from NO2 into HONO (CHONO) can be estimated by the following
equation (E7), where is the average NO2 concentration in the time interval of (t2 − t1) (Alicke et al., Citation2002, Citation2003; Su et al., Citation2008a; Li et al., Citation2012):
The reaction of NO and NO2 on humid surfaces (R8) was also proposed as HONO source, but laboratory studies showed that its contribution to the atmospheric HONO budget cannot be significant (Kleffmann et al., Citation1998a):
Ammann et al. (Citation1998) proposed the interaction between NO2 and soot particles to explain the observed HONO concentrations in air masses where combustion sources contribute to soot and NOx emissions. The authors reported a γ value of 3.3 × 10⁻⁴ for the first 30 sec of the reaction. Kleffmann et al. (Citation1999) investigated the heterogeneous NO2 conversion on different carbonaceous surfaces (freshly prepared flame soot and commercial soot treated or not treated with sulfuric acid) and showed that the mean initial γ value of 10−6 decreased to <10−8 with NO2 consumption increasing. The interaction between NO2 and the soot surface caused the decrease of the number of active sites on the surface; thus, without any recycling mechanism atmospheric HONO formation on soot surfaces is not of major importance. The discrepancy between the results obtained by Kleffmann et al. (Citation1999) and Ammann et al. (Citation1998) was likely related to the different time scale of the experiments. Kleffmann et al. (Citation1999) reported also that the HONO formation required the presence of water, since the γ values increased with increasing water vapor pressure. Aubin and Abbatt (Citation2007) summarized the literature data for the initial uptake coefficient (γ0) of NO2 on various black carbon substrates, showing that they ranged from 0.1 to 10−8, but most of them were of the order of 10−5. The variance among these measurements can be related to initial NO2 concentration, type of soot, the different time scale of the laboratory experiments, and the different method employed for the determination of the uptake coefficient. Indeed, the uptake coefficient can be calculated by the following
equation (E10), where r is the radius of the flow reactor, kw is the wall-loss rate constant, is the mean molecular speed of NO2, ASSA is the specific surface area of the sample, and Ageo is the geometric surface area:
Many studies accounted only the geometric surface area in the γ0 calculation, and since Ageo can be >3 orders of magnitude lower than ASSA, the term γ0 was overestimated.
Han et al. (Citation2013a) investigated the composition of soot aerosol and its influence on NO2 uptake coefficient and HONO yield, showing that (1) preheated samples exhibited a greater decrease in NO2 uptake coefficient and HONO yield than the fresh soot samples, due to the removal of organic carbon from soot; and (2) ozonized soot showed a lower reactivity toward NO2 than fresh soot, due to the increase of oxidation state of the soot surface. When fresh soot is emitted in the atmosphere, it undergoes aging processes by the uptake of reactive gases, leading to an increase of soot surface oxidation and thus to a lower reactivity of soot towards NO2.
The semivolatile and/or water-soluble organic species in diesel exhaust were also suggested to be significantly involved in secondary HONO formation (R10; Gutzwiller et al., Citation2002a):
Ziemba et al. (Citation2010) used PSS assumption, suggesting heterogeneous HONO production due to the HNO3 depletion on hydrocarbon-like organic aerosol (HOA) surface. However, Lee et al. (Citation2013) showed that the PSS assumption might not be valid and might lead to overestimation of secondary HONO source strength. Additionally, different air mass, vertical mixing, and parameters such as HONO/NOx ratio, deposition velocity, and uptake coefficients could contribute to the uncertainty of PSS calculation. Rutter et al. (Citation2014) showed that HONO formation rate, due to the HNO3 reduction into HONO by volatile organic compounds (VOCs), ranged between 0.1 and 0.5 ppb hr−1, but that it was not affected by the increasing of surface area. These results indicated that the reaction does not occur on aerosol surface and that, likely, HNO3 reacts homogeneously with VOC emitted by the aerosol surface (R11):
The correlation between HONO concentration and aerosol surface, recognized by Ziemba et al. (Citation2010), can be explained by the simultaneous emission of VOCs and aerosol by vehicle exhaust. However, more laboratory investigations are required to assess if the HONO formation observed by Ziemba et al. (Citation2010) was heterogeneous or homogeneous in nature. Laboratory experiments involving aerosol loading comparable to that observed by Ziemba et al. (Citation2010) and evaluating the dependence of the HNO3 conversion from relative humidity and water content of aerosol surface should be needed. Up to now, it is not possible to exclude that the HNO3 into HONO conversion might occur also on the organic aerosol surface.
In conclusion, heterogeneous processes are important atmospheric HONO sources. The ground is mainly involved in the HONO production, but high aerosol loading in the atmosphere can affect significantly the HONO budget. R7 can explain the nighttime HONO concentrations, but more research focused on the identification of this reaction mechanism as well as its dependence on surface water content, on chemical properties (such as chemical composition and pH), and on type of surface is needed. However, R7 cannot explain the observed daytime HONO levels. R10 is also a possible HONO source, but the following items should be evaluated: dependence from the surface water content, the involved organic compounds, and the real contribution of R10 to the HONO budget. Finally, the homogeneous and/or heterogeneous nature of R11 should be clarified.
Photolysis/photoenhanced surface reactions
Since direct emission and homogeneous gas-phase and heterogeneous reactions could not fully explain the observed daytime HONO concentrations, the scientific efforts have been focused on the photochemical/photoenhanced processes. In this framework, several studies have been performed on the photoenhanced NO2 or HNO3 conversion on organic and inorganic surfaces.
Photoenhanced reactions on soot/organic surfaces.
Heterogeneous reactions on organic aerosol surfaces have been widely reported in literature and several carbonaceous surfaces, such as soot, hydrocarbons, diesel soot, and humic acid, have been studied.
George et al. (Citation2005) investigated the effect of light with 300 < λ <500 nm on the uptake kinetic of NO2 of different organic films (such as benzophenone, catechol, anthracene, anthrarobin, and their mixtures) occurring ubiquitously on aerosol and ground surfaces. The NO2 uptake coefficient determined under UV light for the different organic films are reported in and ranged between 10−7 and 10−6, with HONO yields ranging between 50% and 100% under UV irradiation comparable to the irradiance in the wavelength interval of 300–420 nm at the Earth surface under 0° zenith angle.
Table 2. NO2 uptake coefficients (γNO2) of different organic surfaces under UV irradiation
George et al. (Citation2005) concluded that this process may contribute to the daytime HONO budget and noted that the proposed mechanism can occur continuously during daytime. Similarly, Stemmler et al. (Citation2006, Citation2007) proposed the photosensitized NO2 reduction on humic acid, representing the complex unsaturated organic materials ubiquitously present in the environment (R12–R14):
The mechanism proposed for this process involves the photochemical activation of reductive sites (Ared) on the organic surface (R12). The reductive sites may undergo two different fates: their deactivation (R13) or the reaction with gaseous NO2 to form HONO. The X species is an oxidant formed on the organic surface. However, it is not clear the exact chemical nature of the reductive species formed on the humic acid surface. The upper limit of NO2 uptake coefficients (γNO2) for humic acid coating and aerosol were lower at higher NO2 concentrations, and when the relative humidity (RH) was lower than 20% and higher than 60% (Stemmler et al., Citation2007), the γNO2 values for humic acid coatings were 3 times higher than those observed for humic acid aerosol, suggesting that HONO formation on ground surface is higher than those on aerosol surface. The daytime HONO production rate from soils containing humic acid (700 ppt hr−1 within a boundary layer of 100 m height) was estimated to be comparable to the unknown HONO sources (90, 500–600, and 2 ppb hr−1 for polar, rural, and urban environments, respectively) (Stemmler et al., Citation2006). Monge et al. (Citation2010b) showed the persistence of the photoenhanced NO2 into HONO conversion on soot over long periods. Thus, soot transported away from a polluted environment might provide a local photochemical source of NO and HONO. However, the initial γNO2 coefficients of 5 × 10⁻⁷ and 5 × 10⁻⁸ were determined at initial NO2 concentrations of 16 and 120 ppb, respectively. More recently, Han et al. (Citation2013b) showed that simulated sunlight enhanced the aging process of soot toward NO2, resulting in the production of nitro compounds on soot surface. The photolysis of nitro compounds resulted in carbonyl groups and gaseous NO and HONO. Soot samples with higher organic carbon concentration exhibited higher photochemical reactivity. This fraction of organic carbon was composed by polycyclic aromatic hydrocarbons (PAHs) with 3–5 rings and some unidentified components. However, the low γNO2 coefficients indicated that light-induced NO2 conversion on soot aerosol surface cannot be an important HONO source even if the soot surface may remain chemically active for long periods. These laboratory experiments investigated the interaction between NO2 and soot under UV-A radiation, whereas the effect of visible and UV-B as well as the changes of the chemical and physical properties of soot surface have not been evaluated yet.
Ammar et al. (Citation2010) performed laboratory experiments on the heterogeneous NO2 reaction with solid pyrene/KNO3 films (as a proxy of urban grime), determining λNO2 coefficient of 2.67 × 10⁻⁶ under near-UV irradiation (300–420 nm) and estimating the HONO production rate of 130 ppt hr−1.
Recently, Cazoir et al. (Citation2014) studied the heterogeneous loss kinetics of gaseous NO2 on solid fluoranthene films deposited on a Pyrex substrate under UV-A (range 300–420 nm) radiation. The uptake coefficients decreased from 2 × 10⁻⁶ to 7.0 × 10⁻⁷, for initial NO2 concentrations of 20 and 150 ppb, respectively, and they were not affected by temperature and RH. These results suggested the photoenhanced NO2 reactivity towards fluoranthene and possibly other PAHs. It would be interesting to extend this study to other PAH compounds to evaluate the real influence of this process on HONO formation and its atmospheric implications.
In conclusion, the photoenhanced NO2 conversion on organic surfaces or humic acids can fully explain the observed daytime HONO concentrations. However, more research, focused on the organic chemicals participating to the HONO formation and the reaction mechanisms, should be performed. The effect of both UV-A and UV-B radiations on HONO production should be also assessed. Finally, field experiments evaluating the real contribution of these processes to the HONO budget are needed.
Photolysis reactions on inorganic surfaces.
During the last 30 years, several studies have been focused on the photolysis reactions on inorganic surfaces resulting in HONO production. The photolysis of adsorbed HNO3 or nitrate (NO3−) (λ ˜300 nm) was identified as a daytime HONO and NOx source in rural environments, and the following mechanism has been identified (reactions R15–R17):
Zhou et al. (Citation2011) performed direct measurements of HONO fluxes over a rural forest canopy in Michigan, showing that the daytime HONO flux was positively correlated with the product of leaf surface nitrate loading and the rate constant of nitrate photolysis. They suggested that the photolysis of HNO3 on forest canopies is a significant daytime HONO source to the troposphere in rural environments and an important pathway for the remobilization of deposited HNO3. The authors explained that the remobilization of deposited HNO3 causes the overlying troposphere to be more photochemically reactive than generally predicted, and the long-range transport of reactive nitrogen to impact potentially on greater distances than previously thought.
In contrast to heterogeneous HONO formation that mainly accelerates morning ozone formation, inclusion of HONO photochemical sources influences ozone throughout the day, affecting its peak concentration (Sarwar et al., Citation2008; Czader et al., Citation2012; Rappenglück et al., Citation2014). Li et al. (Citation2012) showed that the photolysis of HNO3 adsorbed on ground surface was related to HONO formation in the Pearl River Delta region, during the Program of Regional Integrated Experiments of Air Quality over Pearl River Delta 2006 (PRIDE-PRD2006) campaign. The importance of this mechanism is associated with its potential role of pathway for the remobilization of deposited HNO3. A similar mechanism has been recognized at high polar latitudes during springtime (Zhou et al., Citation2001; Dibb et al., Citation2002; Honrath et al., Citation2002). This process starts with the deposition and migration of NO3− ion to the snow pack surface, followed by the photoreduction of NO3− to form NO, NO2 and nitrite (NO2−) ion, and the NO2− acidification producing HONO. Several studies showed that NOx and HONO released from the snow surface at high and mid latitudes can alter significantly the chemistry in the remote boundary layer, because the radical pool is altered (Ianniello et al., Citation2002; Beine et al., Citation2003; Rappenglück et al., Citation2014). However, more field experiments, including the analysis in situ of surface sample (chemical and physical properties) and vertical fluxes of HONO, NO, and NO2, should be performed in order to better understand the impact of the reactions R15–R17 on the atmospheric HONO budget.
Research studies highlighted the simultaneous increase of NO3− in PM10 and PM2.5 (particulate matter with aerodynamic diameters of <2.5 and <10 μm, respectively) and gaseous HONO concentrations during Saharan dust events (Wang et al., Citation2003; Saliba and Chamseddine, Citation2012), suggesting that mineral dust affects the conversion of nitrogen species into HONO in the troposphere. Laboratory studies suggest that HONO can be formed by the UV-irradiated interaction of reactive nitrogen compounds (NO2, NO, HNO3) with mineral-containing substrates such as titanium dioxide (TiO2), silicon oxide (SiO2), aluminium oxide (Al2O3), calcium carbonate (CaCO3), and real Saharan and Asian dust (Saliba et al., Citation2001; Usher et al., Citation2003, Cwiertny et al., Citation2008, Ndour et al., Citation2008, Ma et al., Citation2013). However, these studies were not conclusive regarding the understanding of reaction mechanisms and their dependence on several parameters: surface chemical properties (acidity, water content, and composition), relative humidity, concentration and type of nitrogen species, and wavelength and intensity of radiation. Ramazan et al. (Citation2004) investigated the effect of UV radiation on the heterogeneous NO2 hydrolysis on borosilicate glass surface, and their results showed that R7 is not photoenhanced. Their experiments indicated also that HNO3, resulting from R7, can exist either as nitric acid–water complexes (HNO3·H2O) or as NO3− ion. HNO3·H2O can undergo photolysis (λ < 741 nm), producing adsorbed HONO and hydrogen peroxide (H2O2). The release of this HONO depends on the water vapor concentration, which triggers a competitive adsorption process (Ramazan et al., Citation2006; Ma et al., Citation2013):
Many research studies have been focused on the NO2 removal by titanium oxide (TiO2) surfaces. Although TiO2 is found in dust particles at mass concentration ranging from 0.1% to 10%, this species has attracted great interest due its well-known photocatalytic properties. The irradiation of TiO2 molecules by UV lights cause the photoproduction of excess electrons in the conduction band (e−cb) and holes in the valence band (h+vb) (reaction R20). The hole oxidizes water vapor (R21), whereas the electron reduces the oxygen (R22):
Biological processes
Su et al. (Citation2011) proposed that the unknown HONO source was related to soil biological processes. They reported that the dominant source of N(III) in soil are biological nitrification and denitrification processes. The nitrification process converts ammonium ion (NH4+) to NO2−, which in turn is converted to NO3− resulting in the accumulation of both NO2− and NO3− in the soil. During the denitrification, NO3− is reduced to gaseous NO, which can be released from the soil surface (Su et al., Citation2011; Pilegaard, Citation2013; Oswald et al., Citation2013). Since NO2− is highly water soluble, it can be protonated by H+ (reaction R25) resulting in adsorbed HONO. Then, HONO can undergo the competitive adsorption with water vapor (R26), resulting in the release of gaseous HONO from the soil.
Oswald et al. (Citation2013) studied the relation between soil HONO emissions and biogenic soil NO emissions, using the dynamic chamber method and investigating soil samples, with a wide range of soil pH, organic matter, and nutrient contents. The results showed that maximum HONO (about 13 ng m−2 sec−1) and NO (about 18 ng m−2 sec−1) fluxes from soil samples were comparable and were affected by water content, pH, and temperature. However, unexpectedly high HONO and NO emissions were observed for neutral and alkaline soils, which was characterized by higher NH4+ and NO2− concentrations. These results were in disagreement with the acid-base equilibria proposed by Su et al. (Citation2011), where acid pH favors release of gaseous HONO. The authors suggested that beside the acid-base equilibria, ammonia-oxidizing bacteria (AOB) can dominate the formation of HONO and NO within the soil. Therefore, HONO is formed and emitted during nitrification, which is favored at lower water holding capacity (WHC). Maximum HONO and NO fluxes were measured within 0–40% of WHC.
HONO emission from soil can be considered as another potential source of this species in the troposphere, which is consistent with the observations that ground surfaces are dominant for HONO production. Further studies are recommended to assess the real impact of HONO release from soil nitrite on in the biogeochemical cycling of N in both agricultural and natural environments.
HONO Measurement Techniques
Accurate HONO measurements are difficult to perform. Certified reference gases for HONO do not exist, because it is unstable. HONO reactivity and solubility can cause sampling losses and artifacts. Consequently, intercomparisons between different techniques may exhibit significant discrepancies. During the international FIONA (Formal Intercomparisons of Observations of Nitrous Acid) campaign, a set of experiments was performed in the EUPHORE (European PHOtoREactor) chambers, simulating urban and semirural scenarios and intercomparing almost all types of instruments used to detect gaseous HONO. Good agreement among the techniques was found, but deviations for some measurements were also revealed. These differences were related to the difficult adaptation of the instruments to the EUPHORE chambers and to calibrations issues (Ródenas et al., Citation2013). However, the FIONA results are only preliminary and analyses are still ongoing.
Pinto et al. (Citation2014) compared the HONO measurements made by different instruments during the SHARP (Study of Houston Atmospheric Radical Precursors) camping. The HONO temporal patterns obtained by these techniques were in good agreement. The largest differences among the measurements were related to (1) high pollution conditions causing positive and/or negative interference in in situ techniques; (2) the sampling site, where heterogeneous reactions can affect the HONO measurement; (3) the position of the instrumental inlet; and (4) other experiments performed at the sampling site causing differences among instruments.
In the following sections, an overview of HONO measurement techniques currently available in the literature is reported. They are divided in three basic categories: spectroscopic techniques, wet chemical techniques, and off-line methods.
Optical spectroscopic methods
The optical spectroscopic techniques measure atmospheric trace gases without the need for chemical extraction, with calibrations that are based on known absorption cross-sections (line strengths) and specificity that can be confirmed by spectral identification. However, absorption spectroscopic analytical methods tend to be expensive and to have bulky system components, and for many trace gases the fundamental sensitivity is relatively low, requiring either long absorption paths or increased signal averaging time (Kleffmann, Citation2007).
Differential optical absorption spectroscopy (DOAS).
The DOAS technique, schematically showed in , has been widely used to detect atmospheric HONO in urban, rural, and semirural environments (Perner and Platt, Citation1979; Pitts et al., Citation1984; Andrés-Hernández et al., Citation1996; Reisinger, Citation2000; Stutz et al., Citation2002, Citation2004, Citation2010; Acker et al., Citation2006).
Figure 2. Schematic sketch of the major components related to the differential optical absorption spectroscopy (DOAS) system.
The DOAS system () includes a light source, emitting light radiation, which travels across the atmosphere for distances ranging from few hundred meters to several kilometers (Alicke et al., Citation2002; Kleffmann et al., Citation2006; Stutz et al., Citation2010; Zhou et al., Citation2013). At the end of this path, the radiation is then collected and detected (Platt and Stutz, Citation2008). The active DOAS is equipped with a broadband source, such as a Xenon arc lamp (e.g., long-path DOAS), whereas the passive DOAS uses sunlight or scattered sunlight as source (e.g., multiaxis DOAS). Since the radiation moves through the atmosphere, its intensity is reduced by absorption of a specific trace gas. Simultaneously, the light intensity can be also absorbed by other trace gases (extinction), or can be scattered by gaseous and particulate, and these processes cause interferences. The broad bands are related to instrument effects and turbulences, whereas the high-frequency narrow band cross-section is related to characteristic absorption lines or bands of trace gases. HONO is detected by its narrow-band UV absorption between 340 and 370 nm and is quantified by Beer-Lambert law. Detection limits (LOD) of 100 and 200 ppt related to path length of 750 and 6 m, respectively, have been reported (Kleffmann et al., Citation2006; Qin et al., Citation2006). Stutz et al. (Citation2010) achieved the LOD of 16 ppt related to path length of 4–5 km. DOAS is an accurate and sensitive technique, allowing the simultaneous detection of different species (Platt and Stutz, Citation2008; Stutz et al., Citation2010). Since HONO measurements by DOAS are artifact-free with respect to the sampling procedures, DOAS is often used as reference during HONO intercomparison. However, the simultaneous measurement of different species at high concentration, especially NO2, can cause large uncertainty for HONO quantification by DOAS (Kleffmann et al., Citation2006).
Cavity ring-down spectroscopy (CRDS).
The CRDS is a direct spectroscopic technique (detects directly the HONO molecule), which measures the rate of decay of the radiation due to the strong absorption of HONO at the wavelength of 354.2 nm. Two highly reflective mirrors (R > 99.9%) are used to trap tunable laser pulses inside an optical cavity, and the trapped light makes about 1000 rounds in the cavity. The decay rate (1/τ) can be determined by the following equation (E14), where (1/τ0) is the background decay rate due to the mirror loss and the scattering, α is the absorption coefficient, n and σ are the number density and absorption cross-section of the absorbing sample, respectively:
Tunable infrared laser absorption spectroscopy (TIRLS).
TIRLS is based on absorption spectroscopy to measure directly atmospheric HONO without chemical extraction. Ambient air is sampled into a low-pressure multipass cell, where it interacts with light from an infrared (IR) laser. The calibrations are based on known absorption cross-sections (line strengths) and on spectral identification (Lee et al., Citation2011). Li et al. (Citation2008b) used tunable diode laser absorption spectroscopy (TDLS) with a light absorption path of ˜150 m to detect HONO by its strong absorption feature at 1713.511 cm−1. The detection limit was of ˜200 ppt, with a time resolution of 1 sec. Lee et al. (Citation2011, Citation2013) developed a tunable IR laser differential absorption spectrometer equipped with continuous-wave quantum-cascade lasers. This instrument was able to measure both HONO and NO2 concentrations. The continuous-wave quantum-cascade lasers allowed much more mode stability, higher laser power output, and the ability to operate both lasers and detectors near room temperature for long-term field measurements. Detection limits of 40 and 10 ppt for HONO and NO2, respectively, were reported with 1-hr spectral averaging.
Photofragmentation (PF)/laser-induced fluorescence (LIF).
The determination of HONO by PF/LIF technique consists in its UV photofragmentation (λ = 355 nm) producing NO and OH, followed by the quantifications of OH by laser-induced fluorescence at an excitation wavelength of 282 nm and an emission wavelength of 309 nm. The detection limit is of 2–15 ppt, with a time resolution of 1 min. The excitation wavelength of 282 nm allows minimizing the interferences due to O3. In particular, at high O3 concentrations and high relative humidity, this interference needs to be quantified and corrected (Kleffmann, Citation2007). The detection limit is of 2–15 ppt, with a time resolution of 1 min. Liao et al. (Citation2006) used PF/LIF to measure HONO at the South Pole (Liao et al., Citation2006), but this technique has not been used in more than 10 years.
Wet chemical methods
The wet chemical techniques operate by collecting gaseous HONO by several devices (wet effluent denuder, rotated denuder, bubbler), in which inner walls are wetted with suitable solutions. These sampling solutions are then analyzed by analytical techniques such as ion chromatography (IC), high-performance liquid chromatography (HPLC), spectrophotometry, etc. The wet techniques are simpler and less expensive compared with the spectroscopic techniques, providing higher sensitivities with detection limit in the order of few ppt. Although the wet chemical methods can be very sensitive, the need to scrub HONO into solution may introduce chemical interferences caused by, e.g., NO2 and phenol reaction (Gutzwiller et al., Citation2002a, Citation2002b), NO2 and SO2 (Spindler et al., Citation2003), NO2 and aromatic amines (Saltzman, Citation1954), or PAN hydrolysis (Frenzel et al., Citation2000). Thus, attention has to be paid to minimize the chemical interferences when wet chemical techniques are used to measure HONO concentrations.
Wet denuder.
A widely used wet denuder for HONO measurement is the wet effluent diffusion denuder (WEDD). It is set up vertically, in which the purified water (absorbing solution) is continuously pumped into the tube at the top forming a thin aqueous film on the inner wall surface. The adsorbing solution collects gaseous HONO, which is highly soluble in water, converting it into nitrite and analyzing by IC. The detection limit is of few ppt, with a time resolution of 5–30 min depending on the run time of IC (Simon and Dasgupta, Citation1993; Zellweger et al., Citation1999; Acker et al., Citation2004, Citation2006).
HONO can be also measured by rotating wet annular denuder (RWAN), set up horizontally. In this case, the absorbing solution is an alkaline solution, which coats the inner walls of the denuder. HONO is collected as nitrite, and the absorbing solution is then analyzed by IC. The detection limit is of 12 ppt, with a time resolution of 5–60 min depending on the run time of IC (Trebs et al., Citation2004).
Mist chamber–IC.
The mist chamber was used for sampling of HONO and other water-soluble species. This technique operates by nebulizing deionized water (scrubbing solution) into fine mist by the high flow of ambient air drawn into the chamber. The water droplets collect gaseous HONO, forming nitrite, which is analyzed by IC. The detection limit is of few ppt, with a time resolution depending on the chromatographic run (5–30 min). Aerosol particles are removed by a filter at the inlet of the chamber, to avoid interferences. The inlet is also maintained in insulated and dark conditions to avoid possible HONO formation due to heterogeneous and photolytic processes (Kleffmann and Wiesen, Citation2008).
HPLC/UV system.
HONO can be also determined by reverse-phase HPLC analysis with UV absorption detection at 309 nm (Zhou et al., Citation1999). A schematic sketch of HPLC/UV system is shown in .
Figure 3. Schematic sketch of the semiautomatic HONO instrument based on reverse-phase HPLC analysis, followed by UV absorption detection.
Gaseous HONO is trapped quantitatively in a coil sampler using buffer solution. The scrubbing solution is derivatized with sulfanilamine (SA)/N-(1-naphtyl)ethylendiamine dihydrochloride (NED), analyzed by HPLC, and detected by UV-Vis absorption. The LOD is <0.8 ppt, with a time resolution of about 10 min. This method suffers from chemical interferences caused by, e.g., NO2 and phenol reaction or by NO2 and SO2, which cannot be quantified. To correct the data, interference from gaseous and particulate species could be removed operating with a two-channel system. The first channel collects ambient air directly, whereas the second channel is equipped with a sodium carbonated (Na2CO3)-coated denuder to remove interfering compounds. However, during the last 10 years, HONO measurements have been performed by a technique based on long-path absorption photometer.
Long-path absorption photometric technique.
As HPLC/UV method, this method operates by collecting HONO by aqueous coil scrubbing, followed by acid derivatization (SA/NED mixture) of NO2−, forming the highly light-absorbing azo dye, which is the detected by long-path absorption photometer (Heland et al., Citation2001; Kleffmann et al., Citation2002; He et al., Citation2006; Kleffmann and Wiesen, Citation2008, Ren et al., Citation2011). Up to now, many variants of this method have been reported. Ren et al. (Citation2011) used long-path absorption photometric technique with a single channel to measure HONO concentrations at different heights in California. Zhou et al. (Citation2002) performed simultaneous HONO and HNO3 measurements by a two-channel long-path absorption photometric system. In particular, HONO was measured in the first channel as described above, whereas HNO3 was measured by the same technique after first converting it to NO2− by a hydrazine reduction method. Helland et al. (Citation2001) and Kleffmann et al. (Citation2002) used long-path absorption photometric technique operating with two coil samplers in series (): the first coil collects HONO and interfering species (such as NOx and PAN), whereas the second coil collects the same amount of interfering species but no HONO.
Figure 4. Schematic sketch of the long-path absorption photometric (LOPAP) technique.
Thus, the correct HONO concentration can be determined by the difference between the signals of the first coil and the second coil. The detection limit is 1 ppt, with a time resolution of 1.5–4 min. Acidic sampling conditions allows minimizing some interferences (NO2 and SO2, NO2 and phenols, NO2 and aromatic amines, or peroxyacetyl nitrate [PAN] hydrolysis) (Heland et al., Citation2001; Kleffmann et al., Citation2002). Sampling artifacts (heterogeneous formation on surfaces by different NO2 reactions, by photolysis, or by condensation of analytes on inlet) can be avoided by placing the stripping reagent directly in the atmosphere (Kleffmann and Wiesen, Citation2008).
Off-line methods
Besides the on-line techniques indicated above, HONO concentrations can be determined by off-line methods. They are based on the HONO sampling by devices such as dry diffusion denuders (Febo et al., Citation1993, Citation1996), filter pack (Sickles and Hodson, Citation1989), and passive samplers (Bytnerowicz et al., Citation2005), followed by analysis of extracted nitrite. Today, dry diffusion denuders and passive samplers are still used for HONO measurement.
The HONO sampling by dry diffusion denuder is performed by two Na2CO3-coated denuders (1% Na2CO3 + 1% glycerol in 1:1 ethanol/water solution). Gaseous HONO diffuses and is absorbed on the Na2CO3-coated surface, forming nitrite, which is analyzed by IC.
The HONO determination by carbonate-coated denuders can be affected by both positive interferences from nitrite forming species, such as NO2 and PAN, and by negative interferences from ozone (O3) and other oxidants. Corrections for positive interferences can be accounted for by operating two denuders in series (absolute differential technique), assuming that NO2 and PAN are collected with the same efficiencies on the second Na2CO3-coated denuder (Febo et al., Citation1993, Citation1996; Ianniello et al., Citation2007). Gaseous HNO3 should be selectively removed from the sampling air by means of sodium fluoride (NaF)- or sodium chloride (NaCl)-coated denuders in order to avoid the interfering nitrate amount in the HONO measurements (negative interference). Nitrate ions generated on Na2CO3-coated denuders by the oxidation of nitrite (from HONO) is indistinguishable from nitrate ions generated by the HNO3 collection unless this species is removed from the incoming air stream. Thus, the atmospheric HONO concentrations are determined by subtracting the sum of nitrite and nitrate (expressed as nitrite) concentrations in the second Na2CO3-coated denuder from the sum of nitrite and nitrate (expressed as nitrite) concentrations in the first Na2CO3-coated denuder (Febo et al., Citation1993, Citation1996; Ianniello et al., Citation2007, Spataro et al., Citation2013). The diffusion denuder technique is accurate and selective but also labor-intensive, and requires long sampling time. The collection efficiency for HONO is about 99%, whereas the detection limit is 0.88 ppt, with a time resolution of 24 hr.
Finally, Bytnerowicz et al. (Citation2005) developed a passive sampler for the simultaneous collection of gaseous HNO3 and HONO. This device is based on a diffusion of ambient air through Tefion membrane and absorption of the pollutants on Nylasorb nylonfilter. After the sampling, the passive sampler is analyzed by IC, and HNO3 and HONO are determined as nitrate and nitrite, respectively. Passive sampler is simple, easy to make, inexpensive, resistant to harsh weather conditions and does not require power supply. It can measure wide ranges of ambient HONO and HNO3 concentrations for extended periods of time and can be used for regional-scale monitoring of the pollutants. The detection limit of 0.2 ppb over the 6-day sampling period is not suitable to evaluate the diurnal variation of HONO concentrations (Lee et al., Citation2002).
Conclusions and Future Outlook
This paper reports and discusses the HONO sources proposed to explain the HONO budget, especially during daytime. Five HONO formation pathways can be recognized: direct emission, homogeneous gas-phase reactions, heterogeneous reactions, photolysis/photoenhanced reactions, and biological processes.
Direct HONO emission (from vehicles) ranges between 0.3% and 1.7% of the total traffic NOx emission. Vehicular traffic can be important HONO source only in heavily polluted urban environment. Since the atmospheric [HONO]/[NOx] ratios are usually higher than those related to the direct emission, HONO is mostly secondarily produced. However, more evaluations of HONO, NO, and NO2 emission are required to quantify the emitted amount by different vehicles (in particular light- and heavy-duty diesel vehicles, etc.).
The homogeneous gas-phase R3 and R6 reactions may act as atmospheric HONO sources, but they cannot explain the observed daytime HONO levels. Bejan et al. (Citation2006) proposed the photolysis of different gaseous nitrophenols, estimating the HONO production rate of 100 ppt hr−1 for a typical urban site. However, there are not yet field studies investigating this process in the real atmosphere and verifying its estimated HONO production rate.
Heterogeneous reactions, involving the NO2 conversion on humid surfaces (R7), have been accepted to be the dominant nighttime HONO source. However, the detailed mechanism of R7 and its dependence on surface water content, chemical properties (such as chemical composition and pH), and type of surface is still not understood. The ground surface mainly affects the HONO production, but high aerosol loading in the atmosphere may increase the heterogeneous HONO production. Thus, more data, related to the role of aerosol and ground surface into the heterogeneous HONO production, are needed to clarify this question. The reactions R8 and R9 and the NO2 conversion on soot surfaces cannot be important HONO sources. The interaction between NO2 and diesel exhaust can also cause HONO formation. Ziemba et al. (Citation2010) proposed that VOCs affect the HNO3 conversion into HONO. Since VOCs are emitted in both gas and particulate phases by vehicular exhausts, it is not clear the homogeneous and/or heterogeneous nature of this process as well as the dependence of the HONO production rate to the surface water content and to the chemical composition of substrate.
Photolysis/photoenhanced surface processes were considered to explain the observed daytime HONO concentrations. Three processes were identified. The first one, the photolysis of adsorbed HNO3/NO3− (λ ˜ 300 nm) results in the daytime HONO and NOx production and is a possible pathway remobilizing deposited HNO3 in rural and polar environments. However, there are still few studies quantifying its contribution to the atmospheric HONO budget. The second one is the photoenhanced NO2 into HONO conversion on mineral dust substrates. The mineral powder (TiO2, SiO2, and CaCO3) are likely involved in the HONO production, but more studies are required to clarify the mechanisms and their dependence on several parameters: surface chemical properties (acidity, water content, and composition), relative humidity, and concentration and type of nitrogen species. The last one, the photoenhanced NO2 conversion on the organic and humic acid surfaces, was related to the HONO production rate of 700 ppt hr−1 within a boundary layer of 100 m height. However, the organic chemicals participating in the HONO formation and the reaction mechanism of NO2 with organic materials should be investigated. Laboratory researches on the photoenhanced HONO production considered only UV-A radiation, whereas the effect of visible and UV-B as well as the changes of the chemical and physical properties of surfaces were not evaluated.
Recently, biological nitrification and denitrification processes in the soil were proposed as the unknown HONO sources. This mechanism is consistent with the observations that ground surfaces are dominant for HONO production, but further studies are recommended to assess the actual impact of HONO release from soil nitrite on in the biogeochemical cycling of N in both agricultural and natural environments.
The knowledge of atmospheric HONO sources is crucial to obtain a more rigorous representation of its sources and their relative contribution to the HONO budget. Field measurements of HONO, NO, and NO2 concentrations and fluxes in the lower troposphere are needed. These studies are crucial to fully characterize air quality and to integrate the current models.
Accurate and fast HONO measurement is the first step to investigate its sources. During the last 30 years, several techniques have been developed to determine HONO levels, and each of them is characterized by specific disadvantages and advantages. Wet methods suffer from sampling artifacts and some, such as NO2 and SO2, NO2 and phenols, NO2 and aromatic amines, or peroxyacetyl nitrate (PAN) hydrolysis. However, some versions of the long-path absorption photometric method claim to have minimized and quantified the known interferences.
Summary
HONO plays a key role in the tropospheric photochemistry, acting as a relevant source of OH radicals by its rapid photolysis (R1). OH radicals are involved in photooxidation processes, such as the formation of tropospheric O3 and other secondary atmospheric pollutants (PAN and secondary particles). Recent field and modeling studies showed that HONO photolysis contributes significantly to the OH production throughout the day and that a strong and unknown daytime HONO source should exist. Up to now, there are five HONO formation pathways known: direct emission, homogeneous gas-phase reactions, heterogeneous reactions, surface photolysis, and biological processes. In this review paper, the HONO sources proposed to explain the HONO budget, especially during daytime, have been discussed. Since there are many techniques to detect HONO that do not fully satisfy the need for sensitivity, selectivity, and fast time response, a short description of HONO measurement techniques currently available in literature is reported. They are divided in three basic categories: spectroscopic techniques, wet chemical techniques, and off-line methods.
Acknowledgment
The authors would like to thank all participants of the field measurements focused on HONO sampling in the troposphere, and in particular the authors are grateful to Mr. Giulio Esposito for helpful discussions.
Funding
This work was financially supported by Institute for the Atmospheric Pollution Research (CNR-IIA).
Additional information
Notes on contributors
Francesca Spataro
Francesca Spataro and Antonietta Ianniello are both researchers at the CNR-Institute of Atmospheric Pollution Research (CNR-IIA), Rome, Italy.
Antonietta Ianniello
Francesca Spataro and Antonietta Ianniello are both researchers at the CNR-Institute of Atmospheric Pollution Research (CNR-IIA), Rome, Italy.
References
- Acker, K., D. Möller, W. Wieprecht, F.X. Meixner, B. Bohn, S. Gilge, C. Plass-Dülmer, and H. Berresheim. 2006. Strong daytime production of OH from HNO2 at a rural mountain site. Geophys. Res. Lett. 33:L02809. doi:10.1029/2005GL024643
- Acker, K., G. Spindler, and E. Brüggemann. 2004. Nitrous and nitric acid measurements during the INTERCOMP2000 campaign in Melpitz. Atmos. Environ. 38:6497–6505. doi:10.1016/j.atmosenv.2004.08.030
- Alicke, B., A. Geyer, A. Hofzumahaus, F. Holland, S. Konrad, H.W. Pätz, J. Schäfer, J. Stutz, A. Volz-Thomas, and U. Platt. 2003. OH formation by HONO photolysis during the BERLIOZ experiment. J. Geophys. Res. 108:PHO 3-1–PHO 3-17.
- Alicke, B., U. Platt, and J. Stutz. 2002. Impact of nitrous acid photolysis on the total hydroxyl radical budget during the Limitation of Oxidant Production/Pianura Padana Produzione di Ozono study in Milan. J. Geophys. Res. Atmos. 107:LOP 9-1–LOP 9-17.
- Alvarez, E.G., D. Amedro, C. Afif, S. Gligorovski, C. Schoemaecker, C. Fittschen, J.-F. Doussind, and H. Wortham. 2013. Unexpectedly high indoor hydroxyl radical concentrations associated with nitrous acid. Proc. Natl. Acad. Sci. U. S. A. 110:13294–13299. doi:10.1073/pnas.1308310110
- Ammann, M., M. Kalberer, D.T. Jost, L. Tobler, E. Rössler, D. Piguet, H.W. Gäggeler, and U. Baltensperger. 1998. Heterogeneous production of nitrous acid on soot in polluted airmasses. Nature 395:157–160. doi:10.1038/25965
- Ammann, M., E. Rössler, R. Strekowskiw, and C. George. 2005. Nitrogen dioxide multiphase chemistry: Uptake kinetics on aqueous solutions containing phenolic compounds. Phys. Chem. Chem. Phys. 7:2513–2518. doi:10.1039/b501808k
- Ammar, R., M.F. Monge, C. George, and B. D’Anna. 2010. Photoenhanced NO2 loss on simulated urban grime. Chemphyschem 11:3956–3961. doi:10.1002/cphc.201000540
- Andrés-Hernandez, M.D., J. Notholt, J. Hjorth, and O. Schermes. 1996. A DOAS study on the origin of nitrous acid at urban and non-urban site. Atmos. Environ. 30:175–180.
- Atkinson, R., D.L. Baulch, R.A. Cox, J.N. Crowley, R.F. Hampson, R.G. Hynes, M.E. Jenkin, M.J. Rossi, and J. Troe. 2004. Evaluated kinetic and photochemical data for atmospheric chemistry: Volume I. Gas phase reactions of Ox, HOx, NOx and SOx species. Atmos. Chem. Phys. 4:1461–1738. doi:10.5194/acp-4-1461-2004
- Aubin, D.G., and J.P.D. Abbatt. 2007. Interaction of NO2 with hydrocarbon soot: Focus on HONO yield, surface modification, and mechanism. J. Phys. Chem. A 111:6263–6273. doi:10.1021/jp068884h
- Beine, H.J., I. Allegrini, R. Sparapani, A. Ianniello, and F. Valentini. 2001. Three years of springtime trace gas and particle measurements at Ny-Ålesund, Svalbard. Atmos. Environ. 35:3645–3658. doi:10.1016/S1352-2310(00)00529-X
- Beine, H.J., F. Dominè, A. Ianniello, M. Nardino, I. Allegrini, K. Teinilä, and R. Hillamo. 2003. Fluxes of nitrates between snow surfaces and the atmosphere in the European high arctic. Atmos. Chem. Phys. 3:335–346. doi:10.5194/acp-3-335-2003
- Bejan, I., Y. Abd El Aal, I. Barnes, T. Benter, B. Bohn, P. Wiesen, and J. Kleffmann. 2006. The photolysis of ortho-nitrophenols: A new gas phase source of HONO. Phys. Chem. Chem. Phys. 8: 2028–2035. doi:10.1039/b516590c
- Bytnerowicz, A., M.J. Sanz, M.J. Arbaugh, P.E. Padgett, D.P. Jones, and A. Davila. 2005. Passive sampler for monitoring ambient nitric acid (HNO3) and nitrous acid (HNO2) concentrations. Atmos. Environ. 39:2655–2660. doi:10.1016/j.atmosenv.2005.01.018
- Cazoir, D., M. Brigante, R. Ammar, B. D’Anna, and C. George. 2014. Heterogeneous photochemistry of gaseous NO2 on solid fluoranthene films: A source of gaseous nitrous acid (HONO) in the urban environment. J. Photochem. Photobiol. A Chem. 273:23–28. doi:10.1016/j.jphotochem.2013.07.016
- Crowley. J.N., M. Ammann, R.A. Cox, R.G. Hynes, M.E. Jenkin, A. Mellouki, M.J. Rossi, J. Troe, and T.J. Wallington. 2010. Evaluated kinetic and photochemical data for atmospheric chemistry: Volume V—Heterogeneous reactions on solid substrates. Atmos. Chem. Phys. 10:9059–9223. doi:10.5194/acp-10-9059-2010
- Cwiertny, D.M., M.A. Young, and V.H. Grassian 2008. Chemistry and photochemistry of mineral dust aerosol. Ann. Rev. Phys. Chem. 59:27–51. doi:10.1146/annurev.physchem.59.032607.093630
- Czader, B.H., X. Li, and B. Rappenglück. 2013. CMAQ modeling and analysis of radicals, radical precursors, and chemical transformations. J. Geophys. Res. Atmos. 118:11,376–11,387. doi:10.1002/jgrd.50807
- Czader, B.H., B. Rappenglück, P. Percell, D.W. Byun, F. Ngan, and S. Kim. 2012. Modeling nitrous acid and its impact on ozone and hydroxyl radical during the Texas Air Quality Study 2006. Atmos. Chem. Phys. 12:6939–6951. doi:10.5194/acp-12-6939-2012
- Dibb, J.E., M. Arsenault, M.C. Peterson, and R.E. Honrath. 2002. Fast nitrogen oxide photochemistry in Summit, Greenland snow. Atmos. Environ. 36:2501–2511. doi:10.1016/S1352-2310(02)00130-9
- Dillon, M.B., M.S. Lamanna, G.W. Schade, A. Goldstein, and R.C. Cohen. 2002. Chemical evolution of the Sacramento urban plume: Transport and oxidation. J. Geophys. Res. 107:40–45. doi:10.1029/2001JD000969
- Elshorbany, Y.F., J. Kleffmann, R. Kurtenbach, E. Lissi, M. Rubio, G. Villena, E. Gramsch, A. R. Rickard, M.J. Pilling, and P. Wiesen. 2010. Seasonal dependence of the oxidation capacity of the city of Santiago de Chile. Atmos. Environ. 44:5383–5394. doi:10.1016/j.atmosenv.2009.08.036
- Elshorbany, Y.F., R. Kurtenbach, P. Wiesen, E. Lissi, M. Rubio, G. Villena, E. Gramsch, A.R. Rickard, M.J. Pilling, and J. Kleffmann. 2009. Oxidation capacity of the city air of Santiago, Chile. Atmos. Chem. Phys. 9: 2257–2273. doi:10.5194/acp-9-2257-2009
- Ensberg, J.J., M. Carreras-Sospedra, and D. Dabdub. 2010. Impacts of electronically photo-excited NO2 on air pollution in the South Coast Air Basin of California. Atmos. Chem. Phys. 10:1171–1181. doi:10.5194/acp-10-1171-2010
- Febo, A., C. Perrino, and I. Allegrini. 1996. Measurement of nitrous acid in Milan, Italy, by DOAS and diffusion denuders. Atmos. Environ. 30: 3599–609. doi:10.1016/1352-2310(96)00069-6
- Febo, A., C. Perrino, and M. Cortiello. 1993. A Denuder technique for the measurement of nitrous acid in urban atmospheres. Atmos. Environ. A Gen. Top. 27:1721–1728. doi:10.1016/0960-1686(93)90235-Q
- Frenzel, A., S. Kutsuna, K. Takeuchi, and T. Ibusuki. 2000. Solubility and reactivity of peroxyacetyl nitrate (PAN) in dilute aqueous solutions and in sulphuric acid. Atmos. Environ. 34:3641–3644. doi:10.1016/S1352-2310(00)00132-1
- Finlayson-Pitts, B.J., L.M. Wingen, A.L. Sumner, D. Syomin, and K.A. Ramazan. 2003. The heterogeneous hydrolysis of NO2 in laboratory systems and in outdoor and indoor atmospheres: An integrated mechanism. Phys. Chem. Chem. Phys. 5:223–242. doi:10.1039/b208564j
- George, C., R.S. Strekowski, J. Kleffmann, K. Stemmler, and M. Ammann. 2005. Photoenhanced uptake of gaseous NO2 on solid organic compounds: A photochemical source of HONO? Faraday Discuss. 130:195–210. doi:10.1039/b417888m
- Gonçalves, M., D. Dabdub, W.L. Chang, O. Jorba, and J.M. Baldasano. 2012. Impact of HONO sources on the performance of mesoscale air quality models. Atmos. Environ. 54:168–176. doi:10.1016/j.atmosenv.2012.02.079
- Gutzwiller, L., F. Arens, U. Baltensperger, H.W. Gäggeler, and M. Ammann. 2002a. Significance of semivolatile diesel exhaust organics for secondary HONO formation. Environ. Sci. Technol. 36:677–682. doi:10.1021/es015673b
- Gutzwiller, L., C. George, E. Ro1ssler, and M. Ammann. 2002b. Reaction kinetics of NO2 with resorcinol and 2,7-naphthalenediol in the aqueous phase at different pH. J. Phys. Chem. A 106: 12045–12050. doi:10.1021/jp026240d
- Gustafsson, R.J., G. Kyriakou, and R.M. Lambert. 2009. The molecular mechanism of tropospheric nitrous acid production on mineral dust surfaces. Chem. Phys. Chem. 9:1390–1393. doi:10.1002/cphc.200800259
- Han, C., Y. Liu, and H. He. 2013a. Role of Organic carbon in heterogeneous reaction of NO2 with soot. Environ. Sci. Technol. 47:3174−3181. doi:10.1021/es304468n
- Han, C., Y. Liu, and H. He. 2013b. Heterogeneous photochemical aging of soot by NO2 under simulated sunlight. Atmos. Environ. 64:270–276. doi:10.1016/j.atmosenv.2012.10.008
- Harrison, R.M., and A.-M. Kitto. 1994. Evidence for a surface source of atmospheric nitrous acid. Atmos. Environ. 28:1089–1094. doi:10.1016/1352-2310(94)90286-0
- Harrison, R.M., J.D. Peak, and G.M. Collins. 1996. Tropospheric cycle of nitrous acid, J. Geophys. Res. 101:14,429–14,439. doi:10.1029/96JD00341
- He, Y., X. Zhou, J. Hou, H. Gao, and S.B. Bertman. 2006. Importance of dew in controlling the air-surface exchange of HONO in rural forested environments. Geophys. Res. Lett. 33:L02813. doi:10.1029/2005GL024348
- Heland, J., J. Kleffmann, R. Kurtenbach, and P. Wiesen. 2001. A new instrument to measure gaseous nitrous acid (HONO) in the atmosphere. Environ. Sci. Technol. 35:3207–3212. doi:10.1021/es000303t
- Honrath, R.E., Y. Lu, M.C. Peterson, J.E. Dibb, M.A. Arsenault, N.J. Cullen, and K. Steffen. 2002. Vertical fluxes of NOx, HONO, and HNO3 above the snowpack at Summit, Greenland. Atmos. Environ. 36:2629–2640. doi:10.1016/S1352-2310(02)00132-2
- Hofzumahaus, A., F. Rohrer, K. Lu, B. Bohn, T. Brauers, C.-C. Chang, H. Fuchs, F. Holland, K. Kita, Y. Kondo, X. Li, S. Lou, M. Shao, L. Zeng, A. Wahner, and Y. Zhang. 2009. Amplified trace gas removal in the troposphere. Science 324:1702–1704. doi:10.1126/science.1164566
- Ianniello, A., H.J. Beine, M.S. Landis, R.K. Stevens, G. Esposito, A. Amoroso, and I. Allegrini. 2007. Comparing field performances of denuder techniques in the high Arctic. Atmos. Environ. 41:1604–1615. doi:10.1016/j.atmosenv.2006.10.040
- Ianniello, A., H.J. Beine, R. Sparapani, F. Di Bari, I. Allegrini, and J.D. Fuentes. 2002. Denuder measurements of gas and aerosol species above Arctic snow surfaces at Alert 2000. Atmos. Environ. 36:5299–5309. doi:10.1016/S1352-2310(02)00646-5
- Jenkin, M.E., R.A. Cox, and D.J. Williams. 1988. Laboratory studies of the kinetics of formation of nitrous acid from the thermal reaction of nitrogen dioxide and water vapour. Atmos. Environ. 22:487–498. doi:10.1016/0004-6981(88)90194-1
- Kirchstetter, T., and R. Harley, and D. Littlejohn. 1996. Measurement of nitrous acid in motor vehicle exhaust. Environ. Sci. Technol. 30:2843–2849. doi:10.1021/es960135y
- Kleffmann, J. 2007. Daytime sources of nitrous acid (HONO) in the atmospheric boundary layer. Chem. Phys. Chem. 8:1137–1144. doi:10.1002/cphc.200700016
- Kleffmann, J., K.H. Becker, M. Lackhoff, and P. Wiesen. 1999. Heterogeneous conversion of NO2 on carbonaceous surfaces. Phys. Chem. Chem. Phys. 1:5443–5450. doi:10.1039/A905545B
- Kleffmann, J., K.H. Becker, and P. Wiesen. 1998a. Heterogeneous NO2 conversion processes on acid surfaces possible atmospheric implications. Atmos. Environ. 32:2721–2729. doi:10.1016/S1352-2310(98)00065-X
- Kleffmann J., K.H. Becker, and P. Wiesen. 1998b. Investigation of the heterogeneous NO2 conversion on perchloric acid surfaces. J. Chem. Soc. Faraday Trans. 94:3289–3292. doi:25/02/2014 09:57:02
- Kleffmann, J., T. Benter, and P. Wiesen. 2004. Heterogeneous reaction of nitric acid with nitric oxide on glass surfaces under simulated atmospheric conditions. J. Phys. Chem. A 108:5793–5799. doi:10.1021/jp040184u
- Kleffmann, J., T. Gavriloaiei, A. Hofzumahaus, F. Holland, R. Koppmann, L. Rupp, E. Schlosser, M. Siese, and A. Wahner. 2005. Daytime formation of nitrous acid: A major source of OH radicals in a forest. Geophys. Res. Lett. 32:L05818. doi:10.1029/2005GL022524
- Kleffmann, J., J. Heland, R. Kurtenbach, J.C. Lörzer, and P. Wiesen. 2002. A new instrument (LOPAP) for the detection of nitrous acid (HONO). Environ. Sci. Pollut. Res. 9:48–54.
- Kleffmann, J., R. Kurtenbach, J. Lörzer, P. Wiesen, N. Kalthoff, B. Vogel, and H. Vogel. 2003. Measured and simulated vertical profiles of nitrous acid—Part I: Field measurements. Atmos. Environ. 37:2949–2955. doi:10.1016/S1352-2310(03)00242-5
- Kleffmann, J., J.C. Lörzer, P. Wiesen, C. Kern, S. Trick, R. Volkamer, M. Rodenas, and K. Wirtz. 2006. Intercomparison of the DOAS and LOPAP techniques for the detection of nitrous acid (HONO). Atmos. Environ. 40:3640–3652. doi:10.1016/j.atmosenv.2006.03.027
- Kleffmann, J., and P. Wiesen. 2008. Technical Note: Quantification of interferences of wet chemical HONO LOPAP measurements under simulated polar conditions. Atmos. Chem. Phys. 8:6813–6822. doi:10.5194/acp-8-6813-2008
- Kurtenbach, R., K.H. Becker, J.A.G. Gomes, J. Kleffmann, J.C. Lörzer, M. Spittler, P. Wiesen, R. Ackermann, A. Geyer, and U. Platt. 2001. Investigations of emissions and heterogeneous formation of HONO in a road traffic tunnel. Atmos. Environ. 35:3385–3394. doi:10.1016/S1352-2310(01)00138-8
- Lee, B.H., E.C. Wood, S.C. Herndon, B.L. Lefer, W.T. Luke, W.H. Brune, D.D. Nelson, M.S. Zahniser, and J.W. Munger. 2013. Urban measurements of atmospheric nitrous acid: A caveat on the interpretation of the HONO photostationary state. J. Geophys. Res. 118:12,274–12,281. doi:10.1012/2013JD020341
- Lee, B.H., E.C. Wood, M.S. Zahniser, J.B. McManus, D.D. Nelson, S.C. Herndon, G.W. Santoni, S.C. Wofsy, and J.W. Munger. 2011. Simultaneous measurements of atmospheric HONO and NO2 via absorption spectroscopy using tunable mid-infrared continuous-wave quantum cascade lasers. Appl. Phys. B 102:417–423. doi:10.1007/s00340-010-4266-5
- Lee, K., J. Xue, A.S. Geyh, H. Özkaynak, B.P. Leaderer, C.J. Weschler, and J.D. Spengler. 2002. Nitrous acid, nitrogen dioxide, and ozone concentrations in residential environments. Environ. Health Perspect. 110:145–150.
- Li, G., W. Lei, M. Zavala, R. Volkamer, S. Dusanter, P. Stevens, and L.T. Molina. 2010. Impacts of HONO sources on the photochemistry in Mexico City during the MCMA-2006/MILAGO Campaign. Atmos. Chem. Phys. 10:6551–656. doi:10.5194/acp-10-6551-2010
- Li, S., J. Matthews, and A. Sinha. 2008a. Atmospheric hydroxyl radical production from electronically excited NO2 and H2O. Science 319:1657–1660. doi:10.1126/science.1151443
- Li, X., T. Brauers, R. Häseler, B. Bohn, H. Fuchs, A. Hofzumahaus, F. Holland, S. Lou, K.D. Lu, F. Rohrer, M. Hu, L.M. Zeng, Y.H. Zhang, R.M. Garland, H. Su, A. Nowak, A. Wiedensohler, N. Takegawa, M. Shao, and A. Wahner. 2012. Exploring the atmospheric chemistry of nitrous acid (HONO) at a rural site in Southern China. Atmos. Chem. Phys. 12:1497–1513. doi:10.5194/acp-12-1497-2012
- Li, Y., J. Ana, M. Min, W. Zhang, F. Wang, and P. Xie. 2011. Impacts of HONO sources on the air quality in Beijing, Tianjin and Hebei Province of China. Atmos. Environ. 45:4735–4744. doi:10.1016/j.atmosenv.2011.04.086
- Li, Y.Q., J.J. Schwab, and K.L. Demerjian. 2008b. Fast time response measurements of gaseous nitrous acid using a tunable diode laser absorption spectrometer: HONO emission source from vehicle exhausts. Geophys. Res. Lett. 35: L04803. doi:10.1029/2007GL031218
- Liao, W., A.T. Case, J. Mastromarino, D. Tan, and J.E. Dibb. 2006. Observations of HONO by laser-induced fluorescence at the South Pole during ANTCI 2003. Geophys. Res. Lett. 33:L09810. doi:10.1029/2005GL025470
- Lu, K.D., A. Hofzumahaus, F. Holland, B. Bohn, T. Brauers, H. Fuchs, M. Hu, R. Häseler, K. Kita, Y. Kondo, X. Li, S.R. Lou, A. Oebel, M. Shao, L.M. Zeng, A. Wahner, T. Zhu, Y.H. Zhang, and F. Rohrer. 2013. Missing OH source in a suburban environment near Beijing: Observed and modelled OH and HO2. Atmos. Chem. Phys. 13:1057–1080. doi:10.5194/acp-13-1057-2013
- Lu, K.D., F. Rohrer, F. Holland, H. Fuchs, B. Bohn, T. Brauers, C.C. Chang, R. Häseler, M. Hu, K. Kita, Y. Kondo, X. Li, S.R. Lou, S. Nehr, M. Shao, L.M. Zeng, A. Wahner, Y.H. Zhang, and A. Hofzumahaus. 2012. Observation and modelling of OH and HO2 concentrations in the Pearl River Delta 2006: A missing OH source in a VOC rich atmosphere. Atmos. Chem. Phys. 12: 1541–1569. doi:10.5194/acp-12-1541-2012
- Ma, J., Y. Liu, C. Han, Q. Ma, C. Liu, and H. He. 2013. Review of heterogeneous photochemical reactions of NOy on aerosol—A possible daytime source of nitrous acid (HONO) in the atmosphere. J. Environ. Sci. 25:326–334. doi:10.1016/S1001-0742(12)60093-X
- Mochida, M., and B.J. Finlayson-Pitts. 2000. FTIR studies of the reaction of gaseous NO with HNO3 on porous glass: Implications for conversion of HNO3 to photochemically active NOx in the atmosphere. J. Phys. Chem. A 104:9705–9711. doi:10.1021/jp001471a
- Monge, M.E., B. D’Anna, and C. George. 2010a. Nitrogen dioxide removal and nitrous acid formation on titanium oxide surfaces—An air quality remediation process? Phys. Chem. Chem. Phys. 12:8991–8998. doi:10.1039/b925785c
- Monge, M.E., B. D’Anna, L. Mazri, A. Giroir-Fendler, M. Ammann, D.J. Donaldson, and C. George. 2010b. Light changes the atmospheric reactivity of soot. Proc. Natl. Acad. Sci. U. S. A. 107:6605–6609. doi:10.1073/pnas.0908341107
- Ndour, M., B. D’Anna, C. George, O. Ka, Y. Balkanski, J. Kleffmann, K. Stemmler, and M. Ammann. 2008. Photoenhanced uptake of NO2 on mineral dust: Laboratory experiments and model simulations. Geophys. Res. Lett. 35:L05812. doi:10.1029/2007GL032006
- Oswald, R., T. Behrendt, M. Ermel, D. Wu, H. Su, Y. Cheng, C. Breuninger, A. Moravek, E. Mougin, C. Delon, B. Loubet, A. Pommerening-Röser, M. Sörgel, U. Pöschl, T. Hoffmann, M.O. Andreae, F.X. Meixner, and I. Trebs. 2013. HONO emissions from soil bacteria as a major source of atmospheric reactive nitrogen. Science 341:1233–1235. doi:10.1126/science.1242266
- Pagsberg, P., E. Bjergbakke, E. Ratajczak, and A. Sillesen. 1997. Kinetics of the gas phase reaction OH + NO(+ M) → HONO(+ M) and the determination of the UV absorption cross sections of HONO. Chem. Phys. Lett. 272:383–390. doi:10.1016/S0009-2614(97)00576-9
- Perner, D., and U. Platt. 1979. Detection of nitrous acid in the atmosphere by differential optical absorption. Geophys. Res. Lett. 6:917–920. doi:10.1029/GL006i012p00917
- Pilegaard, K. 2013. Processes regulating nitric oxide emissions from soils. Phil. Trans. R. Soc. B 368:20130126. doi:10.1098/rstb.2013.0126
- Pinto, J.P., J. Dibb, B.H. Lee, B. Rappenglück, E.C. Wood, M. Levy, R.-Y. Zhang, B. Lefer, X.-R. Ren, J. Stutz, C. Tsai, L. Ackermann, J. Golovko, S.C. Herndon, M. Oakes, Q.-Y. Meng, J.W. Munger, M. Zahniser, and J. Zheng. 2014. Intercomparison of field measurements of nitrous acid (HONO) during the SHARP campaign. J. Geophys. Res. Atmos. 119:5583–5601. doi:10.1002/2013JD020287
- Pitts, J.N., Jr., H.W. Biermann, A.M. Winer, and E.C. Tuazon. 1984. Spectroscopic identification and measurement of gaseous nitrous acid in diluite auto exhaust. Atmos. Environ. 18:847–854. doi:10.1016/0004-6981(84)90270-1
- Pitts, J.N., Jr., D. Grosjean, K. van Cauwenberghe, J.P. Schmid, and D.R. Fitz. 1978. Photooxidation of aliphatic amines under simulated atmospheric conditions: Formation of nitrosamines, nitramines, amides, and photochemical oxidant. Environ. Sci. Technol. 12:946–953. doi:10.1021/es60144a009
- Platt, U., and J. Stutz. 2008. Differential Optical Absorption Spectroscopy—Principles and Applications. Berlin: Springer Publications.
- Qin, M., P.H. Xie, W.Q. Liu, A. Li, K. Dou, W. Fang, J.-G. Liu, and W.-J. Zhang. 2006. Observation of atmospheric nitrous acid with DOAS in Beijing, China. J. Environ. Sci. (China) 18:69–75. doi:1001-0742(2006)01-0069-07
- Qin, M., P.H. Xie, H. Su, J. Gu, F. Peng, S. Li, L. Zeng, J. Liu, W. Liu, and Y. Zhang. 2009. An observational study of the HONO–NO2 coupling at an urban site in Guangzhou City, South China. Atmos. Environ. 43:5731–5742. doi:10.1016/j.atmosenv.2009.08.017
- Ramazan, K.A., D. Syomin, and B.J. Finlayson-Pitts. 2004. The photochemical production of HONO during the heterogeneous hydrolysis of NO2. Phys. Chem. Chem. Phys. 6:3836–3843. doi:10.1039/b402195a
- Ramazan, K.A., | L.M. Wingen, Y. Miller,G.M. Chaban, R.B. Gerber, S.S. Xantheas, and B.J. Finlayson-Pitts. 2006. New experimental and theoretical approach to the heterogeneous hydrolysis of NO2: Key role of molecular nitric acid and its complexes. J. Phys. Chem. A 110: 6886–6897. doi:10.1021/jp056426n
- Rappenglück, B., L. Ackermann, S. Alvarez, J. Golovko, M. Buhr, R.A. Field, J. Soltis, D.C. Montague, B. Hauze, S. Adamson, D. Risch, G. Wilkerson, D. Bush, T. Stoeckenius, and C. Keslar. 2014. Strong wintertime ozone events in the Upper Green River basin, Wyoming. Atmos. Chem. Phys. 14:4909–4934. doi:10.5194/acp-14-4909-2014
- Rappenglück, B., G. Lubertino, S. Alvarez, J. Golovko, B. Czader, and L. Ackermann. 2013. Radical precursors and related species from traffic as observed and modeled at an urban highway junction. J. Air Waste Manage. Assoc. 63:11:1270–1286. doi:10.1080/10962247.2013.822438
- Rasmussen, T.R., M. Brauer, and S. Kjaergaard. 1995. Effects of nitrous acid exposure on humanmucous membranes. Am. J. Respir. Crit. Care Med. 151:1504–1511. doi:10.1164/ajrccm.151.5.7735607
- Reisinger, A.R. 2000. Observations of HNO2 in the polluted winter atmosphere: Possible heterogeneous production on aerosols. Atmos. Environ. 34: 3865–3874. doi:10.1016/S1352-2310(00)00179-5
- Ren, X., J.E. Sanders, A. Rajendran, R.J. Weber, A.H. Goldstein, S.E. Pusede, E.C. Browne, K.-E. Min, and R.C. Cohen. 2011. A relaxed eddy accumulation system for measuring vertical fluxes of nitrous acid. Atmos. Meas. Tech. 4:2093–2103. doi:10.5194/amt-4-2093-2011
- Ródenas, M., A. Muňoz, F. Alacreu, T. Brauers, H.P. Dorn, J. Kleffmann, and W. Bloss. 2013. Assessment of HONO measurements: The FIONA Campaign at EUPHORE. In Proceedings of the NATO Advanced Research Workshop on Disposal of Dangerous Chemicals in Urban Areas and Mega Cities, Gdansk, October 9–13, ed. I. Barnes and K.J. Rudziński, 45–57, Chapter 4.Poland: Springer. doi:10.1007/978-94-007-5034-0
- Rutter, A.P., Q.G.J. Malloy, Y.J. Leong, C.V. Gutierrez, M. Calzada, E. Scheuer, J.E. Dibb, and R.J. Griffin. 2014. The reduction of HNO3 by volatile organic compounds emitted by motor vehicles. Atmos. Environ. 87:200–206. doi:10.1016/j.atmosenv.2014.01.056
- Saltzman, B.E. 1954. Colorimetric micro-determination of nitrogen dioxide in the atmosphere. Anal. Chem. 26:1949–1955. doi:10.1021/ac60096a025
- Saliba, N.A., and A. Chamseddine. 2012. Uptake of acid pollutants by mineral dust and their effect on aerosol solubility. Atmos. Environ. 46:256–263. doi:10.1016/j.atmosenv.2011.09.074
- Saliba, N.A., H. Yang, and B.J. Finlayson-Pitts 2001. Reaction of gaseous nitric oxide with nitric acid on silica surfaces in the presence of water at room temperature. J. Phys. Chem. A 105:10339–10346. doi:10.1021/jp012330r
- Sarwar, G., R.W. Pinder, K.W. Appel, R. Mathur, and A.G. Carlton. 2009. Examination of the impact of photoexcited NO2 chemistry on regional air quality. Atmos. Environ. 43:6383–6387. doi:10.1016/j.atmosenv.2009.09.012
- Sarwar, G., S.J. Roselle, R. Mathur, W. Appel, R.L. Dennis, and B. Vogel. 2008. A comparison of CMAQ HONO predictions with observations from the Northeast Oxidant and Particle Study. Atmos. Environ. 42:5760–5770. doi:10.1016/j.atmosenv.2007.12.065
- Sickles, J.E., II, and L.L. Hodson. 1989. Fate of nitrous acid on selected collection surfaces. Atmos. Environ. 23:2321–2324. doi:10.1016/0004-6981(89)90193-5
- Simon, P.K., and P.K. Dasgupta. 1993. Wet effluent denuder coupled liquid/ion chromatography systems: Annular and parallel plate denuders. Anal. Chem. 65:1134–1139. doi:10.1021/ac00057a006
- Sleiman, M., L.A. Gundel, J.F. Pankow, P. Jacob III, B.C. Singer, and H. Destaillats. 2010. Formation of carcinogens indoors by surface-mediated reactions of nicotine with nitrous acid, leading to potential thirdhand smoke hazards. Proc. Natl. Acad. Sci. 107: 6576–6581. doi:10.1073/pnas.0912820107
- Sörgel, M., E. Regelin, H. Bozem, J.-M. Diesch, F. Drewnick, H. Fischer, H. Harder, A. Held, Z. Hosaynali-Beygi, M. Martinez, and C. Zetzsch. 2011. Quantification of the unknown HONO daytime source and its relation to NO2. Atmos. Chem. Phys. 11:10433–10447. doi:10.5194/acp-11-10433-2011
- Spataro, F., A. Ianniello, G. Esposito, I. Allegrini, T. Zhu, and M. Hu. 2013. Occurrence of atmospheric nitrous acid in the urban area of Beijing (China). Sci. Total Environ. 447:210–224. doi:10.1016/j.scitotenv.2012.12.065
- Spindler, G., J. Hesper, E. Brüggemann, R. Dubois, T. Müller, and H. Herrmann. 2003. Wet annular denuder measurements of nitrous acid: Laboratory study of the artefact reaction of NO2 with S(IV) in aqueous solutions and comparison with field measurements. Atmos. Environ. 37:2643–2662. doi:10.1016/S1352-2310(03)00209-7
- Stemmler, K., M. Ammann, C. Donders, J. Kleffmann, and C. George. 2006. Photosensitized reduction of nitrogen dioxide on humic acid as a source of nitrous acid. Nature 440:195–198. doi:10.1038/nature04603
- Stemmler, K., M. Ndour, Y. Elshorbany, J. Kleffmann, B. D’Anna, C. George, B. Bohn, and M. Ammann. 2007. Light induced conversion of nitrogen dioxide into nitrous acid on submicron humic acid aerosol. Atmos. Chem. Phys. 7:4237–4248. doi:10.5194/acp-7-4237-2007
- Stockwell, W.R., and J.G. Calvert. 1983. The mechanism of NO3 and HONO formation in the nighttime chemistry of the urban atmosphere. J. Geophys. Res. 88:6673–6682. doi:10.1029/JC088iC11p06673
- Stutz, J., B. Alicke, R. Ackermann, A. Geyer, S. Wang, A.B. White, E.J. Williams, C.W. Spicer, and J.D. Fast. 2004. Relative humidity dependence of HONO chemistry in urban areas. J. Geophys. Res. 109:D03307. doi:10.1029/2003JD004135
- Stutz, J., B. Alicke, and A. Neftel. 2002. Nitrous acid formation in the urban atmosphere: Gradient measurements of NO2 and HONO over grass in Milan, Italy. J. Geophys. Res. 107:LOP 5-1–LOP 5-15.
- Stutz, J., H.-J. Oha, S.I. Whitlow, C. Anderson, J.E. Dibb, J.H. Flynn, B. Rappenglück, and B. Lefer. 2010. Simultaneous DOAS and mist-chamber IC measurements of HONO in Houston, TX. Atmos. Environ. 44:4090–4098. doi:10.1016/j.atmosenv.2009.02.003
- Su, H., Y.F. Cheng, P. Cheng, Y.H. Zhang, S. Dong, L.M. Zeng, X. Wang, J. Slanina, M. Shao, and A. Wiedensohler. 2008a. Observation of nighttime nitrous acid (HONO) formation at a nonurban site during PRIDE-PRD2004 in China. Atmos. Environ. 42:6219–6232. doi:10.1016/j.atmosenv.2008.04.006
- Su, H., Y. Cheng, R. Oswald, T. Behrendt, I. Trebs, F.X. Meixner, O.A. Meinrat, Y. Zhang, and U. Pöschl, 2011. Soil nitrite as a source of atmospheric HONO and OH radicals. Science 333:1616–1618. doi:10.1126/science.1207687
- Su, H., Y.F. Cheng, M. Shao, D.F. Gao, Z.Y. Yu, L.M. Zeng, J. Slanina, Y.H. Zhang, and A. Wiedensohler. 2008b. Nitrous acid (HONO) and its daytime sources at a rural site during the 2004 PRIDE-PRD experiment in China. J. Geophys. Res. 113:D14312. doi:10.1029/2007JD009060
- Trebs, I., F.X. Meixner, J. Slanina, R. Otjes, P. Jongejan, and M.O. Andreae. 2004. Real-time measurements of ammonia, acidic trace gases and water-soluble inorganic aerosol species at a rural site in the Amazon Basin. Atmos. Chem. Phys. 4:967–987. doi:10.5194/acp-4-967-2004
- Tyndall, G.S., J.J. Orlando, and J.G. Calvert. 1995. Upper limit for the rate coefficient for the reaction HO2 + NO2 → HONO + O2. Environ. Sci. Technol. 29:202–206. doi:10.1021/es00001a026
- Usher, C.R., A.E. Michel, and V.H. Grassian. 2003. Reactions on mineral dust. Chem. Rev. 103:4883–4939. doi:10.1021/cr020657y
- VandenBoer, T.C., S.S. Brown, J.G. Murphy, W.C. Keene, C.J. Young, A.A.P. Pszenny, S. Kim, C. Warneke, J.A. de Gouw, J.R. Maben, N.L. Wagner, T.P. Riedel, J.A. Thornton, D.E. Wolfe, W.P. Dubé, F. Öztürk, C.A. Brock, N. Grossberg, B. Lefer, B. Lerner, A.M. Middlebrook, and J.M. Roberts. 2013. Understanding the role of the ground surface in HONO vertical structure: High resolution vertical profiles during NACHTT-11. J. Geophys. Res. Atmos. 118:10,155–10,171. doi:10.1002/jgrd.50721, 2013
- Villena, G, J. Kleffmann, R. Kurtenbach, P. Wiesen, E. Lissi, M.A. Rubio, G. Croxatto, and B. Rappenglück. 2011a. Vertical gradients of HONO, NOx and O3 in Santiago de Chile. Atmos. Environ. 45:3867–3873. doi:10.1016/j.atmosenv.2011.01.073
- Villena, G., P. Wiesen, C.A. Cantrell, F. Flocke, A. Fried, S.R. Hall, R.S. Hornbrook, D. Knapp, E. Kosciuch, R.L. Mauldin III, J.A. McGrath, D. Montzka, D. Richter, K. Ullmann, J. Walega, P. Weibring, A. Weinheimer, R.M. Staebler, J. Liao, L.G. Huey, and J. Kleffmann. 2011b. Nitrous acid (HONO) during polar spring in Barrow, Alaska: A net source of OH radicals? J. Geophys. Res. 116: D00R07. doi:10.1029/2011JD016643
- Vogel, B., H. Vogel, J. Kleffmann, and R. Kurtenbach. 2003. Measured and simulated vertical profiles of nitrous acid—Part II. Model simulations and indications for a photolytic source. Atmos. Environ. 37:2957–2966. doi:10.1016/S1352-2310(03)00243-7
- Wang, L., and J. Zhang. 2000. Detection of nitrous acid by cavity ring-down spectroscopy. Environ. Sci. Technol. 34:4221–4227. doi:10.1021/es0011055
- Wang, S., R. Ackermann, C.W. Spicer, J.D. Fast, M. Schmeling, and J. Stutz. 2003. Atmospheric observations of enhanced NO2-HONO conversion on mineral dust particles. Geophys. Res. Lett. 30:1595. doi:10.1029/2003GL017014
- Wong, K.W., H.-J. Oh, B.L. Lefer, B. Rappenglück, and J. Stutz. 2011. Vertical profiles of nitrous acid in the nocturnal urban atmosphere of Houston, TX. Atmos. Chem. Phys. 11:3595–3609. doi:10.5194/acp-11-3595-2011
- Wong, K.W., C. Tsai, B. Lefer, C. Haman, N. Grossberg, W.H. Brune, X. Ren, W. Luke, and J. Stutz. 2012. Daytime HONO vertical gradients during SHARP 2009 in Houston, TX. Atmos. Chem. Phys. 12:635–652, 2012. doi:10.5194/acp-12-635-2012
- Zellweger, C., M. Amman, P. Hofer, and U. Baltensperger. 1999. NOy speciation with a combined wet effluent diffusion denuder-aerosol collector coupled to ion chromatography. Atmos. Environ. 33:1131–1140. doi:10.1016/S1352-2310(98)00295-7
- Zhang, R., G. Sarwar, J.C.H. Fung, A.K.H. Lau, and Y. Zhang. 2012. Examining the impact of nitrous acid chemistry on ozone and PM over the Pearl River Delta region. Adv. Meteorol. 2012:140932. doi:10.1155/2012/140932
- Zhou, X. 2013. An overview of measurement techniques for atmospheric nitrous acid. In Proceedings of the NATO Advanced Research Workshop on Disposal of Dangerous Chemicals in Urban Areas and Mega Cities, Gdansk, October 9–13, ed. I. Barnes and K. J. Rudziński, 29–44, Chapter 3.Poland: Springer. doi:10.1007/978-94-007-5034-0
- Zhou, X., H.J. Beine, R.E. Honrath, J.D. Fuentes, W. Simpson, P.B. Shepson, and J.W. Bottenheim. 2001. Snowpack photochemical production of HONO: A major source of OH in the Arctic boundary layer in springtime. Geophys. Res. Lett. 28:4087–4090. doi:10.1029/2001GL013531
- Zhou, X., H. Qiao, G. Deng, and K. Civerolo. 1999. A method for the measurement of atmospheric HONO based on DNPH derivatization and HPLC analysis. Environ. Sci. Technol. 33:3672–3679. doi:10.1021/es981304c
- Zhou, X., N. Zhang, M. TerAvest, D. Tang, J. Hou, S. Bertman, M. Alaghmand, P.B. Shepson, M.A. Carroll, S. Griffith, S. Dusanter, and P.S. Stevens. 2011. Nitric acid photolysis on forest canopy surface as a source for tropospheric nitrous acid. Nat. GeoSci. 4:440–443. doi:10.1038/NGEO1164
- Zhou, X.L., K. Civerolo, H.P. Dai, G. Huang, J. Schwab, and K. Demerjian. 2002. Summertime nitrous acid chemistry in the atmospheric boundary layer at a rural site in New York State. J. Geophys. Res. 107:4590–4600. doi:10.1029/2001JD001539
- Zhou, X.L., H.L. Gao, Y. He, G. Huang, S.B. Bertman, K. Civerolo, and J. Schwab. 2003. Nitric acid photolysis on surfaces in low-NOx environments: Significant atmospheric implications. Geophys. Res. Lett. 30:2217–2220. doi:10.1029/2003GL018620
- Ziemba, L.D., J.E. Dibb, R.J. Griffin, C.H. Anderson, S.I. Whitlow, B.L. Lefer, B. Rappenglück, and J. Flynn. 2010. Heterogeneous conversion of nitric acid to nitrous acid on the surface of primary organic aerosol in an urban atmosphere. Atmos. Environ. 44:4081–4089. doi:10.1016/j.atmosenv.2008.12.024